
記住我


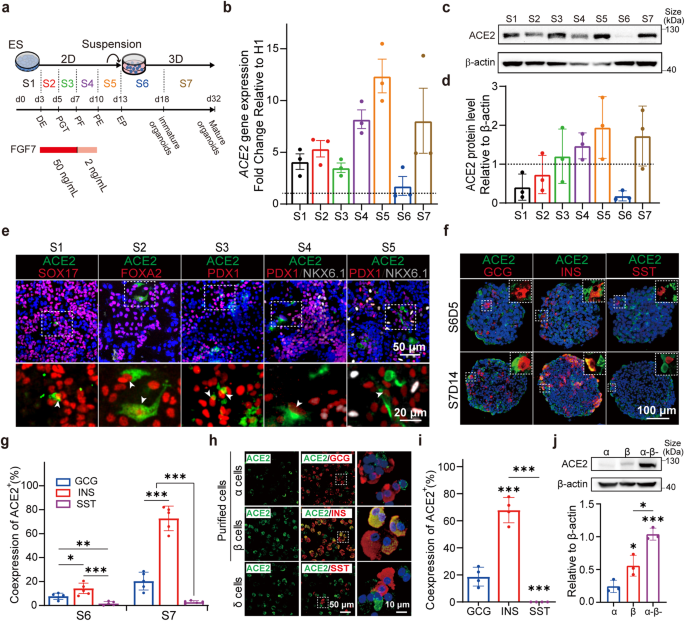


The previous study has uncovered the landscape of genomic alterations of RBPs by cross-cancer analysis.22 By utilizing online cBioPortal tool (http://www.cbioportal.org) including 19 CRC datasets, we noted that cancer-related RBP MEX3A was distinctly and significantly amplified and overexpressed in human CRCs (Fig. 1a, b). We then examined the copy number and protein expression of MEX3A in CRCs. Consistently, MEX3A tended to be markedly amplified and upregulated in CRCs compared with matched adjacent noncancerous tissues (Fig. 1c, d). Next, we performed immunohistochemistry (IHC) staining of 88 CRC tissues and 5 matched noncancerous colorectal tissues obtained from Sun Yat-sen University Cancer Center (SYSUCC). The results unveiled a remarkable elevation of cytoplasmic MEX3A expression in CRC tissues compared with adjacent normal tissues (Fig. 1e). High expression of MEX3A in CRCs was positively associated with clinical stage and advanced T and N stages (P < 0.05; Supplementary Table S1, 2), and predicted poorer patient overall survival (OS) (P < 0.05; Fig. 1f). These data suggest that the upregulation of MEX3A exerts an oncogenic effect in CRC pathogenesis.
Fig. 1
MEX3A is highly expressed in CRCs and suppresses autophagy of CRC cells. a Copy number variations (CNVs) of the MEX3A gene in 1344 patients from the 19 CRC cohorts in online cBioPortal tool (http://www.cbioportal.org). b mRNA expression of MEX3A in 50 tumors (T) and paired adjacent normal tissues (N) in the TCGA CRC cohort. c Absolute quantification of copy numbers of MEX3A in 10 CRC tissues (T) and matched adjacent noncancerous tissues (N) from the SYSUCC. Y-axes showing the DNA molecules per PCR reaction. d Western blotting of MEX3A protein expression in 10 CRC tissues (T) and matched adjacent noncancerous tissues (N) from the SYSUCC. GAPDH was used as the loading control. e Left, representative IHC staining for MEX3A in normal samples (left) and CRCs (right). Scale bar, 100 μm. Right, quantified H-score of cytosolic MEX3A in CRC tissues (T) and noncancerous tissues (N). f Kaplan-Meier analysis of overall survival (OS) in CRC patients with low versus high MEX3A expression from SYSUCC cohorts (n = 88). g Western blotting for LC3 conversion and p62 expression in control or MEX3A-knockdown cells in the absence or presence of serum or Chloroquine (CQ). GAPDH was used as an internal control. h Detection of autophagic flux with the mRFP-GFP-LC3 reporter in indicated cells. Yellow puncta represent autophagosomes (mRFP+/GFP+), and red puncta represent autolysosomes (mRFP+/GFP−). Scale bar, 10 μm. i Representative transmission electron microscope (TEM) images of the autophagosomes and/or autolysosomes in indicated cells. Scale bar, 500 nm. Data are represented as mean ± S.D. (c, e), and the P value was determined by two-tailed paired Student’s t test (b, c) or two-tailed unpaired Student’s t test (e) or Log-rank test (f)
MEX3A accelerates the malignant properties and suppresses autophagy of CRC cellsTo investigate the role of MEX3A in CRC cells, we constructed two stable MEX3A-knockdown CRC cell lines (DLD-1 and SW480) using two short hairpin RNAs (shRNAs), and one stable MEX3A-overexpression cell line HCT116 (Supplementary Fig. S1a). MEX3A knockdown significantly attenuated CRC cells colony formation and migration in vitro (Supplementary Fig. S1b, c), whereas MEX3A overexpression enhanced the malignant properties (Supplementary Fig. S1d, e). In the subcutaneous xenograft model, MEX3A knockdown substantially reduced the in vivo tumorigenicity and tumor weights (Supplementary Fig. S1f). Conversely, nude mice injected with MEX3A-overexpressed cells had a significantly increased tumor growth (Supplementary Fig. S1g). Overall, MEX3A aggravates the CRC progression.
Given that RBPs mainly exert their distinct role by interaction with mRNAs, we performed RNA-binding protein immunoprecipitation and deep sequencing (RIP-Seq) to detect MEX3A-binding mRNAs. Kyoto Encyclopedia of Genes and Genomes (KEGG) pathway analysis illustrated that mRNAs bound to MEX3A were chiefly enriched in the FoxO signaling pathway, which was known as a vital regulatory circuit of autophagy activity,23 and the autophagy pathway (Supplementary Fig. S2a). These results indicate that autophagy may play an essential role in MEX3A-mediated CRC progression.
Then we assessed whether MEX3A participates in autophagy occurrence. Upon serum starvation, knockdown of MEX3A promoted the autophagic flux as indicated by an increase of LC3-II, a hallmark of autophagic activity. This effect was prolonged by treatment with the lysosomotropic alkalizing agent Chloroquine (CQ). As an indicator of autophagy flux inhibition, p62 is known to degrade in autolysosomes.24 Starvation-stimulated p62 decay occurred in control cells, while MEX3A knockdown reduced p62 accumulation, suggesting the increased autophagy flux. Interestingly, starvation-induced reduction in p62 levels in both control and MEX3A-knockdown cells was blocked by CQ treatment (Fig. 1g). In contrast, MEX3A overexpression decreased LC3-II accumulation and increased p62 levels in starved cells (Supplementary Fig. S2b). We further performed the mRFP-GFP-LC3 assay to monitor the autophagy flux. While the LC3B signal was diffuse in the cytoplasm under basal conditions, starvation triggered the formation of fluorescent LC3 puncta. Notably, MEX3A-knockdown cells had more autophagosomes and/or autolysosomes, as suggested by an increase of yellow and/or red puncta (Fig. 1h, Supplementary Fig. S2c). Conversely, MEX3A overexpression potently impeded the autophagosome maturation (Supplementary Fig. S2d). Ultra-structurally, the number of autophagosomes and autolysosomes was strongly increased in CRC cells upon MEX3A knockdown by transmission electron microscope (TEM) (Fig. 1i). In contrast, MEX3A-overexpressed CRC cells greatly inhibited the formation of autophagosomes and autolysosomes (Supplementary Fig. S2e). Collectively, these data illustrate that MEX3A inhibits the autophagy program and thus promotes CRC progression.
MEX3A undergoes IDRs-dependent LLPS in vitro and in vivoThe MEX3A protein appears to contain several intrinsically disordered regions (IDRs) predicted by online IUPred2A tool (http://iupred2a.elte.hu) (Fig. 2a) which are known to result in the formation of phase separation droplets.25,26 To investigate whether MEX3A undergoes LLPS through IDRs, we constructed MEX3A full-length and two IDRs truncated mutant plasmids (Fig. 2b). We first purified full-length recombinant MEX3A. MEX3A solutions were transparent at 4 °C and turned opaque gradually as the temperature increased to 37 °C (Fig. 2c). Under phase-contrast microscopy, micrometer-sized droplets spontaneously increased in size and number with elevated concentrations of MEX3A and NaCl in solutions (Fig. 2d). Truncating the IDRs showed remarkably increased droplets size and number, while deleting the IDRs made it difficult to observe droplets compared to the full-length MEX3A (Fig. 2c, d). These findings align with the reported view that phase separation exhibits temperature, protein, and salt concentration dependence.27
Fig. 2
MEX3A undergoes IDRs-dependent LLPS and physically interacts with PBs components. a Domain structure and the intrinsically disordered regions (IDRs) of MEX3A. The IUPred score greater than 0.5 indicates disordered, as determined by the online IUPred2A algorithm (http://iupred2a.elte.hu). b The schematic diagram representing the MEX3A full-length and IDRs truncated mutant plasmids. c Representative images of turbidity associated with droplet formation. Tubes contain either only buffer (−) or recombination proteins (+) at the indicated temperature. d Representative phase-contrast microscopy images of MEX3A-FL and MEX3A-IDRs droplets formed in buffers containing 150 mM NaCl and different concentrations of protein (left) or 100 μM protein and different concentrations of NaCl (right). Scale bar, 50 μm. e Immunofluorescence (IF) assay showing EGFP-MEX3A-FL, EGFP-MEX3A-IDRs, EGFP-MEX3A-IDRs△(green) formed cytoplasmic puncta in DLD-1 cells. Nuclei were stained with DAPI (blue). Scale bar, 10 μm. f Fluorescence recovery after photobleaching (FRAP) assay of the droplets formed by EGFP-MEX3A-FL and EGFP-MEX3A-IDRs in DLD-1 cells. Top, representative images. Scale bar, 500 nm. Bottom, quantification of fluorescence intensity recovery after photobleaching. g Kyoto Encyclopedia of Genes and Genomes (KEGG) pathway enrichment analysis showing the proteins interacting with MEX3A involved in the RNA catabolic process, RNA nonsense-mediated decay, and translation. The size of the dot indicates the number of genes per pathway. h Western blotting of MEX3A-IP assay showing the binding between MEX3A and the PBs proteins in 293 T (left) and DLD-1 cells (right). i IF assay showing that MEX3A was colocalized with the PBs proteins MOV10, PABP1, and UPF1 in DLD-1 cells. Nuclei were stained with DAPI (blue). Scale bar, 10 μm
To assess whether MEX3A and truncations also form liquid-like droplets in live cells, we ectopically expressed EGFP–MEX3A in CRC cells and observed that EGFP–MEX3A exhibited discrete puncta distribution in the cytoplasm (Fig. 2e, Supplementary Fig. S3a). Using the fluorescence recovery after photobleaching (FRAP) assay, we observed that the fluorescent signal of EGFP-MEX3A punctum recovered 70% within 6 min after photobleaching (Fig. 2f, Supplementary Fig. S3b, Supplementary Movie S1-2), indicating that MEX3A can exchange between the droplet aggregation and the surrounding cytosol. Moreover, cells transfected with EGFP-MEX3A-IDRs showed massive droplet-like condensates in the cytoplasm, which gradually fused over time and recovered 90% within 6 min after photobleaching. In contrast, cells transfected with EGFP-MEX3A-IDRs△ presented limited cytoplasmic puncta that were unable to fuse and recover after photobleaching (Fig. 2e, f, Supplementary Fig. S3a, b, Supplementary Movie S3–6). Furthermore, upon the IDRs deletion, the increased subcutaneous tumor growth by MEX3A overexpression was attenuated (Supplementary Fig. S3c, d). Collectively, these results suggest that the IDRs of MEX3A are required for its LLPS and function in CRC tumorigenesis.
MEX3A physically interacts with PBs componentsTo explore the underlying mechanisms of MEX3A in promoting CRC pathogenesis, we performed co-immunoprecipitation (co-IP) assay and mass spectrometry analysis to screen MEX3A-interacting partners in 293T cells (Supplementary Fig. S4a). Intriguingly, we filtered several proteins mainly involved in the RNA catabolic process, RNA nonsense-mediated decay and translation, among which have been previously identified as PBs-associated RBPs, including MOV10, UPF1, DDX6, and PABP1 et al. (Fig. 2g, Supplementary Table S3). Co-IP assay further validated the association of MEX3A with MOV10, PABP1, and UPF1 in 293T and CRC cells (Fig. 2h, Supplementary Fig. S4b). By performing immunofluorescence (IF) assay, we confirmed that exogenously expressed EGFP-MEX3A was concentrated in cytoplasmic MOV10- or PABP1- or UPF1-containing foci (Fig. 2i, Supplementary Fig. S4c). Consistent with the previous discovery for MCF7 cells that MEX3A localizes to DCP1a-containing PBs,28 our findings strongly support that MEX3A protein is one component of PBs.
MEX3A forms a complex with circMPP6 in PBsGiven that PBs arise as a consequence of high local concentrations of key proteins and RNAs, we wondered whether small RNAs participate in the MEX3A-guided PBs homeostasis. To further identify the potential MEX3A-binding circRNAs, we performed RIP assay and small RNA-Seq analysis. From previous CircRNA MicroArray data of CRC tissues (GSE121895),18 2784 circRNAs were upregulated (fold change >2). Among these, only two circRNAs were predicted to bind to MEX3A (Input >1, fold change >2). Subsequently, we screened MOV10-binding circRNAs from published RBP crosslinking-immunoprecipitation and high-throughput sequencing (CLIP-Seq) datasets in CircInteractome (https://circinteractome.nia.nih.gov/) and identified circ_0001686 for further investigation (Fig. 3a).
Fig. 3
MEX3A forms a complex with circMPP6 in PBs. a Venn diagram showing the overlap between CRC tissue CircRNA MicroArray, RIP-Seq analysis of Flag-MEX3A, and CLIP-Seq analysis of MOV10 by CircInteractome (https://circinteractome.nia.nih.gov/). b The genomic locus of circMPP6. Left, Sanger sequencing showing the back splicing junction site of circMPP6. Right, PCR products with or without RNase R pre-treatment showing circularization of circMPP6 in DLD-1 and SW480 cells. cDNA, complementary DNA. c RNA fluorescence in situ hybridization (RNA FISH) assay showing the distribution of circMPP6 in DLD-1 and SW480 cells. Nuclei were stained with DAPI (blue). Scale bar, 10 µm. d qRT–PCR analysis of RIP assay verifying the binding of circMPP6 to MEX3A and MOV10 in DLD-1 and SW480 cells. IgG antibody served as the negative control. e Western blotting of circMPP6 Pull-down assay showing the specific association of MEX3A and MOV10 protein with circMPP6 in DLD-1 and SW480 cells. f IF-FISH assays showing that the colocalization of MEX3A/MOV10/circMPP6 was increased after incubation with 20 μg/mL puromycin for 4 h in DLD-1 and SW480 cells. Left, representative images. Nuclei were stained with DAPI (blue). Scale bar, 10 µm. Right, Pearson’s correlation coefficient analysis. Data are represented as mean ± S.D. from three independent experiments (d, f). The P value was determined by a two-tailed unpaired Student’s t test (f)
Referring to the human reference genome (GRCh37/hg19), circ_0001686 is mapped to the exons 3–10 regions within the MPP6 locus, and thus termed as circMPP6. Then we conducted a series of experiments to characterize circMPP6. Sanger sequencing after RT-PCR with divergent primers verified the specific back-splicing junction site (Fig. 3b). Following RNase R and Actinomycin D treatment assays demonstrated that circMPP6 was more resistant to RNase R and more stable than the parental MPP6 mRNA (Supplementary Fig. S5a, b). Furthermore, nuclear and cytoplasmic fractionation assay revealed that circMPP6 was predominantly localized in the cytoplasm (Supplementary Fig. S5c). Notably, fluorescence in situ hybridization (FISH) examination presented the cytoplasmic punctate distribution of circMPP6 (Fig. 3c).
We examined the expression of circMPP6 in 30 CRC tissues compared to paired normal tissues and found that the circRNA was significantly increased in CRC tissues (Supplementary Fig. S5d). Using RIP and RNA Pull-down assays, we confirmed that circMPP6 interacted with MEX3A and MOV10 (Fig. 3d, e, Supplementary Fig. S5e), a core component of PBs. Further, we incubated CRC cells in the absence or presence of puromycin, a stimulant of PBs formation. From immunofluorescence and RNA fluorescence in situ hybridization (IF-RNA FISH) assays, we detected that MEX3A, MOV10, and circMPP6 presented cytoplasmic colocalization under physiological conditions. Strikingly, the treatment of puromycin accelerated the recruitment of circMPP6 and MEX3A protein into cytoplasmic foci which stained positive for the MOV10 marker (Fig. 3f). Moreover, we also tested whether circMPP6 has similar function to MEX3A in CRC cells. As indicated by colony formation and Transwell migration assays, circMPP6 overexpression greatly increased cell proliferation and migration abilities of CRC cells (Supplementary Fig. S6a–c). As expected, in subcutaneous xenograft model, circMPP6 overexpression substantially enhanced the tumorigenicity and tumor growth of CRC cells (Supplementary Fig. S6d), which indicates the potential mediator role of circMPP6 for MEX3A. These data reveal the formation of the MEX3A/circMPP6 complex, and indicate a close relationship between the MEX3A/circMPP6 complex and the PBs formation in CRC cells.
circMPP6 facilitates PBs aggregation by strengthening MEX3A-PBs components’ interactionWe next explored how circMPP6 regulates the function of MEX3A. Western blotting showed that circMPP6 knockdown did not affect MEX3A expression (Supplementary Fig. S7a). MEX3A is known to involve in protein ubiquitylation.29 Since circRNAs can modulate proteins degradation by acting as a scaffold,30,31 we wondered if the MEX3A/circMPP6 complex affects the protein expression of certain PBs components. Western blotting showed that the expression of PBs components remained unaffected upon MEX3A and/or circMPP6 knockdown (Supplementary Fig. S7a), excluding the possibility that the MEX3A/circMPP6 complex functions in this way.
We then focused on the accumulations of PBs. IF-RNA FISH assays showed that in puromycin pre-condition, the absence of MEX3A and/or circMPP6 induced P bodies dissociation, whilst both MEX3A and circMPP6 fluorescent-tagged fusions were presented in the cytoplasm (Fig. 4a, Supplementary Fig. S7b). Thus, we hypothesized that the MEX3A/circMPP6 complex may modulate PBs assembly. To determine whether circMPP6 affects the binding of MEX3A with the three PBs-related proteins, co-IP was performed using control or circMPP6-knockdown CRC cells. Notably, when equal amounts of MEX3A proteins were pulled down, silencing of circMPP6 decreased the abundance of PBs-related proteins, including MOV10, PABP1, and UPF1, in MEX3A immunoprecipitated fractions. Moreover, treatment with RNase A (an RNA endonuclease degrading circRNAs) severely weakened these interactions (Supplementary Fig. S7c). We then assumed that circMPP6 may reinforce the interaction of MEX3A, MOV10, PABP1, and UPF1 to form multiple complexes. To validate this hypothesis, we separated the lysates of either control or circMPP6-knockdown CRC cells by sucrose gradient sedimentation. Western blotting was used to examine the sedimentation profile of each protein for individual sucrose gradient fractions. MEX3A, MOV10, PABP1, and UPF1 showed a comparable distribution ranging from fraction 1 to fraction 4, indicating the formation of a multi-protein complex in CRC cells. Moreover, the distribution of circMPP6 visualized by agarose gel electrophoresis was also enriched in fraction 1 to 4. In the extract derived from circMPP6-knockdown cells, we detected a very low level of MEX3A-PBs components complex in fraction 3 and 4; MEX3A displayed a high level in fraction 1; MOV10, PABP1, and UPF1 migrated to the higher molecular weight fractions (Fig. 4b, Supplementary Fig. S7d). Collectively, these results suggest the accumulation of MEX3A with the protein components of PBs dependent on circMPP6.
Fig. 4
circMPP6 facilitates PBs aggregation by strengthening MEX3A-PBs components' interaction. a IF-FISH assays showing that the colocalization of MEX3A/circMPP6/MOV10 was decreased upon knockdown of MEX3A and/or circMPP6 after treatment with puromycin in DLD-1 cells. Nuclei were stained with DAPI (blue). Scale bar, 10 µm. b Sucrose gradient fraction analysis of a whole-cell lysate from control (top) and circMPP6-knockdown (bottom) DLD-1 cells. c Top, the schematic diagram representing the Flag-MEX3A truncations. Bottom, qRT–PCR analysis of RIP assay showing the interactions between circMPP6 and each truncation. d Western blotting of Flag-IP assay in DLD-1 cells showing the interactions between PBs proteins and each truncation. e Western blotting showing the changes of LC3 conversion and p62 expression upon MEX3A knockdown could be rescued by overexpression of WT, but not the mutant MEX3A in DLD-1 cells. Representative images of the autophagic flux with the mRFP-GFP-LC3 reporter (f), and ultrastructural autophagosomes and/or autolysosomes (g) illustrating that MEX3A knockdown-induced autophagy could be counteracted by overexpression of WT, but not the mutant MEX3A in DLD-1 cells. Scale bar, 10 μm (f), 500 nm (g). Data are represented as mean ± S.D. from three independent experiments (c)
We further sought to determine whether circMPP6 serves as a scaffold to bring MEX3A and the three proteins together, promoting PBs aggregation. To identify the domain of MEX3A bound to circMPP6, we constructed MEX3A mutants by individually truncating heterogeneous nuclear ribonucleoprotein K homology (KH) domains, a conserved region of 65–70 amino acids that interacts with RNA.32 RIP assay showed that both the KH1 and KH2 domains of MEX3A are responsible for the MEX3A/circMPP6 complex formation (Fig. 4c, Supplementary Fig. S8a). Further co-IP investigation revealed that MEX3A recruited these three PBs-related factors via its KH2 domain (Fig. 4d, Supplementary Fig. S8b). Overall, we confirmed that the KH2 domain of MEX3A bound with circMPP6 is required for recruiting PBs components.
We subsequently investigated if the KH2 domain contributes to MEX3A-mediated CRC aggressiveness. Rescue assays showed that exogenous expression of MEX3A wild-type (WT), but not MEX3A KH2 deletion, distinctly reversed the pro-autophagic effect of silencing MEX3A (Fig. 4e–g, Supplementary Fig. S9a-c). Consistently, colony formation and Transwell migration assays demonstrated that enforced expression of MEX3A WT, but not MEX3A KH2 deletion reversed the proliferation and metastasis-inhibitory effects of silencing MEX3A (Supplementary Fig. S9d, e). These data emphasize the crucial role of the KH2 domain in MEX3A-mediated CRC aggressiveness.
To better characterize the binding of circMPP6 with MEX3A, we re-analyzed the RIP-Seq data and identified the CACU RNA sequence as a MEX3A-binding motif (Supplementary Fig. S10a). Surprisingly, there is a CACU motif in the exon 10−exon 3 junction sequence of circMPP6. We next synthesized a biotin-labeled circMPP6 WT probe and mutant probe of which the CACU motif changed to GUGC (Supplementary Fig. S10b). RNA Pull-down assay showed that MEX3A was immunoprecipitated by the circMPP6 WT probe but not the control or mutant probe (Supplementary Fig. S10c). Consistently, in vitro RNA electrophoretic mobility shift assay (RNA-EMSA) verified that the CACU motif within circMPP6 is responsible for its binding with MEX3A (Supplementary Fig. S10d). Further phenotype assays validated the essential role of CACU motif in circMPP6 interaction with MEX3A and its function in CRC pathogenesis (Supplementary Fig. S10e-i). Therefore, our results imply that circMPP6 facilitates maintaining the PBs aggregation by affecting the collaboration of MEX3A-PBs components. Together these data provide, for the first time, a link between RBP/circRNA complex and PBs.
The MEX3A/circMPP6 complex promotes PDE5A mRNA decayTo profile the downstream targets of MEX3A, mRNA-Seq in control or MEX3A-knockdown DLD-1 cells were applied. Among 491 differentially expressed mRNAs upon MEX3A knockdown (fold change > 2), we cross-referenced MEX3A RIP-Seq data and identified 29 mRNAs bound to MEX3A (Fig. 5a). Next, we selected ten recurrently and significantly dysregulated mRNAs (occurrent in both TCGA patient samples and CRC cell lines) as validation candidates. Through further qRT-PCR examinations followed by Flag-MEX3A-RIP assay (Fig. 5b, c, Supplementary Fig. S11a, b), we identified that PDE5A, SENP7, and TTLL7 mRNAs were regulated and bound by MEX3A. The interaction between circMPP6 and these three mRNAs was verified by RNA Pull-down assay (Fig. 5d, Supplementary Fig. S11c). Moreover, the PBs structure components, MOV10 and UPF1, presented the ability to recruit the mRNAs (Fig. 5e, Supplementary Fig. S12a), consistent with the analysis from published CLIP-Seq datasets in ENCORI (https://rnasysu.com/encori/). Moreover, significantly enhanced PDE5A, SENP7, and TTLL7 mRNA stability was observed in CRC cells following MEX3A/circMPP6 knockdown (Fig. 5f, Supplementary Fig. S12b). These data indicate that the MEX3A/circMPP6 complex mediated PBs aggregation affects mRNAs degradation. Considering MEX3A inhibits the autophagy progression, PDE5A was identified as the potential target of MEX3A according to the reported literature.33,34 Consistent with mRNA stability, PDE5A protein was also increased upon MEX3A/circMPP6 depletion (Supplementary Fig. S12c).
Fig. 5
The MEX3A/circMPP6 complex promotes PDE5A mRNA decay and modulates CRC autophagy through the PDE5A pathway. a Venn diagram showing the overlap of MEX3A-interacting mRNAs identified by Flag-MEX3A RIP-Seq and MEX3A knockdown mRNA-Seq data. b qRT–PCR analysis for the expression of PDE5A in MEX3A-knockdown DLD-1 cells. c qRT–PCR analysis of RIP assay showing the interaction of PDE5A with MEX3A in DLD-1 cells. IgG served as the negative control. d qRT–PCR analysis of RNA Pull-down verifying the interaction of PDE5A with circMPP6 in DLD-1 cells. e qRT–PCR analysis of RIP analysis verifying the interaction of PDE5A with MOV10 or UPF1 in DLD-1 cells. f qRT-PCR analysis for the expression of PDE5A after treatment with Actinomycin D at indicated time points in indicated DLD-1 cells. g qRT–PCR analysis of RIP assay showing the association of PDE5A with UPF1 in indicated DLD-1 cells. h IF-FISH assays showing the colocalization of UPF1/PDE5A and the fluorescence intensity of PDE5A in indicated DLD-1 cells after treatment with puromycin. Nuclei were stained with DAPI (blue). Scale bar, 10 μm. i Western blotting showing the changes of LC3 conversion and p62 expression upon MEX3A knockdown could be rescued by PDE5A silencing. Representative images of the autophagic flux with the mRFP-GFP-LC3 reporter (j), and ultrastructural autophagosomes and/or autolysosomes (k) illustrating that MEX3A knockdown-induced autophagy could be counteracted by PDE5A silencing. Scale bar, 10 μm (i), 500 nm (j). l The subcutaneous xenograft model showing decreased tumor formation upon MEX3A knockdown was rescued by silencing PDE5A in BALB/c nude mice (n = 6). Data are represented as mean ± S.D. from three independent experiments (b–g). The P value was determined by a two-tailed unpaired Student’s t test (b, d, g) or a two-way ANOVA (f)
As UPF1, a part of PBs-related machinery, triggers mRNA decay,35 we speculated that the MEX3A/circMPP6 complex may recruit UPF1 to initiate PDE5A mRNA degradation. To validate this hypothesis, we performed RIP assay and found that the MEX3A/circMPP6 knockdown significantly decreased the PDE5A mRNA-binding ability to UPF1 (Fig. 5g, Supplementary Fig. S13a). Further IF-RNA FISH assays showed that PDE5A mRNA colocalized with UPF1 in the cytoplasm under physiological conditions. Notably, the puromycin treatment diminished the fluorescence intensity of PDE5A mRNA (Supplementary Fig. S13b). In the absence of MEX3A/circMPP6, the colocalization of the UPF1/PDE5A complex decreased and the fluorescence intensity of PDE5A mRNA increased (Fig. 5h, Supplementary Fig. S13c). These findings demonstrate that the accumulation of a MEX3A/circMPP6 complex-dependent interaction between PDE5A and UPF1 enhances PDE5A mRNA degradation.
MEX3A modulates CRC autophagy through the PDE5A pathwayTo determine whether MEX3A regulates CRC malignancy in a PDE5A signaling pathway, we performed rescue assays by transfecting PDE5A shRNA into control and MEX3A-knockdown CRC cells. Inhibiting PDE5A distinctly suppressed the autophagy program of CRC and even reversed the pro-autophagic effect of silencing MEX3A (Fig. 5i-k, Supplementary Fig. S14a–c). Consistently, colony formation and Transwell migration assays demonstrated that PDE5A suppression prominently reversed the proliferation and metastasis-inhibitory effects of MEX3A-silenced CRC cells (Supplementary Fig. S15a, b). The xenotransplant model demonstrated that the decreased tumorigenicity of MEX3A-knockdown cells was largely rescued by PDE5A inhibition in vivo (Fig. 5l, Supplementary Fig. S15c).
We next detected the in vivo expression levels of PDE5A in subcutaneous tumors of nude mice injected with control or MEX3A-knockdown or MEX3A-overexpression CRC cells. We observed a reversed immunostaining pattern of PDE5A in transplanted tumors compared to that of MEX3A (Supplementary Fig. S15d, e). These findings indicate that the oncogenic effects of MEX3A in CRC depend on the PDE5A pathway.
MEX3A/circMPP6-PDE5A axis is correlated with CRC outcomesTo further investigate the clinical significance of MEX3A modulation in CRC patients, we assessed the RNA expression levels of MEX3A, circMPP6, and downstream PDE5A in CRC tissues from TCGA and SYSUCC cohorts. Similar results were obtained that the expression of PDE5A was negatively correlated with the levels of MEX3A transcripts and circMPP6 (Supplementary Fig. S16a). Next, we compared another 8 matched CRCs and adjacent noncancerous tissues and found the protein expression of MEX3A and RNA expression of circMPP6 were frequently upregulated whereas PDE5A was downregulated (Fig. 6a). Moreover, RNA-FISH and double immunofluorescence staining showed a negative relevance between the expression of PDE5A and that of MEX3A/circMPP6 in CRC tissues (Fig. 6b, Supplementary Fig. S16b). IHC staining analysis revealed the reverse immunostaining intensities between PDE5A and MEX3A expression in most CRC tissue specimens (Fig. 6c, Supplementary Fig. S16c). Notably, the Kaplan-Meier survival analysis of patients classified into subgroups with either low or high expression of MEX3A/PDE5A proteins illustrated that CRC patients exhibiting high MEX3A and low PDE5A had the worst OS in our cohorts (Fig. 6d). Collectively, these results support that MEX3A upregulation significantly attenuates the expression of PDE5A, thus exerting a critical role in CRC aggressiveness and patients prognosis.
Fig. 6
MEX3A/circMPP6-PDE5A axis is clinically correlated with CRC outcomes. a Western blotting of MEX3A and PDE5A protein expression and qRT-PCR analysis of circMPP6 RNA expression in 8 pairs of matched CRC tumor (T) and adjacent noncancerous tissues (N). GAPDH was used as the loading control. b Representative RNA-FISH and immunofluorescence staining images of circMPP6 and PDE5A in two CRC tissues with high (the first row) or low MEX3A expression (the second row). Nuclei were stained with DAPI (blue). Scale bar, 100 μm. c Representative IHC images of MEX3A and PDE5A protein staining in CRC tissue microarrays from SYSUCC. Scale bar, 100 μm. d Kaplan-Meier analysis of OS for CRC patients from SYSUCC cohorts (n = 88) indicating that high MEX3A and low PDE5A were associated with a poor prognosis. The P value was determined by a Log-rank test. e A proposed model demonstrating that the MEX3A/circMPP6 complex inhibits CRC cell autophagy by mediating PBs-dependent PDE5A mRNA decay
留言 (0)