
記住我
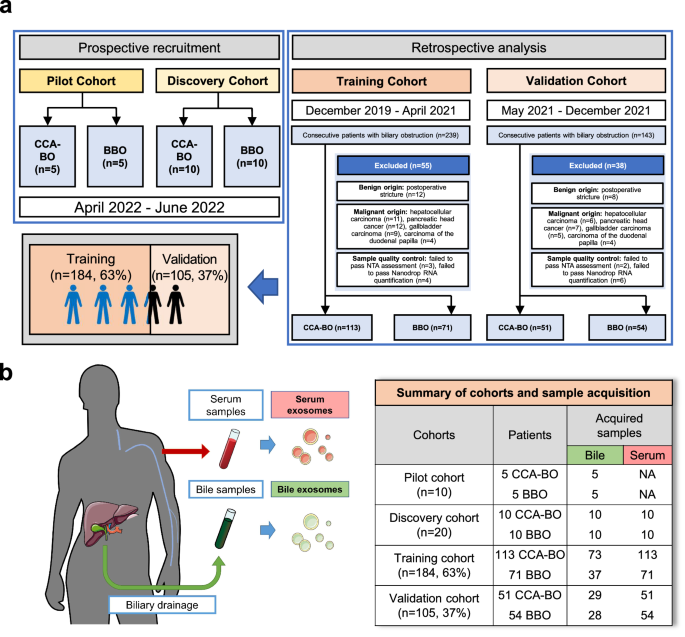


Between November 2019 and August 2022, 18 refractory ITP patients hospitalized in our center were successfully screened and enrolled in the study, including 12 patients in the dose escalation and 6 patients in the dose expansion phase (Fig. 1). The demographics and baseline characteristics of all eligible patients are shown in Table 1 and Supplementary Table S1. The median age of the patients was 44 years old (range: 30–50), and 15/18 patients (83.3%) were female. All of the participants were chronic ITP patients with a median duration of 73 months (range: 15–360). A total of 15/18 patients (83.3%) had 5 or more unique prior therapies (Supplementary Table S2). A total of 10/18 patients (55.6%) and 13/18 patients (72.2%) had previously received splenectomy and rituximab, respectively. Platelet glycoprotein (GP) autoantibodies were detected by a commercial kit (PakAutoassay, Immucor GTI Diagnostics, USA), and 11/18 patients (61.1%) showed positive results, including anti-GP Ib/IX single positive (2/18, 11.1%), anti-GP IIb/IIIa single positive (6/18, 33.3%), and anti-GP IIb/IIIa and GP Ia/IIa double positive (3/18, 16.7%).
Fig. 1
Flow diagram of the study. Twenty-two patients were screened for eligibility, 3 patients were excluded based on the eligibility criteria, and one patient withdrew informed consent. Finally, 18 patients were enrolled in the study. In the dose-escalation phase, 12 patients were enrolled and assigned to the 3-dose group, and 6 patients were subsequently enrolled in the dose-expansion phase
Table 1 Demographic characteristics of eligible patientsSafety and tolerabilityDuring the dose-escalation phase, three patients were sequentially enrolled in each of the three predetermined dose groups and received UC-MSC treatment according to the protocol. Unfortunately, one patient in 2.0 × 10⁶ cells/kg group experienced a grade 3 treatment-related adverse event (acute myocardial infarction) 10 days after the fourth infusion of UC-MSCs, and it was determined by experts from the academic and ethics committee as a dose-limiting toxicity event (DLT) (Supplementary Fig. S1). Therefore, we added three more patients to the 2.0 × 10⁶ cells/kg group, and no DLT was reported in these patients. Based on this, we determined 2.0 × 10⁶ cells/kg as the dosage for the subsequent dose-expansion phase.
All 18 patients enrolled in the study successfully finished the full course (four times) of UC-MSC infusion. Within the 28-week UC-MSC treatment and follow-up period, 13 patients (13/18, 72.2%) had one or more treatment emergent adverse events (TEAEs), most of which were grade 1 or 2, and all of them recovered spontaneously or after short-term intervention. The detailed adverse events (AEs) are presented in Table 2. Briefly, the most common TEAEs were fatigue (5/18, 27.8%), blood bilirubin elevation (4/18, 22.2%) and uric acid elevation (3/18, 16.7%). Three patients reported treatment-related adverse events (TRAEs), including two cases of infusion-related reaction and one case of acute myocardial infarction that occurred ten days after the fourth infusion (with platelet count <30 × 109/L at onset), which was considered possibly related to the infusion of UC-MSCs. Two patients (2/18, 11.1%) in 1.0 × 10⁶ cells/kg group experienced chest tightness that was spontaneously relieved during the first UC-MSC infusion.
Table 2 Treatment emergent adverse events (TEAEs) of UC-MSC infusionSerious adverse events (SAEs) occurred in four patients (4/18, 22.2%), including patient 006 in 1.0 × 10⁶ cells/kg group, patients 007 and 009 in 2.0 × 10⁶ cells/kg group, and patient 014 in the expansion cohort. Patients 006 and 014 experienced grade 3 gastrointestinal hemorrhage, and patient 009 had profuse menstruation during UC-MSC treatment, these were all thought to be associated with thrombocytopenia. Patient 007 experienced the DLT event mentioned above. To date, all patients enrolled and treated with UC-MSCs have not reported any AEs of malignant neoplasms.
EfficacyThe efficacy of UC-MSCs was analyzed separately for the dose-escalation phase and the dose-expansion phase (Supplementary Table S3). Excluding the influence of rescue therapy, the platelet response (R, defined as platelet count ≥30 × 109/L, with at least 2-fold increase from the baseline count and the absence of bleeding) was achieved by 5 patients (41.7%, 5/12) in the dose-escalation phase, and 3 patients (50.0%, 3/6) in the dose-expansion phase. The overall response rate was 44.4% (8/18), with a median cumulative response duration of 6.5 weeks (range 3–27). The median time to the first platelet count ≥50 × 109/L was 21 days (range: 7–42) (Supplementary Fig. S2).
Amone the 5 patients who achieved a response in the dose-escalation phase, 2 belonged to the 1.0 × 10⁶ cells/kg group, and 3 belonged to the 2.0 × 10⁶ cells/kg group. Therefore, the efficacy rate was 0.0% (0/3) for the 0.5 × 10⁶ cells/kg group, 66.7% (2/3) for the 1.0 × 10⁶ cells/kg group, and 50.0% (3/6) for the 2.0 × 10⁶ cells/kg group. The median cumulative response duration among responding patients was 4.5 weeks (range: 3–6) in the 1.0 × 10⁶ cells/kg group and 27 weeks (range: 7–27) in the 2.0 × 10⁶ cells/kg group, respectively. The proportions of patients with platelet counts ≥50 × 109/L at least once were 0.0% (0/3) in the 0.5 × 10⁶ cells/kg group, 66.7% (2/3) in the 1.0 × 10⁶ cells/kg group, and 50.0% (3/6) in the 2.0 × 10⁶ cells/kg group. The proportions of patients with platelet counts ≥100 × 109/L at least once were 0.0% (0/3), 66.7% (2/3), and 33.3% (2/6), respectively.
In the dose-expansion phase, three patients met a response, resulting in an efficacy rate of 50.0% (3/6). All three responding patients achieved platelet counts ≥50 × 109/L at least once, with a median cumulative response duration of 6 weeks (range: 3–8). The proportions of patients with platelet counts ≥100 × 109/L at least once was 50.0% (3/6).
After four weeks of UC-MSC treatment, patients in each group showed an improvement in the bleeding symptoms (Supplementary Table S4). Six patients (6/12, 50.0%) and five patients (5/6, 83.3%) were treated with rescue therapy in the dose-escalation phase and dose-expansion phase, respectively (Supplementary Table S5). Nine patients (9/18, 50.0%) had concomitant medications in the study (Supplementary Table S6). Each patient’s concomitant medications, response and rescue therapy are shown as a bar chart in Fig. 2a. The mean platelet counts with standard errors from baseline to week 28 in all patients are shown in Fig. 2b.
Fig. 2
Treatment response, outcomes and platelet counts over time in all patients. a The best responses, concomitant medications, and rescue therapy of all 18 patients with different infusion doses (0.5 × 10⁶ cells/kg, 1.0 × 10⁶ cells/kg, and 2.0 × 10⁶ cells/kg) are shown in the swimmer plot. GC glucocorticoids, TPO-RA thrombopoietin receptor agonist, R response. b The mean platelet counts of all enrolled patients from baseline to 24 weeks after the completion of UC-MSC administration. Data are the mean ± s.e.m., and different colors represent different infusion doses of UC-MSCs
Patient 008 relapsed 30 weeks after the first UC-MSC infusion, and patient 010 did not experience recurrence after one year of follow-up with eltrombopag 25 mg/day (the maintenance dose for three months before enrollment was 75 mg/day). Patient 007 relapsed 13 weeks after the first UC-MSC infusion, but the patient was no longer bleeding, and the platelet count was consistently >30 × 109/L for 16 months of follow-up thereafter.
Compassionate use of UC-MSCsIn total, we infused 19 courses of UC-MSCs in this study. Patient 008 received another course of UC-MSC (2.0 × 10⁶ cells/kg) treatment after relapse and reached treatment response again. However, the maximum platelet count after redosing was lower than that in the first course (61 × 109/L vs. 89 × 109/L), and the cumulative response time was also decreased (8 weeks vs. 30 weeks). TRAEs did not occur during the next 28 weeks.
Pharmacokinetics of UC-MSCsA total of eight patients underwent pharmacokinetics assays with informed consent (Supplementary Table S7). The SRY gene started to be detectable in the peripheral blood of all patients at 30 min and could last for 4 h in most patients. There was no detectable human-specific sequence in the blood 8 h after injection (except patient 005). Collectively, the longest peripheral blood residence time for MSCs administered via intravenous infusion in this study was 8 h.
Humoral immunogenicityAnti-drug antibodies (ADA) were analyzed pre-cell (−1 h ~ 0 h) and after-cell (48 h after the 4th MSC infusion) infusion in 12 patients (Supplementary Table S8). No ADA was detected at any time point, which demonstrated that there was no occurrence of ADA in patients after UC-MSC infusion.
Immunological changes in the peripheral blood after UC-MSC treatmentDifferences in the peripheral immune environment of ITP patients before and after infusion were assessed through flow cytometry analysis (Fig. 3 and Supplementary Figs. S3–S8). Due to the impact of COVID-19, some follow-up data of the enrolled patients were missing. Consequently, for the evaluation of peripheral immune alterations, we consolidated observations at 16 weeks and 24 weeks, presenting them as ≥16 weeks.
Fig. 3
The peripheral immune monitoring plan of enrolled patients and the dynamic changes in peripheral blood immune cells after receiving UC-MSC infusion. a Blood samples were collected from all enrolled patients for platelet count and peripheral blood immune subpopulation monitoring at baseline and 2, 4, 8, 12, 16 and 24 weeks after the first infusion (peripheral blood samples at the baseline and 2 week observation points were collected within 2 h before the UC-MSC infusion). b, c Changes in the proportion of CD8+ T cells in peripheral lymphocytes after UC-MSC infusion (n = 8 in the response group, n = 8 in the no response group). d, e Changes in the proportion of suppressor T cells (Tregs, CD8+CD28− T cells) after UC-MSC infusion (n = 8 in the response group, n = 10 in the no response group). f, g Dynamic changes in the counts and percentages of CD19+ B cells in peripheral blood after UC-MSC infusion (n = 8 in the response group, n = 9 in the no response group). Due to the impact of COVID-19, some follow-up data of enrolled patients were missing. Consequently, for the evaluation of peripheral immune alterations, we consolidated observations at 16 weeks and 24 weeks, presenting them as ≥16 weeks. Data are the mean ± s.e.m., and different colors represent different infusion doses of UC-MSCs in the scatterplots: purple = 0.5 × 10⁶ cells/kg, green = 1.0 × 10⁶ cells/kg, red = 2.0 × 10⁶ cells/kg. Statistical analysis was conducted using independent samples t-tests or Wilcoxon signed-rank test, with a significance level set at p < 0.05. W weeks, R response, NR no response
Comparing baseline immune profiles between responsive and non-responsive patients, we found that responders displayed slightly higher percentages and absolute counts of T lymphocytes, whereas B cell metrics displayed the opposite trend. However, these variances lacked statistical significance (Supplementary Fig. S3). The infusion period of UC-MSCs was characterized by a transient reduction in both the proportion and absolute count of peripheral T lymphocytes. In the subsequent follow-up period, these metrics exhibited a gradual upward trend, especially in the proportion of CD8+ T cells, with this increase being slightly more evident in the response group compared to the no response group, though not reaching statistical significance (Fig. 3b, c and Supplementary Fig. S4a–g). Notably, a significant gradual increase in the proportion of CD8+CD28− T cells was observed in the response group. Conversely, the proportion of T regulatory cells (Tregs, CD4+CD25+CD127dim/−) significantly rose in the no response group. The absolute counts of CD8+CD28− T cells and Tregs demonstrated a similar pattern throughout the study period in both groups (Fig. 3d, e and Supplementary Figs. S5 and S6). Additionally, marginal decreases in the percentages of naïve (CD45RA+CCR7+ T cells) and central memory (CD45RA−CCR7+ T cells) T lymphocytes were observed in responsive patients (Supplementary Fig. S7). B cell monitoring revealed similar outcomes to T cells, though baseline B cell proportions were higher in non-responsive patients than in responsive patients (Fig. 3f, g and Supplementary Fig. S4h), with no significant difference in the suppressor B-cell subset (CD19+CD38hiCD24hi) between two groups (Supplementary Fig. S8).
Quantitative analysis of plasma cytokine concentrations before and after UC-MSC infusion (0, 2, 4 weeks) in patients revealed that there were no statistically significant differences in baseline cytokine levels between the response and no response groups. However, patients in the no response group showed a significant increase in plasma levels of various inflammatory cytokines, including IL-1β, IL-2, IL-6, and IL-17, after receiving UC-MSC infusion, whereas such changes were not observed in the response group (Fig. 4).
Fig. 4
Quantitative analysis of plasma cytokine concentrations before and after UC-MSC infusion. The concentrations of 12 kinds of cytokines were measured before (0), during UC-MSC infusion (2 weeks), and after UC-MSC infusion (4 weeks) in the response and no response group, respectively (n = 8 in the response group, n = 10 in the no response group). The levels of plasma IL-1β, IL-2, IL-4, IL-5, IL-6, IL-8, IL-10, IL-17A, IFN-α, and TNF-α had significantly increased after the infusion of UC-MSC (all p < 0.05). No significant changes were observed in the response group before and after the UC-MSC infusion. Data are the mean ± s.e.m., circle represents response group, square represents no response group. And different colors represent different infusion doses of UC-MSCs in the scatterplots: purple = 0.5 × 10⁶ cells/kg, green = 1.0 × 10⁶ cells/kg, red = 2.0 × 10⁶ cells/kg. Statistical analysis was conducted using paired t-test or Wilcoxon signed-rank test, with a significance level set at p < 0.05. W weeks, R response, NR no response
留言 (0)