Study population
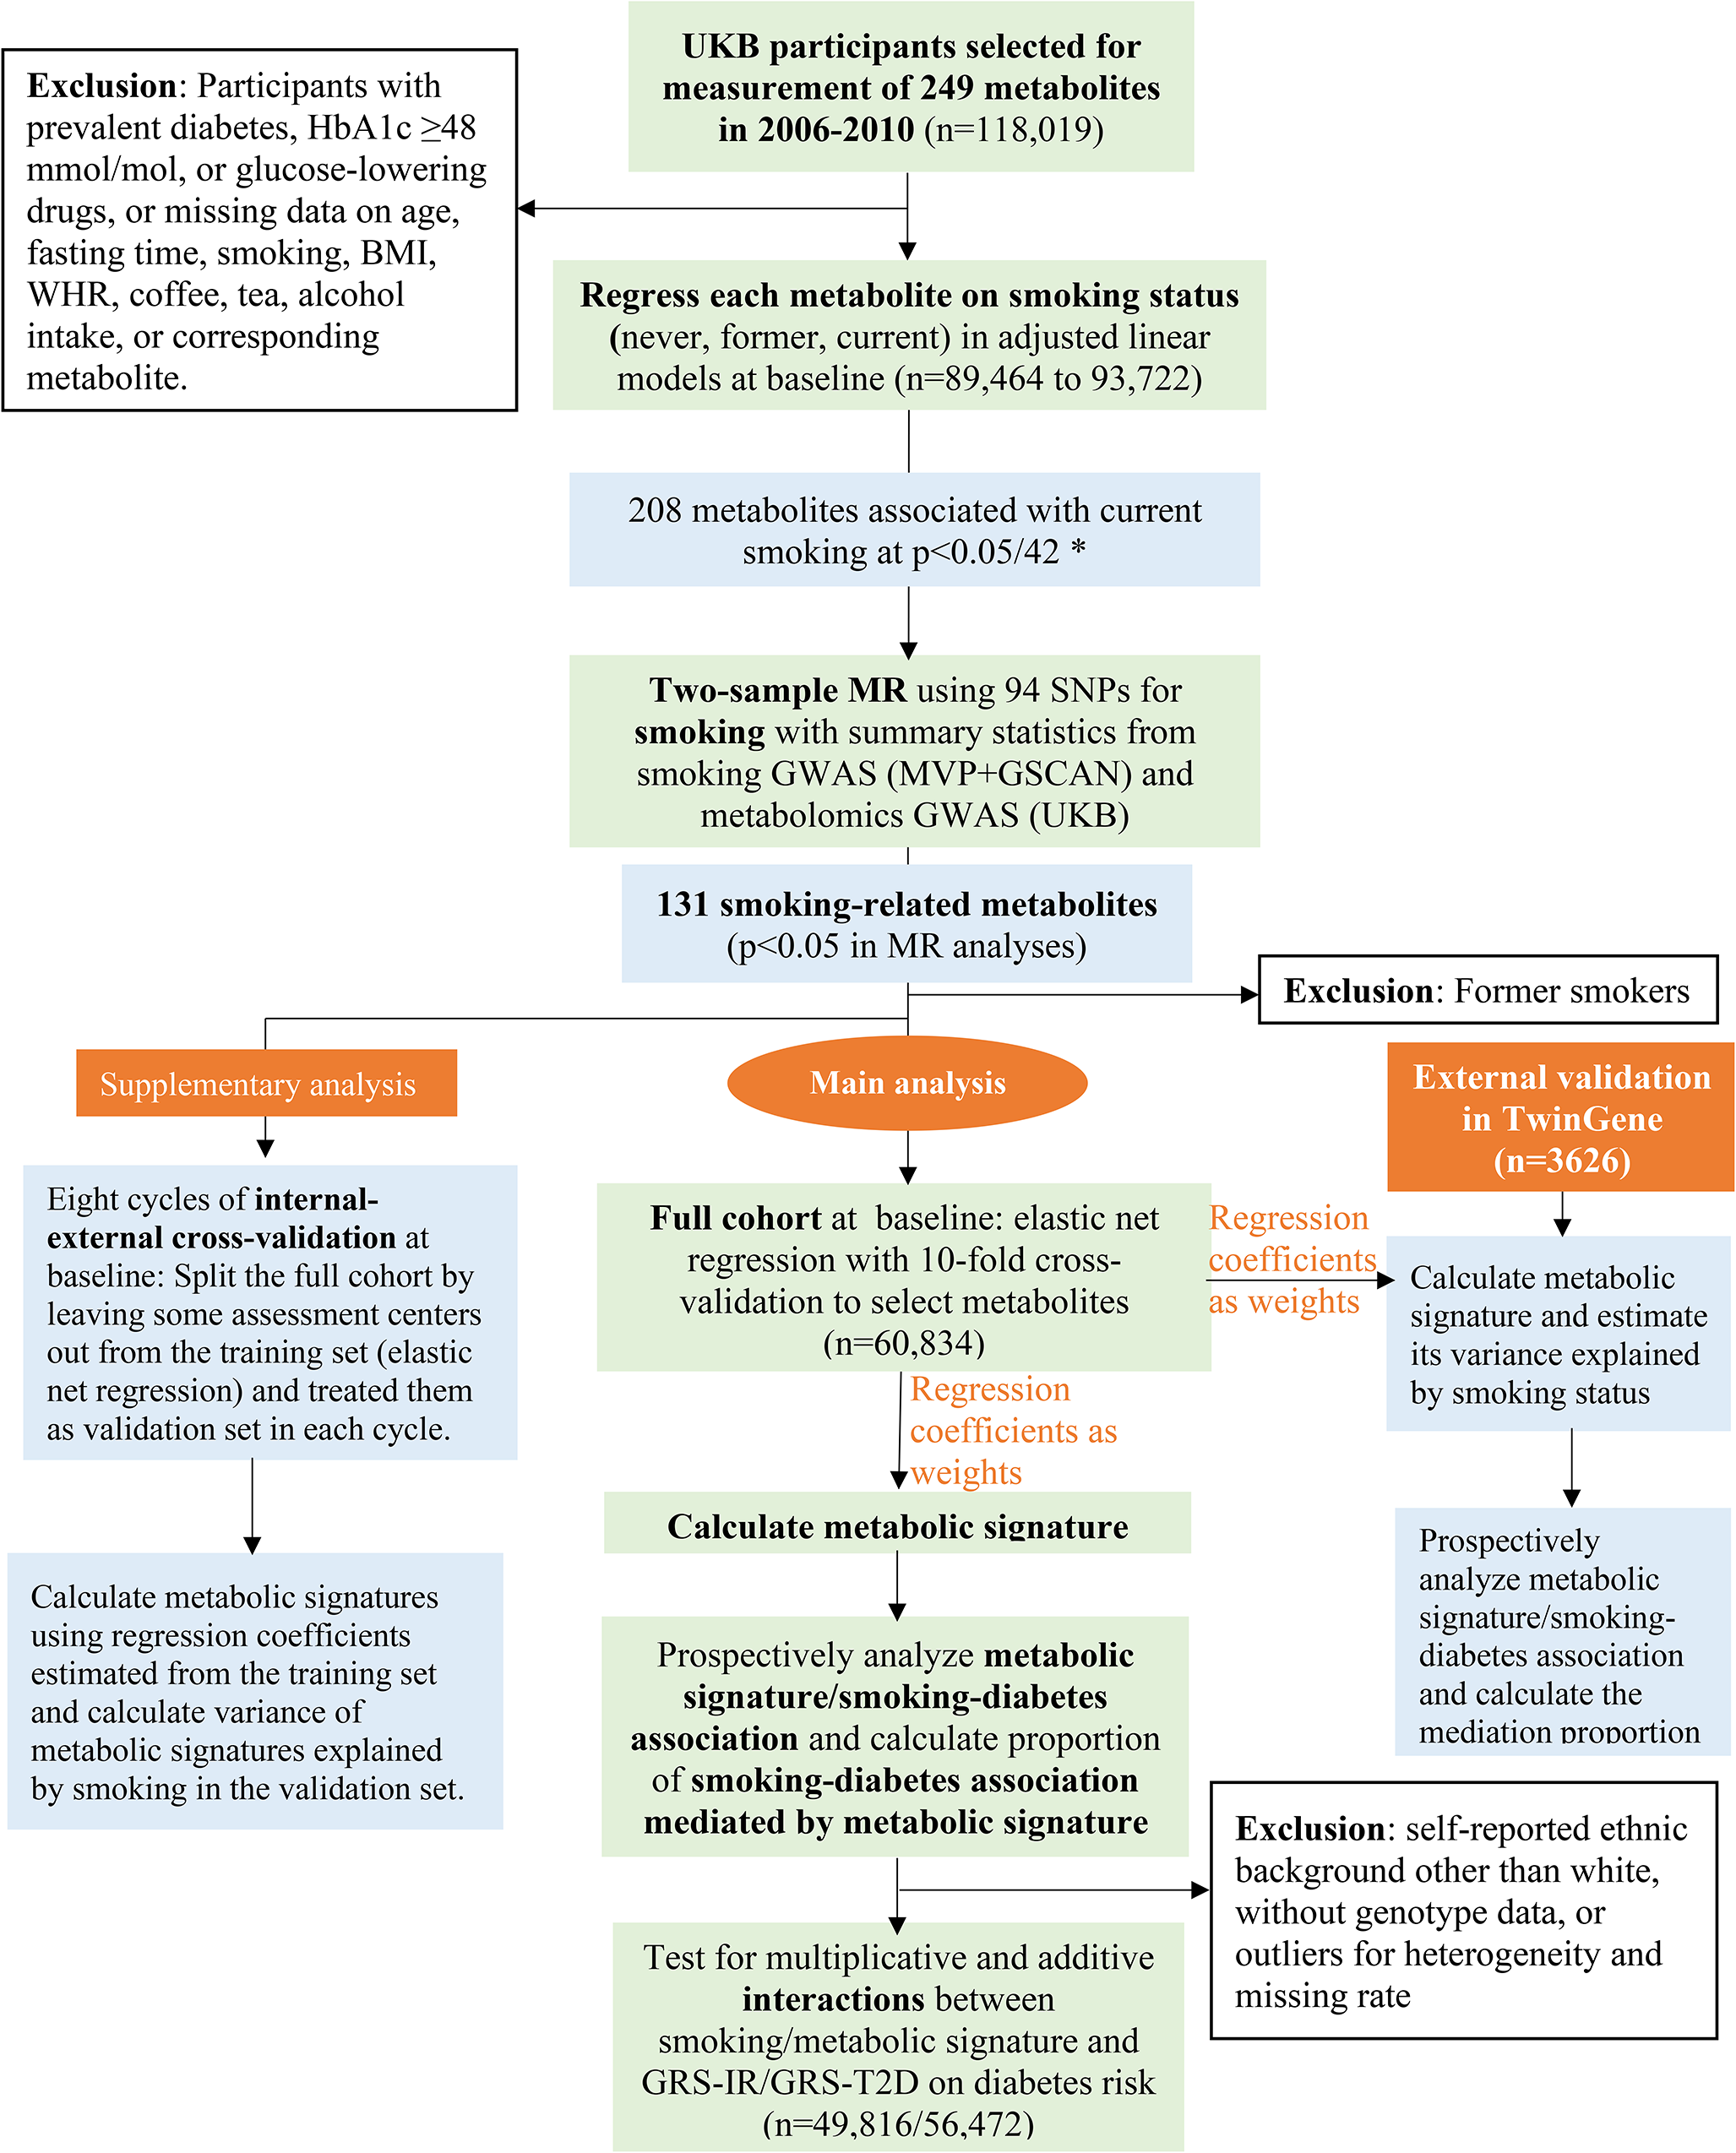
The UKB study enrolled half a million participants aged 37–73 years from 22 assessment centers in the UK in 2006–2010 [21]. Eligible for the present study were the 118,019 participants who had metabolomics data collected at baseline. We excluded participants with diagnosed or undiagnosed (HbA1c ≥ 6·5% [48 mmol/mol] or taking glucose-lowering drugs) diabetes, taking lipid-lowering drugs, or with missing data on age, fasting time, smoking status, body mass index (BMI), waist-to-hip ratio (WHR), alcohol intake, coffee consumption, tea consumption, or corresponding metabolite for the analysis of smoking-metabolite associations (Fig. 1). The subsequent sample sizes ranged from 89,464 to 93,722 in the analyses of the available metabolites or derived measures (ratios or percentages, also called “metabolite” in the following sections for convenience) at baseline. Among them, 5,138 participants had metabolomics data collected again at a repeat assessment in 2012–2013 and the sample sizes for each metabolite ranged from 3,632 to 3,797. The UKB study was approved by the North West Multi-center Research Ethics Committee [22]. Our study was performed under the UK Biobank Project 84,778, with ethical approval from the Swedish ethical review board (2022-02293-01). All participants provided informed consent to participate.
Smoking and other lifestyle factors at baseline and repeat assessment
Participants were asked about current and past smoking status, and classified as never, former, or current smokers. BMI was calculated from measured standing height and body weight, while WHR was calculated by dividing waist circumference by hip circumference. Consumption of different food items such as alcohol intake during the past 12 months was obtained from a short, touchscreen food frequency questionnaire (FFQ). Information on physical activity was also obtained through questionnaires.
Metabolomic profiling and genetic data
The metabolomic data was analysed in 2019–2020, from non-fasting EDTA plasma samples collected at baseline or the repeat assessment, using a high-throughput nuclear magnetic resonance(NMR)-based platform developed by Nightingale Health Ltd [23]. The NMR platform measured 249 metabolites, including glycoprotein acetyls, lipids in 14 subclasses, fatty acids, amino acids, ketone bodies, and glycolysis metabolites [23]. We constructed genetic risk scores for insulin resistance (GRS-IR) and type 2 diabetes (GRS-T2D) based on 5 [24] and 38 [25] independent SNPs genotyped in UKB participants, respectively. Such SNPs have been used by previous studies to create genetic risk scores [24, 25], calculated as the weighted (by effect sizes) sum of the number of risk alleles (0, 1, 2) [25] (eTable 1). Participants were then categorized into low (quintile 1), intermediate (quintile 2–4), and high (quintile 5) genetic risk groups [25, 26].
Type 2 diabetes
Incident cases of diabetes was identified during follow-up until 2022. Type 2 diabetes was defined as a corresponding diagnostic code (UKB data field 130,709) identified from hospital admissions, primary care, or death register, or a diabetes diagnosis collected through verbal interview at repeat assessments. The date of diagnosis is defined as the earliest date of diabetes diagnosis recorded through either self-report at repeat assessment, inpatient hospital data, primary care, or death register.
Statistical analysisSmoking-related metabolites identified by cross-sectional and MR analyses
Metabolites deviating from normal distribution were log-transformed, and all metabolites were rescaled (divided by standard deviation [SD]). Each of the 249 metabolites measured at baseline was treated as the response variable with smoking status (current, former, or never) as the exposure in a linear model, with adjustment for age, sex, assessment center, education, ethnicity, Townsend deprivation index, fasting hours, BMI, WHR, physical activity, and consumption of different food items such as alcohol and coffee. From these models, we also obtained the variance (R2) explained by smoking status and covariates for each metabolite. We repeated the linear regression for each of the 249 metabolites using repeat assessment data.
The 249 metabolites are correlated with each other. We performed a principal component analysis and 42 principal components explained > 99% of variance in these metabolites. We therefore corrected for multiple tests by setting p < 0·05/42 (accounting for the 42 independent components which explained the most variance in the metabolites) as the statistical significance threshold to identify metabolites associated with current smoking at baseline [27, 28]. We then performed two-sample MR analyses for the metabolites identified at baseline (Fig. 1). The MR analyses were based on 94 independent SNPs as instrumental variables (IV) for smoking initiation in Europeans [29], and summary statistics for the SNP-metabolite associations from a recent genome-wide association study (GWAS) of metabolomics in UKB [30] (eMethod 1; eTable 2). A metabolite was considered potentially causally affected by smoking (referred as “smoking-related metabolite” below) if its association with smoking was in the same direction in the baseline (p < 0·05/42) and MR (p < 0·05) analyses.
Metabolic signature of smoking
We derived a smoking-related metabolic signature based on the identified smoking-related metabolites. First, metabolites deviating from normal distribution were log-transformed. Second, we regressed each metabolite on variables (except smoking) which explained parts of its variance and obtained standardized residuals from those regressions [14, 31]. Third, an elastic net regression model was fitted with the standardized residuals as predictors and smoking status (current versus never) as the response variable at baseline, and the alpha and lambda parameters in the regression were chosen using a 10-fold cross-validation approach based on the minimum mean squared error [32]. The elastic net regression combines the Lasso and Ridge penalties and shows robust prediction performance in the existence of multicollinearity [33]. We calculated the smoking-related metabolic signature at baseline as the weighted sum of the metabolites selected by the elastic net regression using the corresponding regression coefficients as weights [32] (Fig. 1). We also calculated metabolic signature at repeat assessment using regression coefficients obtained from baseline. The variance of the metabolic signature explained by smoking status was estimated by regressing the signature on smoking status and covariates at baseline (Fig. 1) and repeat assessment (for internal replication), respectively.
To assess the validity of the metabolic signature, we performed an external validation in TwinGene (n = 3626), a cohort nested in the Swedish Twin Register [34], by calculating the signature with regression coefficients obtained from UKB analysis as the weights (Fig. 1, eMethod 2). We also applied eight cycles of internal-external cross-validation [35, 36] by splitting the full UKB cohort into two parts by assessment centers in each cycle, one part for training the model and the remaining part for external validation (Fig. 1, eMethod 3).
Prospective analyses of smoking/metabolic signature and incidence of type 2 diabetes
We calculated the duration of follow-up from baseline (2006–2010) to the occurrence of diabetes, death, loss to follow-up, or March 1st, 2022, whichever came first. We fitted Cox proportional hazards regression models to estimate the hazard ratios (HRs) and 95% confidence intervals (CIs) for type 2 diabetes in relation to smoking status (current vs. never), each individual smoking-related metabolite (per SD increase), and the smoking-related metabolic signature (per SD increase, or above versus below the median). The models were fitted with attained age as the time scale and adjusted for age groups, sex, assessment center, education, ethnicity, Townsend deprivation index, BMI, physical activity, consumption of different food items, and family history of diabetes (main model). A Cox marginal structural model [37] was fitted to estimate the natural direct and indirect effect of smoking and the proportion of smoking-diabetes association mediated through the metabolic signature (eFigure 1). We also did the above-mentioned analyses in men and women separately. We repeated such analyses in TwinGene (eMethod 2).
Interaction between smoking/metabolic signature and genetic susceptibility
We hypothesized that the coexistence of genetic susceptibility and high levels of metabolic signature (or smoking) enhance their overall impact on type 2 diabetes (eFigure 1). We wanted to assess additive interaction since it is more of public health relevance than multiplicative interaction [38]. Additive interaction implies that the absolute risk reduction [38] by intervening on the metabolic signature (or smoking) is larger in those with high genetic susceptibility than that in those with low genetic susceptibility. The existence of both additive and multiplicative interactions is the strongest form of interaction [38]. We therefore also assessed multiplicative interaction. We calculated the HR of diabetes in relation to combinations of metabolic signature levels (or smoking status) and GRS status (low, intermediate, or high) and estimated potential additive interaction as the relative excess risk due to interaction (RERI) [39]. We also did the analyses of smoking/metabolic signature and diabetes in different GRS-IR and GRS-T2D subgroups. Potential multiplicative interaction between the metabolic signature (or smoking) and GRS was tested by comparing models with and without the interaction term, using the Likelihood ratio test. We used the same covariates as in the main model, except that we did not adjust for ethnicity or family history of diabetes and included adjustment for genotyping batch and the first 10 genetic principal components. In a sensitivity analysis we excluded participants with at least one relative in UKB.
The elastic net regression and MR analyses were performed in R 4.0.4 and other analyses were performed using STATA 17.0. Significance threshold were set at p < 0·05, unless stated otherwise.


留言 (0)