This study followed the recommended framework for the external validation of a prediction model [12] and conformed to the Transparent Reporting of a multivariable prediction model for Individual Prognosis or Diagnosis (TRIPOD) statement [13].
Data source and participants
The external validation was based on a retrospective observational cohort study conducted at Fujita Health University Hospital, a tertiary-care academic hospital in Japan [14]. We retrospectively identified acutely ill medical inpatients admitted to our general internal medicine department between July 5, 2016 and July 5, 2021, and extracted data from their electronic medical records. The eligibility criteria were patients aged ≥ 15 years and hospitalized for ≥ 3 days, and the exclusion criteria were patients with trauma, those who underwent surgery, pregnant women, those on anticoagulation therapy for any reason at admission, and those hospitalized for VTE or bleeding.
Predictors
One of the investigators (DA), who was blinded to the outcomes, extracted the baseline patient characteristics used in the IMPROVE bleeding RAM [3], including the registered diagnosis procedure combination codes (i.e., equivalent to hospital admission codes) and individually described clinical information at admission, from the identified patients’ medical records. The baseline data included the presence of active gastric or duodenal ulcer, bleeding history < 3 months prior to admission, thrombocyte count, age, international normalized ratio (INR), glomerular filtration rate (GFR) (calculated using the formula 194 × [serum creatinine]−1.094 × age− 0.287 for men and 194 × [serum creatinine]−1.094 × age− 0.287 × 0.739 for women), intensive care unit (ICU) or coronary care unit (CCU) admission, use of central venous catheters (CVCs), presence of rheumatic diseases, presence of active malignancy, and sex.
Interventions for venous thromboembolism prophylaxis
The aforementioned investigator (DA) also extracted data on pharmacological and nonpharmacological prophylactic interventions for VTE during hospitalization, if any, from the patient’s medical records. Pharmacologic prophylaxis was exclusively based on unfractionated heparin, typically 10,000 units per day. We further determined whether a foot pump, either by itself or in combination with heparin, was used for nonpharmacological prophylaxis.
Risk groups
We used the simplified, score-based version of the IMPROVE bleeding RAM [3], following existing validation studies [7, 8, 10]. The point system used in the RAM, operational definitions of the presence or absence of specific items, and categorization of continuous predictors are provided in Table 1. We initially classified the patients into 11 groups according to their risk of bleeding based on the total RAM scores following the derivation study [3]. Patients were then categorized into two risk groups: low- (those with scores < 7) and high-risk (those with scores ≥ 7) groups.
Table 1 International medical prevention registry on venous thromboembolism bleeding risk assessment modelaOutcomes
The outcome of interest was the cumulative incidence of bleeding 14 days after admission. Given that anonymization during data extraction was impossible, an investigator (DA) independently extracted bleeding event data from data on other patient characteristics, extracted on a different occasion, before formally assigning the RAM scores and risk groups. The extracted sources included electronic medical records, including radiology and endoscopy reports, blood transfusion prescription records, laboratory result databases, diagnosis codes assigned after hospitalization, and death certificates. The same investigator determined whether a bleeding event was either major or nonmajor but clinically relevant in all patients. A major bleeding event was defined as bleeding that contributed to death, clinically overt bleeding associated with a 2-g/dL decrease in hemoglobin level or leading to transfusion of more than two units of packed red blood cells, or bleeding within a critical organ, including intracranial, retroperitoneal, intraocular, adrenal gland, spinal, or pericardial bleeding [3]. A nonmajor but clinically relevant bleeding event was defined as overt gastrointestinal bleeding excluding insignificant hemorrhoidal bleeding, gross/macroscopic hematuria lasting > 24 h, substantial epistaxis that required intervention and was recurrent and/or lasted for ≥ 5 min, extensive hematoma or bruising measuring 5 cm in diameter, intra-articular bleeding documented by aspiration, menorrhagia or metrorrhagia with documented increase in quantity or duration, or other bleeding important enough to be recorded into the medical chart [3].
Sample size
Only 58 bleeding events had been observed in our cohort, which was much lower than the recommended sample size of 100 events [15].
Missing data
Missing data on thrombocyte count, GFR (with the shifted-log-transformation), and INR (with the Box–Cox transformation) were imputed using multivariate imputation through chained equations [16]. Overall estimates and their 95% confidence intervals (CIs) were calculated, based on 20 imputed datasets [16], using Rubin’s rules [17].
Statistical analysis
Continuous variables were presented as medians and interquartile ranges (IQRs), whereas categorical variables were presented as numbers and percentages. The cumulative bleeding incidence was estimated 14 days after admission using the Kaplan–Meier method.
For the two-risk-group model, the sensitivity, specificity, and positive and negative predictive values (PPV and NPV, respectively) and their exact 95% CIs were estimated using standard methods.
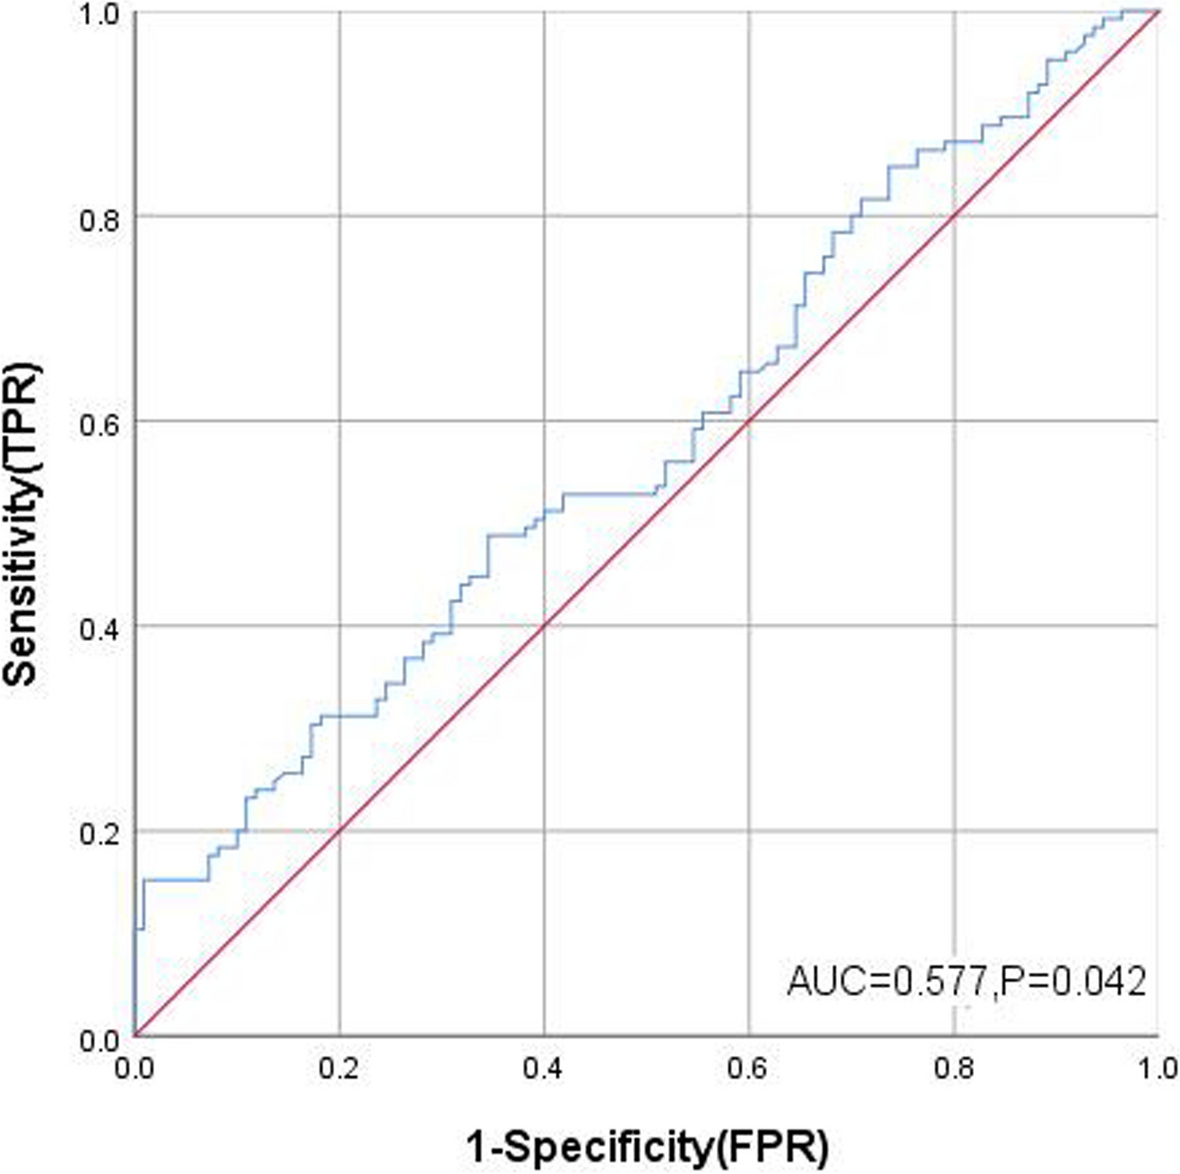
For the 11-risk-group model, each group was plotted using the standard empirical and fully parametric binormal receiver operating characteristic (ROC) curves obtained based on the probit model with maximum likelihood estimation [18, 19]. The area under the parametric ROC curve was then estimated as the summary discriminatory accuracy (C statistic). The parametric approach has an advantage over the empirical approach in generating parameters to obtain AUC (for a smooth ROC) and CIs that are almost similar to those obtained with nonparametric approaches [20], which can be directly applied for calculating the overall estimates in the presence of missing data. To examine the overall calibration, we estimated (1) the expected and observed event ratio (E/O), (2) calibration-in-the-large (CITL) obtained as the intercept by refitting the logistic regression on the RAM score as the standalone offset term covariate, and (iii) calibration slope as the coefficient for the RAM score [11]. To visualize the calibration for each risk group stratified according to RAM score, we constructed standard calibration plots based on the observed versus expected (i.e., originally reported cumulative bleeding incidence) estimates using a nonparametric locally estimated scatterplot smoothing curve [11].
Recalibrating the baseline risk is an integral additional step for external validation when the calibration performance is suboptimal [12, 21, 22]. This approach is widely accepted as a better alternative to redeveloping a new model de novo [23], requiring a large sample size [24]. To update the original 11-risk-group IMPROVE bleeding RAM, we recalibrated the intercept by fitting the original RAM using logistic regression and then constructing the standard calibration plots [12, 25].
All statistical analyses were performed using Stata SE version 18.0 (Stata Corp, College Station, TX, United States) or R version 4.1.2 (R Foundation for Statistical Computing, Vienna, Austria.). Cluster-robust standard errors were obtained using a clustered sandwich estimator to address multiple inclusions of the same patients. To obtain the overall estimates, the calibration slopes and CITLs were combined in the original scale; O/Es and odds ratios (ORs), and proportions and C statistics were transformed into log and logit scales, respectively [11]. All analyses used two-tailed P-values, with the level of significance set at P < 0.05.


留言 (0)