
記住我


The study was conducted in the renal dialysis unit of a tertiary-level hospital in London, United Kingdom between May and October 2022. Adult patients with end-stage renal failure, on maintenance haemodialysis, who presented above their target dry weight and had a target fluid removal of 2 L, or more, were included. Exclusion criteria were patients with previous echocardiographic evidence of right heart dysfunction, previous liver resection or liver transplantation, known liver cirrhosis and pregnancy. The trial was conducted according to principles set out by the Helsinki Declaration and ethical approval was provided by South Central-Berkshire Research and Ethics Committee (IRAS305720); written informed consent was obtained from each patient.
Ultrasound assessmentAll ultrasound examinations were performed using an Affiniti Ultrasound System (Philips, UK). All examinations were performed by clinicians accredited to a minimum of UK focused critical care competencies who had been additionally trained in VEXUS through lectures and videos. They were not part of the treating team. The examinations were performed before the start of fluid removal, during, and at the end of their dialysis session.
Cardiac ultrasound examinations were performed using a standard phased-array probe (2–5 MHz) to obtain the standard parasternal long-axis, short-axis, apical and subcostal windows. The left ventricular outflow tract velocity time integral (LVOT VTi) was obtained by placing the pulse-wave Doppler gate at the left ventricular outflow tract in the apical 5-chamber view. We defined LV systolic impairment as LVOT VTi < 16 cm. The RV systolic function was defined according to the tricuspid annular plane systolic excursion (TAPSE) assessed using M-mode recordings through the lateral tricuspid valve annulus. In addition, tissue doppler analysis was performed to measure myocardial velocity change using standard pulse-wave Doppler at the junction of the RV free wall and tricuspid annulus in the apical 4-chamber view.
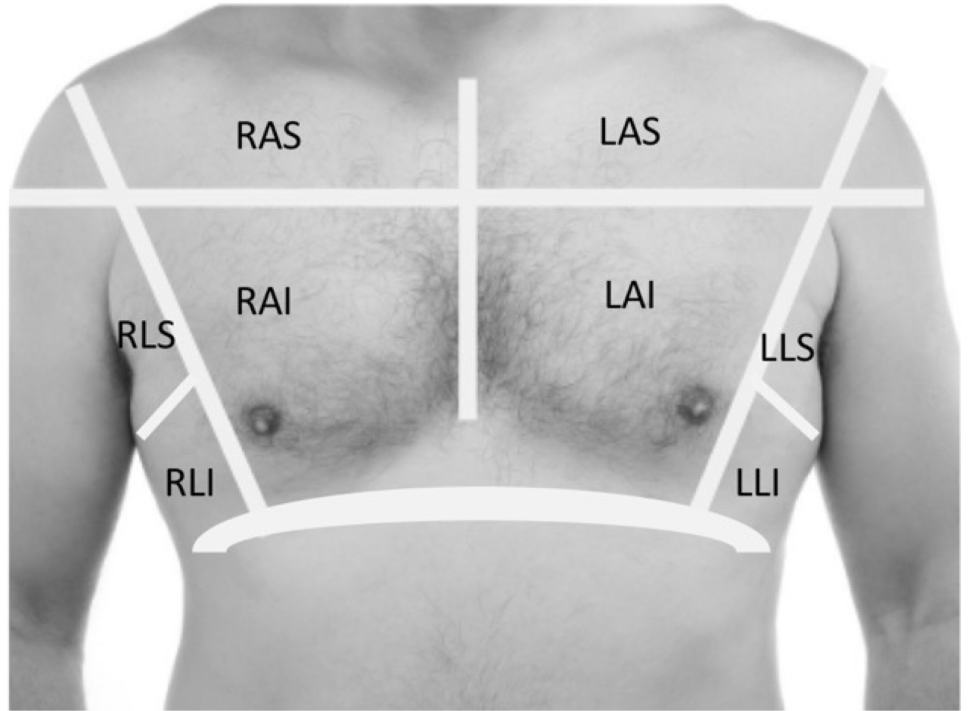
Lung ultrasound examinations were performed using a curvilinear probe (1-5Mhz) using a previously described protocol [14]. The probe was placed in the longitudinal plane across the rib space in 8 segments. The lung ultrasound score was obtained, with each segment scored between 0 and 3 based on the primarily the number of B-lines. We defined a ‘Wet’ profile if there were bilateral segments of lungs which scored 2 or more.
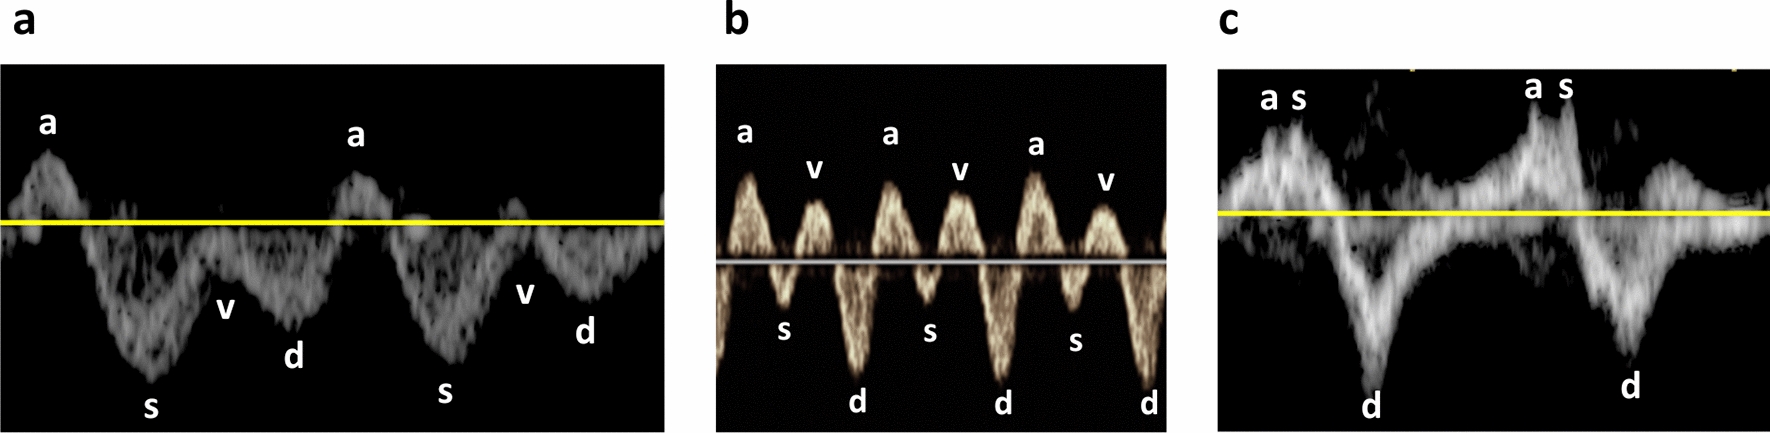
Assessment of venous congestion was performed using Doppler-based techniques as previously described by Denault et al. [15] (Fig. 1). Briefly, with the patient in the supine position, the diameter of the inferior vena cava was measured in the subcostal view at 1 cm from its junction with the right atrium. The maximum and minimum diameters of the inferior vena cava were measured, and the percentage of change in diameter was calculated. The hepatic venous (HV) flow was recorded from the subcostal window. HV patterns were classified and recorded as: continuous, systolic greater than diastolic (S > D, normal), systolic less than diastolic (S < D, abnormal) or systolic reversal (severely abnormal).
Fig. 1
Grading of HV, PV and intrarenal vein Doppler patterns. VEXUS Ultrasound Score: Grade 0: IVC < 2 cm = NO Congestion; Grade 1: IVC > 2 cm with any combo of Normal or Mildly Abnormal Patterns; Grade 2: IVC > 2 cm and ONE severely Abnormal Pattern; Grade 3: IVC > 2 cm and > 2 Severely Abnormal Patterns
Portal vein pulsatility was assessed by pulsed-wave Doppler evaluation of the portal vein (PV) in the liver either in the subcostal or lateral position. PV patterns include continuous (normal), or pulsatile. Furthermore, where possible, the pulsatility index (PI) was calculated: ([PVmax – Pvmin]/PVmax × 100%).
The measurements were categorised based on the Doppler appearance and used to calculate the VEXUS grade (0–3).
A modification of the VEXUS grade in our study was the omission of the intrarenal flow profile. We had intended to include this parameter but after recruiting several patients it became apparent that renal vein flow was mostly unrecordable. The rationale for this is the presumed alterations of renal perfusion in the context of ESRF and hence its unknown impact on the validity/feasibility of the technique [15,16,17].
Images and videos were de-identified with respect to patient, and time point and were analysed offline in a blinded fashion by clinicians who did not perform the scans.
Additional data collectionBasic demographic data were collected from the patients’ records. The target dry weight had been previously decided by the patient’s treating nephrologist. Before the dialysis session, patients are weighed, and fluid removal target decided, so as to achieve their target dry weight. Basic parameters such as blood pressure and heart rate were recorded.
Statistical analysisStatistical analysis was conducted using Prism v 10.1 (GraphPad Software, San Diego, CA).
Data on dynamic change in VEXUS parameters is not available, precluding a formal power calculation. We therefore pragmatically aimed to recruit 30 patients. Continuous variables are expressed as the mean ± standard deviation or the median and interquartile range, depending on distribution of the data. Categorical variables are presented as frequencies and proportions. Differences between groups at baseline were analyzed using the t-test or Wilcoxon-Mann‒Whitney U test according to normality criteria. Fisher’s exact test was applied to categorical variables.
留言 (0)