The Generation Scotland cohort
The Generation Scotland: Scottish Family Health Study (GS) has been previously described in detail by Smith et al. [13]. In brief, GS is a cohort study of > 20,000 individuals and their families living in Scotland. GS provides a resource with genome-wide genetic, epigenetic, clinical, lifestyle and sociodemographic data. Participants in GS were aged between 17 and 99 years at the study baseline, with a mean age of 47.5 years (SD: 14.93). 58.8% of the GS cohort is female. Recruitment took place between 2006 and 2011.
Lothian Birth Cohorts of 1921 and 1936
The Lothian Birth Cohorts of 1921 and 1936 (LBC1921 and LBC1936) comprise older community-dwelling adults born in 1921 and 1936 [14, 15]. Most of these individuals sat a test of general intelligence—the Moray House Test No.12—at about age 11 years while at school in Scotland in 1932 and 1947, respectively. Subsequently, individuals residing in the Lothian area later in life were invited to join the LBC studies (at age ~ 79 for LBC1921 and age ~ 70 for LBC1936). Participants underwent a series of physical, cognitive and medical assessments at regular intervals (age ~ 79, 83, 87, 90, 92 for LBC1921, and age ~ 70, 73, 76, 79, and 82 for LBC1936). The participants provided blood samples from which genetic, epigenetic and biomarker data were obtained. Beginning at the second assessment (age 73), LBC1936 participants also underwent whole brain structural MRI scans. The mean age at wave 1 in the LBC1936 is 69.5 years (SD: 0.83) and 49.77% of the cohort is female. The mean age at wave 1 in the LBC1921 is 79.1 (SD: 0.58) and 58.17% of the cohort is female.
EpiScores in the Generation Scotland and the Lothian Birth Cohorts
The training and testing of the 84 EpiScores used in this study have been described previously [12]. Briefly, the 84 EpiScores are the result of penalised regression models (one model for each protein) that select CpG sites that, in weighted combination, are predictive of individual protein levels. These 84 EpiScores met a testing threshold of Pearson r > 0.1 and p < 0.05 when projected into a subset of the GS cohort (STRADL: N = 778 [16]) and compared with measured protein levels [12]. EpiScores were projected into methylation data (beta values) in the LBC’s (nLBC1921 = 436; nLBC1936 = 895) and the GS cohort (n = 18,413) before being corrected for technical covariates through linear regression. Details of DNAm profiling and processing are detailed in Additional file 1. In GS, EpiScores were corrected for set and batch. In LBC1921 and LBC1936, EpiScores were corrected for set, array and hybridization date. Residuals from these regression models were extracted and used for all downstream analyses.
Cognitive test data
Cognitive testing in the GS cohort and LBC studies have been described previously [13,14,15, 17]. Briefly, cross-sectional scores are available for four tests in GS, while longitudinal data were considered for 13 tests in LBC1936 and for four tests in LBC1921 (full details in Additional file 1 with summary data presented in Additional file 3: Tables S1–S3).
MRI measures of brain health in LBC1936
Protocols for magnetic resonance imaging (MRI) acquisition and processing carried out in the LBC1936 cohort have been described previously [18]. Four measures of global brain health were considered: total brain volume, grey matter volume, normal appearing white matter volume, and white matter hyperintensity volume. These were assessed across four waves of data collection, starting at wave 2 (age 73). Intracranial volume was included as a covariate for baseline (intercept) analyses to account for any previous volume loss. Full details are presented in Additional file 1 with summary data in Additional file 3: Table S4.
Dementia diagnosis information
Dementia diagnosis data were obtained in all three cohorts. Full details are provided in Additional file 1. Briefly, GS data were obtained via linkage to primary and secondary care records (235 incident cases, 7555 controls—filtered so all were aged 65 or above at the time of diagnosis/censoring, Additional file 3: Table S5).
Dementia diagnosis information for LBC1921 and LBC1936 were obtained through electronic heath record (EHR) review [19]. Clinician home visits were also carried out by request in LBC1921 and LBC1936 when a participant showed signs of cognitive impairment, self-reported dementia, or an LBC researcher suspected the participant may have dementia. Consensus meetings were held to discuss each participant and determine whether they had dementia, probable dementia, possible dementia or had no dementia diagnosis, as well as dementia subtype (where possible) [19]. Of the participants with methylation data, there were 108 and 110 participants with a dementia diagnosis (692 and 452 controls) in LBC1936 and LBC1921, respectively (Additional file 3: Table S5). Date of diagnosis/time-to-event information was only available in LBC1936.
Statistical analysis
All statistical analysis were performed in R version 4.0.3 (2020-10-10) [20].
Descriptive statistics
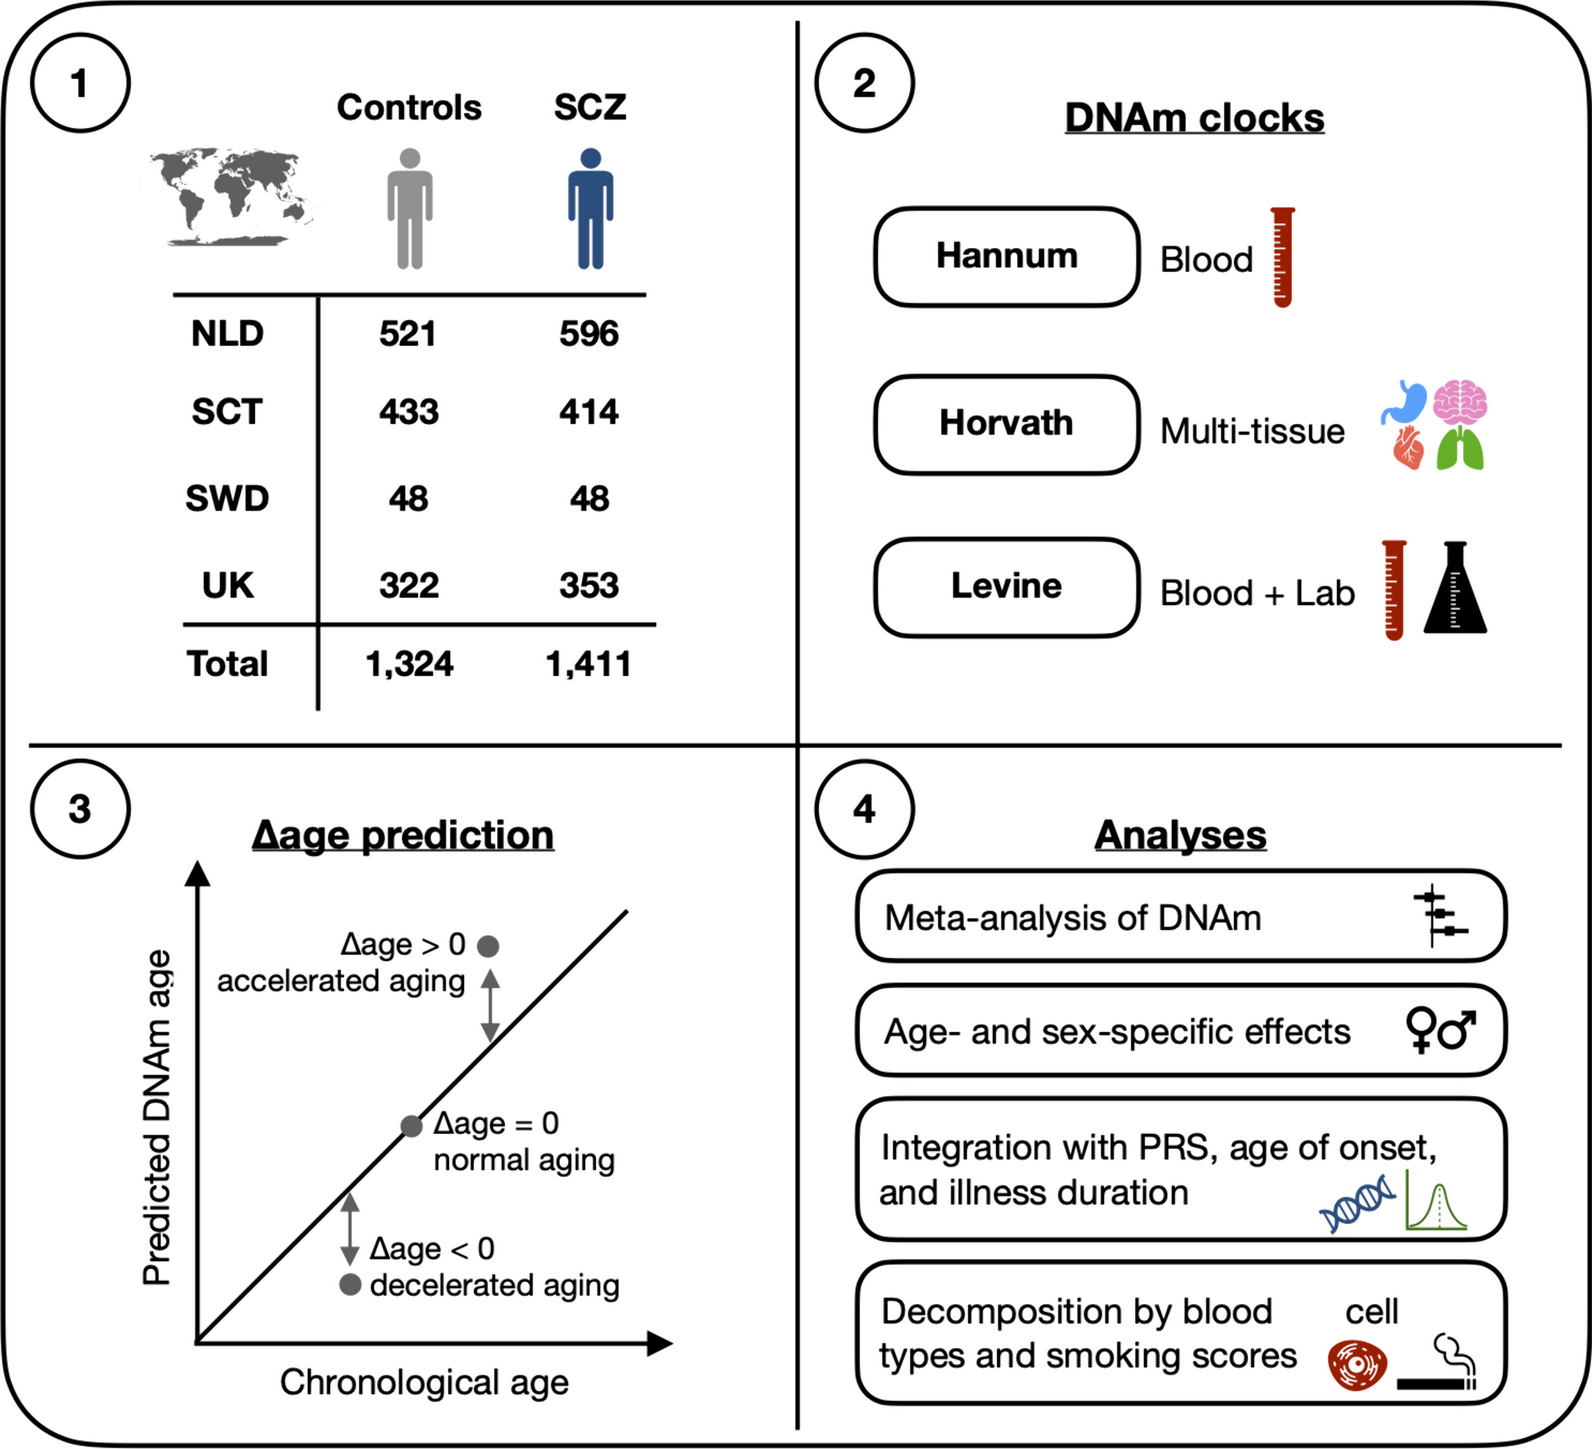
Sample sizes for cognitive, brain MRI measures and dementia shown in Fig. 1 highlight the maximal data available. Sample sizes vary across tests and decrease over follow-up in both LBC cohorts. Therefore, data available for each test/measure at each wave can be found in Additional file 3: Tables S1–S5.
Predictors of cognitive function, cognitive change and MRI brain health measures
All analyses in this study included basic- and fully-adjusted models. Outcomes of interest were latent intercept and slope variables for brain and cognitive outcomes (see Additional file 1 for details and Additional file 3: Tables S6–S9). Regression analyses were performed within the structural equation framework. Continuous covariates were scaled to aid in model convergence and to obtain standardised regression coefficients.
$$}\,}\,}\,}\,}\,\sim \,}\, + \,}\,}\,}\, + \,}$$
$$\begin }\,}: \, & }\,\sim \,}\, + \,}\, + \,}\, + \,}\,}\,}\,}\,}\,\left( }} \right) \\ & + \,}\,}\,}\left( }} \right)\, + \,}\,}\,}\left( }} \right)\, + \,}\,}\,}\,} \\ \end$$
Information regarding alcohol intake (weekly units) was obtained via a self-reported questionnaire. The Scottish Index of Multiple Deprivation (SIMD, 2006) in LBC1936 and GS, and social grades determined by highest reached occupation in LBC1921 [21, 22]. The SIMD ranged from 1 (most deprived) to 6505 (least deprived). Body Mass Index (BMI in kg/m2) was obtained via an in-clinic physical assessment. Epigenetic smoking scores were calculated for each participant from their DNAm profiles using the R package EpiSmokEr [23].
Descriptive statistics for all covariates in GS, LBC1936 and LBC1921 can be found in Additional file 3: Tables S10–S12.
Dementia analysis
Associations between the EpiScores and incident dementia (binary outcome) were tested in all three cohorts using logistic regression models with the “glm” function (with family set to binomial) from the R stats package (version: 4.0.3) [20]. Time-to-dementia analyses were also run in LBC1936 and GS using Cox proportional hazards (CoxPH) models through the R survival package (version: 3.3.1) [24]. Sensitivity analyses to account for related individuals (GS) and death as a competing risk (GS and LBC1936) were also considered (details in Additional file 1).
In GS, baseline appointments were from 2006 to 2011 and the dementia censor date was set to April 2022 resulting in a maximum of ~ 11–16 years lag time between sample collection and dementia. In LBC1936, sample collection was carried out at baseline appointment where participants were ~ age 70 and maximum age at the last dementia ascertainment is 86 years resulting in a maximum lag time of 16 years between sample collection and dementia. In LBC1921, sample collection was carried out at baseline appointment where participants were ~ age 79 years. The consensus meeting was in 2016 meaning the maximum age at dementia diagnosis could be 95; therefore, the maximum lag time between sample collection and dementia is ~ 16 years.
Meta-analyses
Meta-analyses were performed to obtain effect sizes weighted by sample size using results from the general cognitive function, dementia diagnosis (binary) and time-to-dementia models using the R package metafor (version: 4.2-0) [25].
Gene ontology enrichment and biological function/pathway look-up
Gene ontology analysis (GO) was performed on the statistically significant protein EpiScores using Functional Mapping and Annotation of Genome-Wide Association Studies (FUMA) software [26]. Specifically, we analysed the genes that code for the proteins that the EpiScores are proxies for. Benjamini–Hochberg False Discovery Rate (FDR) correction was used at a threshold of PFDR < 0.05. A gene list covering all of the 84 EpiScores was used as the background set of genes to test against. The UniProt database (Release 2024_01) [27] and Reactome database (Release 87) [28] were used to look-up the biological function/pathways for the proteins mapping to the significant EpiScores across each analysis.

留言 (0)