
記住我
Mishaps and accidents occur in overloaded conditions due to time pressure or hecticness and also in underloaded situations due to boredom or carelessness [1]. Most work environments are risk assessed to identify and mitigate these factors. In work environments involving human-machine interactions, safety is normally ensured by maintaining spatial separation between robot and the user. However, these classical safety measures may be insufficient for modern work environments, especially for collaborative environments where humans and machines work in close proximity, often with physical contact.
In physical human robot collaboration (pHRC), brain–computer interface (BCI) technology could play a prominent role in enabling occupational safety by providing a direct channel for communicating the cognitive state of the user. With BCI, the robotic partner gets access to the user's brain activity affording a direct communication pathway rather than relying on traditional communication routes like manual or speech input, which might distract the human partner from the task at hand. Embracing passive BCI technology in pHRC affords the ability to optimally adapt the robot behavior for each individual user based on real-time brain activity, enriching the quality of the interaction [2, 3].
To assess the users' brain activity, electroencephalography (EEG) can be used. EEG is a method to record the electrical activity of the human brain [4] with high temporal resolution at the same time scale as cognitive processes unfold. This method has previously been employed for BCI technology to decode the cognitive state of the user [5, 6] and adapt the interaction accordingly. This method could be employed to assess the user state [7–9] and to detect errors in the interaction with technical systems [10, 11].
In a pHRC, the robot might perform complex motion sequences with unexpected changes in velocity, assuming unpredictable positions in space [12]. Unpredicted or erroneous robot behavior or a faulty interaction can be measured from the EEG as error-related potential naturally generated by the brain when the human partner perceives an unexpected behavior or error occurrence [13–15]. An error-related potential consists of a time-locked negative peak or error-related negativity around 200 ms after the error occurrence [16, 17]. It is mostly followed by a positive peak around 300 ms after the error onset [14, 16], and this error positivity is related to the user's error awareness [18]. As error-related potentials occur at short latency, when detected online using machine learning methods [19–21], it can be used as implicit human feedback to optimize robot behavior [22]. Based on the interaction context, the detection of error-related potential can aid the automatic detection of higher-level user intention and achieve personalized rule-based robot control [23] for a safe and efficient pHRC.
In previous research, error-related potentials have been employed with reinforcement learning to train robots to mirror the gestures of a human user [22, 24]. An error-related potential was also used in a closed-loop system to switch the trajectory of a robot arm between two targets [25]. Further, Ehrlich and Cheng employed error-related potential in a closed-loop system to adapt the robot gaze based on the intention of the user [26] and later compared the error-related potential detection performance in case of unexpected movement of a robot head or cursor [27]. However, in these studies, human users were merely passive observers of the error unlike in real-world applications. Recently, Ehrlich et al [28] showcased how EEG measures capture partner anticipation during task transitions, using these signals to train a reinforcement learning algorithm for dynamic subtask assignment in robot–human collaborations.
In settings with active movement of participants, the prediction error negativity (PEN) was observed that appears during the execution of a motor task, prior to any external error indication. The PEN was first observed in a cognitive conflict study with active physical movement using Mobile Brain/Body Imaging [10, 11, 29]. In 2019, Aldini et al observed a PEN during an unexpected robot behavior in pHRC [30]. They evaluated the intuitiveness in a pHRC by comparing the modulations in the amplitude of PEN under different degrees of mechanical resistance in the transition to an unexpected robot stopping. Recently, they evaluated the performance of six classifiers in PEN detection as a step in the direction of intuitive pHRC [31].
However, the integration of BCI technology with PEN for robot control demands failure-free integration of highly uncertain EEG signals, particularly influenced by the physical and cognitive state of the user. Mentally demanding tasks might not only compromise access to cognitive resources [32] but might completely deplete resources [33] needed for successfully executing the task. Mental workload reflects the tuning between the task demand and the cognitive capacity of the user [34]. Researchers have reported an increase in the frontal theta power [35–39] and a decrease in the parietal alpha power with increasing mental workload [40, 41].
As task demands and the user's cognitive capacity continuously vary over time, the mental workload experienced by a user at any point in time could be unpredictable, and therefore, a one-size fits all adaptation approach may not accommodate the inter-subject variability. Further, there has been no systematic study on how mental workload variations impact cognitive conflict response. The detrimental effects of workload on human performance and situational awareness are well-known in the literature [42–44], however, its influence on error awareness might also raise safety concerns in pHRC.
We employed MoBI methods, which combines various approaches to examine human brain activity, motor behaviors, and other physiological data linked to cognitive processes that engage active behavior [45–47] in this work. We hypothesize that with increasing workload, there will be a diminished error awareness, reflected in reduced amplitudes of the accompanying PEN and Pe. We study the impact of workload variations on error awareness or cognitive conflict. We also explored the effects of an error occurrence on the mental workload of the user by evaluating the spectral variation after the error occurrence at the regions known to be indicators of mental workload—the frontal and the parietal region [35–41] and the region known to reflect sensorimotor processing—the central region [48–50].
In this study, the EEG features reflecting workload variations prior to the error occurrence were used to evaluate whether workload variations could predict error awareness. We employed different levels of complexity-based learning methods—ShallowConvNet, DeepConvNet [51] and EEGNet [52] for estimating the PEN and Pe values based on the EEG data prior to the error. We hypothesize that the EEG dynamics prior to reaching an obstacle or the unexpected robot stopping can predict the PEN and Pe amplitude with high resolution, thereby, paving the way for safe and reliable deployment of BCI technology in pHRC.
We designed our experimental paradigm as an interactive clock game with a task that emulates the abrasive blasting operation of the collaborative robot. Abrasive blasting is a demanding job that involves using pressurized air or water to propel abrasive materials onto a surface. This process is used to either smooth, roughen, reshape, or remove substances like rust, paint, or graffiti. In the abrasive blasting task, a human worker collaborates with a robot to control the movements of the tool. The robot assists the operator by providing guidance for the tool and sharing the physical workload. We considered abrasive blasting in our experiment because it effectively combines the strength, precision, and endurance of the robot with the skills, intuition, and decision-making capabilities of the human operator. The ANBOT [53], an intelligent industrial robot for abrasive blasting featuring a UR10 robot arm by Universal Robots, was the collaborative robotic partner in this experiment.
The mental workload variations were achieved using arithmetic tasks with low, medium and high task difficulty. The physical load was maintained constant across these conditions to investigate how mental workload variations influence physical performance. An error occurrence was achieved by an unexpected robot stopping at an invisible obstacle during the blasting operation. The NASA Task Load Index questionnaire [54] was employed to validate the mental workload variations by incorporating a subjective measure of workload.
2.1. ParticipantsThe experimental protocol was approved by the institute ethics committee (ETH21-6346). We had 24 participants (age 23 ± 4, 13 males and 11 females, all right-handed) in this study. Participants received a reimbursement of 60 AUD for their time and involvement. All participants selected for the study had no neurological or psychological disorders that might impact the experiment's results; they could wear glasses for vision correction. Additionally, the chosen participants were non-smokers and were asked to avoid drinking tea or coffee for at least 6 h before the experiment began.
2.2. EquipmentThe EEG data were collected using a wireless MOVE system (Brain Product GmbH, Germany) with 32 channels. The channels recorded were: Fp1, Fp2, F7, F3, Fz, F4, F8, FT9, FC5, FC1, FCz, FC2, FC6, FT10, T7, C3, Cz, C4, T8, CP5, CP1, CP2, CP6, TP9, P7, P3, Pz, P4, P8, TP10, O1 and O2 with AFz as the reference. The impedance of the electrodes was maintained below 20 kΩ, and the sampling rate was 1 kHz. The impedance of the electrodes was checked and confirmed to be below 20 kΩ approximately one hour after the start of the experiment while the participants rested after the second block of the experiment. The events from the experiment scenario were synchronized with EEG data with Lab Streaming Layer [55].
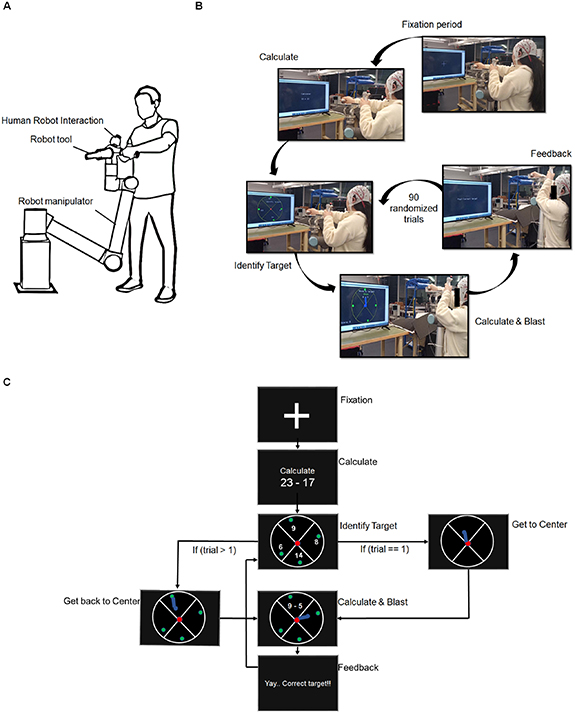
The ANBOT [53], an intelligent industrial robot for abrasive blasting featuring a UR10 robot arm by Universal Robots, was the collaborative robotic partner in this experiment. The participants were in contact with the robot arm through a handle mounted on the robot end-effector (see figure 1(A)). The interaction forces and torques are measured and controlled by the ATI mini-45 transducer, placed between the robotic arm and the end-effector.
Figure 1. Experiment design with (A) a schematic illustration of a person operating ANBOT, (B) shows the participant performing an experimental block and (C) shows a detailed representation of the block design.
Download figure:
Standard image High-resolution image 2.3. Experimental proceduresThe game-like primary task emulated a blasting task and employed a secondary task, mental calculation of varying difficulties, to manipulate the workload of the participants. The task was presented as an interactive game called the 'Clock Game' on a 65-inch-wide LED TV. During the game, the point where the nozzle of the ANBOT pointed to was represented by a blue dot on this screen, and for this experiment, the ANBOT was limited to 2-DOF. The participants were instructed to grasp the button on the back handle of the robot end-effector to move the robot arm. They also had to grasp the button on the front handle to blast the area where the nozzle moved. The area being blasted was shown on screen in blue and this kept the participants engaged in this task, and they used both hands to move the robot arm.
Initially, the participants performed a training session where they performed 30 trials of the task to familiarize themselves with the task and move the robot arm. The experiment was divided into three blocks with 90 randomized trials (figures 1(B) and (C)). Each block started with a fixation period of 10 s, where the participants looked at a fixation cross on the screen. After this, the initial starting arithmetic equation was shown on the screen. For the first trial, the participant only performed the calculation in the allocated five seconds and had not moved the robot. This initial blasting trial was discarded in the EEG, task performance and physical performance analysis. The arithmetic equation was either adding or subtracting one-digit, two-digit, or three-digit numbers.
In the low workload condition, the arithmetic equation was a one-digit number addition or subtraction (e.g. 9 − 1). For medium workload condition, the arithmetic equation was the addition or subtraction of two-digit numbers with no carryover (e.g. 13 + 24). For the high workload condition, the arithmetic equation was either the addition or subtraction of three-digit numbers. Also, the addition involved carryover in the one's and ten's places (e.g. 135 + 168) and the subtraction of three-digit numbers with borrowing from hundred's and ten's place (e.g. 423 − 187).
In the first trial, the participants performed the calculation, after which, a large circle with a red dot at the center and four green dots along the perimeter was shown. Each of the green dots in the perimeter had a number next to it. The participants were asked to identify the current target, which was the green dot, with the answer to the arithmetic equation that they had previously solved. This 'Identify Target' phase was presented for 2 s, within which the participants had to identify the target green dot.
Afterwards, the participants were instructed to move the blue dot to the center of the big circle or the red dot. When the participants brought the robot's nozzle represented by the blue dot to the center, the participants received instructions to 'Move to Target' and 'Calculate' along with an arithmetic equation of random difficulty. The participants then moved the robot arm while performing the calculation, and they had five seconds to complete the blasting task or the trial reset. In order to maintain participants' interest in the game, we displayed a score on the screen, which was calculated based on the sprayed area and the target identification accuracy. The arithmetic equation disappeared from the screen as soon as the robot arm reached the target position ensuring that participants performed the calculation simultaneously while moving the robot arm.
The unexpected robot stopping was achieved by placing an invisible obstacle placed three-fifths on the path to any potential target or green dot. The screen also turned black when the participants reached the obstacle to corroborate the occurrence of the error. We also ensured that the participant would not be able to move around the invisible obstacle to try and reach the target, as the invisible obstacle takes the form of an annular barrier that restricts any movement of the robot arm. The robot arm remained stuck until the blasting phase resets. The probability of occurrence of the invisible obstacle in the blasting path was limited to 33% to prevent participants from generating an internal cognitive anticipating an unexpected robot stopping. Therefore, within each block, there were 90 trials of each workload condition with 60 trials of normal blasting and 30 error trials, and the trials with unexpected robot stopping were completely randomized.
After the blast phase, the participant received feedback with messages, such as 'Yay! Correct target', 'Oops. Wrong target' or 'Sorry. Time is up' in case of the normal trials. They received feedback such as 'Aborting trial. Correct Direction', 'Aborting trial. Wrong Direction' or 'Sorry. Time is up' in case of obstacle trials. We provided such feedback messages to keep the participants engaged in the task. After the feedback, which is shown for 1.5 s, the participants were asked to identify the target again based on the equation's answer before they were instructed to 'Get back to center'. During each block, the participants were randomly asked to complete the NASA-TLX questionnaire to record their subjective workload ratings. The NASA-TLX questionnaire evaluated the mental demand, physical demand, temporal demand, performance, frustration and effort measures. The participants provided a score between 0 and 100 for each of these measures every time the NASA-TLX questionnaire sought their subjective workload ratings in a trial. Following the participant's identification of the target during the 'Identify Target' phase, the experiment paused to record the participant's NASA-TLX ratings. Afterward, it resumed with the 'Calculate and Blast' phase. In our analysis of the Behavior data, we excluded the trials where NASA-TLX ratings were gathered to calculate accuracy. For each workload condition within a block, we collected NASA-TLX ratings twice from every participant.
Every participant performed three blocks and each block had randomized workload trials with Normal and Obstacle conditions. Every block was approximately 18–20 min, and participants rested for 10 min before proceeding to the subsequent block. All participants performed the clock game for approximately 1.5 h.
2.4. ANBOT control systemThe control system that achieved pHRC in our experiment is outlined in [30, 31]. We employed an admittance-based controller [56] to convert the forces applied by the operator on the handles into the desired velocities of the robot in Cartesian space. To maintain the robot's admittance without introducing a singularity avoidance strategy, we restricted the task to a specific area within the robot's workspace. This ensured that the Jacobian matrix remained invertible in the designated workspace without requiring an active singularity avoidance algorithm, which could have led to unintended opposing forces. The calculation for the desired Cartesian velocities is shown below:

Here,  represents the desired velocities of the robot's end effector in Cartesian space.
  stands for the diagonal matrix holding the admittance gains,
  indicates the forces exchanged with the human operator,
  refers to a force vector that smooths out the Cartesian velocities, and
  represents the resistive force introduced to manipulate cognitive conflict. The admittance gains are specifically set at 0.01 m sN−1 for the linear parts and 0.4 rad sN−1 for the angular parts. To calculate
  , we multiply the actual Cartesian velocity of the robot's end effector,
  , by a diagonal matrix of gains serving as a damper
  .
.
In our experiments, we restricted the movements of the robot end effector in certain directions and orientations using a simple P controller. This controller manages the end effector's position at specific set points within those directions. Using  to represent the directions and orientations in Cartesian space (where
  for the two active directions in the planar task), we can summarize the control system for the experiment as follows:

In this setup,  represents the real Cartesian position in the
  th direction, while
  is the targeted Cartesian position. The operator solely presents
  , and their perceived admittance is
  . The resistive force,
  , acts like a compressed spring, opposing movement and influencing the admittance in our experiment. To adjust both the admittance and its rate of change, we utilize the resistive force
  , which is calculated based on Hooke's law:

The stiffness gain, represented by  , gets multiplied by
  , which stands for the difference between the cursor's position (the point aimed at by the ANBOT's nozzle),
  and the position where the resistive force begins,
  . The position where the robot's movement is restricted is
  , corresponding to the target in Normal trials or the hidden obstacle in Obstacle trials. As the cursor moves from its starting point,
  sits just before the target or obstacle, positioning the start of the force at
  . Consequently,
Once  reaches
  , the robot's movements come to a halt. To create a sudden resistance upon reaching the obstacle or target,
  is positioned 20 pixels (equivalent to 2.3 cm) before the center of either the target or obstacle.
The NASA-TLX scores were randomly collected from the participants for all the six conditions: low, medium and high workload conditions, for both normal and obstacle trials in a block. The mean scores of each subscale were then calculated for each condition.
3.2. Behavioral and performance data analysisThe performance in the obstacle trials of the blasting task was evaluated by (i) the target identification accuracy and (ii) the time to reach the obstacle. Target identification accuracy for each workload level was the ratio of the number of trials where the participant correctly identified the target to the total number of trials,
where n_correct was the number of trials where participants correctly identified the target and moved in the correct direction before reaching the obstacle, and n_total was the total number of obstacle trials. The time taken to move the robot arm from the center of the circle to the invisible obstacle in the blasting path to any potential targets was also considered for the different workload conditions. Further, the mean applied force and mean end-effector velocity was extracted from the force-torque sensor (ATI Mini-45) placed between the handle and blasting nozzle.
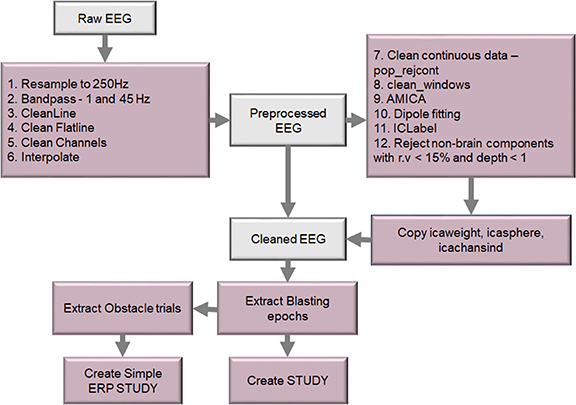
3.3. EEG processingEEG was preprocessed using EEGLAB v2022.0 toolbox [57] in MATLAB R2020b (The Mathworks, Inc., Natick, MA, USA), as shown in figure 2. The data was down-sampled to 250 Hz, before band-pass filtering between 1 and 45 Hz using eegfilt function in EEGLAB, which performs two-way least-squares finite impulse response filtering. Line noise was removed using the clean_line function of EEGLAB which estimates and removes sinusoidal noise from the data using Thompson F-statistic and multi-tapering. The channels with flat lines for over three seconds were eliminated using clean_flatline function in EEGLAB. Subsequently, using the clean_channels function, the noisy channels were also identified and removed. On average, 2 ± 0.4 channels were removed, which were later restored using the spherical spline method, which interpolated the data from neighboring channels. A copy of this dataset was made, and using pop_rejcont, continuous artifactual regions were cut off. Then, the clean_windows function was used to perform window cleaning. After these artifact removal steps, independent component analysis (ICA) [58] was performed using EEGLAB's AMICA algorithm [59, 60].
Figure 2. EEG data processing.
Download figure:
Standard image High-resolution imageAfter decomposing each participant's data by ICA, we employed ICLabel plugin [61] in EEGLAB to identify and reject all the components with less than 30% of brain activity. Subjects had 5 ± 0.76 ICs remaining after this step. Then, the ICA information (icawinv, icasphere, and icaweights) was copied back to the original dataset and component data was back-projected to the sensor level. All the blasting epochs were extracted, and three datasets corresponding to the three workload levels of blasting were created. We further extracted the obstacle trials from these three blasting datasets to form another three datasets with obstacle trials under low, medium and high workload conditions in order to study the PEN and Pe modulations across the three workload conditions.
3.4. IC clusteringThe data from multiple participants were managed and processed using the EEGLAB STUDY structure [62]. A Study was created with a group (of 24 participants) with six conditions corresponding to the three workload levels and the presence or absence of obstacle. The components for all participants were clustered using k-means clustering algorithm [63] based on three equally weighted (weight = 3) criteria: (1) dipole locations, (2) dipole orientation, and (3) scalp maps to produce six clusters. The frontal, central and parietal clusters were identified using Talairach coordinates [64] of the fitted dipole sources of these clusters.
For the frontal, central, and parietal clusters, the power spectral density (PSD) of each component was evaluated using the spectopo function, considering each 1 s segment using a Hamming window. For each IC of the frontal, central and parietal clusters, the mean (PSD) at delta (1–4 Hz), theta (4–8 Hz), alpha (8–12 Hz) and beta (12–30 Hz) and gamma (30–45 Hz) bands were examined for the 1 s immediately after reaching the target in normal conditions and for the 1 s immediately after reaching the obstacle in the obstacle trials. The calculated PSD at each IC was normalized using the fixation period as the baseline to compare the changes in PSD upon reaching either target or obstacle in different workload conditions.
We also created a simple ERP Study, implemented in EEGLAB, with a group (of 24 participants) with three conditions corresponding to the three workload levels. The components for all participants were clustered using k-means clustering algorithm [63] based on three equally weighted (weight = 3) criteria: (1) dipole locations, (2) dipole orientation, and (3) scalp maps. The channel-based ERP data was evaluated at all the 32 channels. PEN was measured as the minimum error negativity amplitude in the 100–350 ms window after reaching the obstacle, and Pe was measured as the maximum error positivity in the 350–450 ms window after reaching the obstacle.
3.5. Prediction of PEN and Pe amplitude from EEG dataWe employed deep learning algorithms to predict PEN and Pe amplitudes from the EEG data prior to reaching the obstacle. The two seconds of preprocessed EEG data prior to reaching the obstacle was used as the input to EEGNet, ShallowConvNet and DeepConvNet [65] to predict the PEN and Pe amplitude at the Fz channel. We used 80% of the data for training and it was in the (1026 × 500 × 29) format and 20% for validation (342 × 500 × 29) and another 20% for testing (342 × 500 × 29). Using hyperparameter optimization, we identified and employed the optimal batch size = 128, dropout rate = 0.5 and Adam optimizer.
3.6. Statistical analysisSPSS (IBM SPSS 26.0; Chicago, IL, USA) statistical tool was used to conduct all the statistical analyses in this study. Using the Shapiro–Wilk test, it was ascertained that the data was normally distributed. The variations of the NASA-TLX scores with the workload levels and the presence and absence of obstacle was evaluated using two-way repeated measures analysis of variance (ANOVA) test with workload levels and trial type (normal or obstacle trial) as within-subjects factors. The variations of EEG parameters, task and physical performance at three workload levels of the task were investigated by conducting a one-way repeated-measures ANOVA with the workload level as the within-subjects factor. We used Mauchly's test to test for sphericity, and if sphericity was dissatisfied (p < .05), Greenhouse–Geisser correction was performed. Posthoc comparisons were conducted with Bonferroni corrections (α = 0.05) if the main effect of ANOVA was significant.
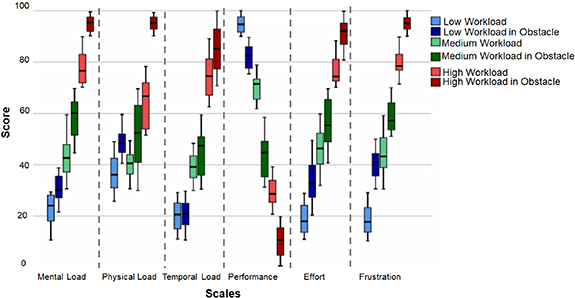
4.1. Subjective workload measuresThe subjective workload measures of the NASA-TLX increased with increasing difficulty levels in the arithmetic task in the clock game task with unexpected robot stopping, as shown in figure 3. The results of the two-way repeated measures ANOVA revealed that there was significant main effect of workload on participants' mental demand scores (F(2, 48) = 1499.764, p < .01, ηp2 = .980). Also, the ANOVA revealed that mental demand scores during trials with unexpected robot stopping were significant (F(1, 24) = 163.748, p < .01, ηp2 = .845). Further, there was a significant interaction between workload and unexpected robot stopping (F(2, 48) = 3.191, p = .048, ηp2 = .096) such that participants reported increasing mental demand scores with the increasing workload during conditions with unexpected robot stopping than the normal conditions. There was a significant main effect of workload on participants' physical demand scores (F(2, 48) = 403.112, p < .01, ηp2 = .931). Also, the ANOVA revealed that physical demand scores during trials with unexpected robot stopping were significantly higher compared to normal trials (F(1, 24) = 408.133, p < .01, ηp2 = .932). Further, there was a significant interaction between workload and unexpected robot stopping (F(2, 48) = 26.118, p < .01, ηp2 = .465) such that participants reported greater physical demand scores with the increasing workload during conditions with unexpected robot stopping than the normal conditions.
Figure 3. Shows the NASA-TLX scores during the normal and obstacle conditions for the three workload levels (** denotes p < .01).
Download figure:
Standard image High-resolution imageThe results of the two-way repeated measures ANOVA revealed that there was a significant main effect of workload on participants' temporal demand scores (F(2, 48) = 1177.726, p < .01, ηp2 = .975). Also, the ANOVA revealed that temporal demand scores during trials with unexpected robot stopping were significant (F(1, 24) = 12.462, p = .001, ηp2 = .293). Further, there was a significant interaction between workload and unexpected robot stopping (F(2, 48) = 15.432, p < .01, ηp2 = .340) such that participants reported increasing temporal demand scores with the increasing workload during conditions with unexpected robot stopping than the normal conditions. There was a significant main effect of workload on participants' performance scores (F(2, 48) = 1016.185, p < .01, ηp2 = .971). Also, the ANOVA revealed that performance scores during trials with unexpected robot stopping were significant (F(1, 24) = 925.325, p < .01, ηp2 = .969). Further, there was a significant interaction between workload and unexpected robot stopping (F(2, 48) = 100.151, p < .01, ηp2 = .769) such that participants reported higher performance scores with the increasing workload during conditions with unexpected robot stopping than the normal conditions.
There was a significant main effect of workload on participants' effort scores (F(2, 48) = 1091.580, p < .01, ηp2 = .973). Also, the ANOVA revealed that effort scores during trials with unexpected robot stopping were significant (F(1, 24) = 202.924, p = .001, ηp2 = .871). However, there was no significant interaction between workload and unexpected robot stopping as the participants reported similar increasing effort scores with the increasing workload during unexpected robot stopping and normal conditions. There was a significant main effect of workload on participants' frustration scores (F(2, 48) = 1368.842, p < .01, ηp2 = .979). Also, the ANOVA revealed that frustration scores during trials with unexpected robot stopping were significant (F(1, 24) = 334.303, p < .01, ηp2 = .918). Also, there was no significant interaction between workload and unexpected robot stopping as the participants reported similarly increasing frustration scores with the increasing workload during unexpected robot stopping and normal conditions.
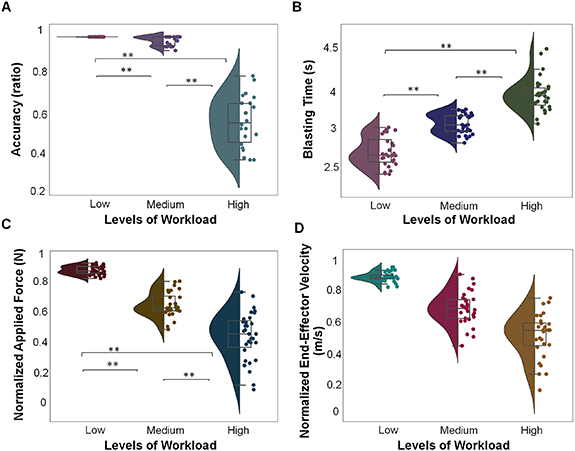
4.2. Behavioral resultsThe target identification accuracy deteriorated significantly with increasing workload during the unexpected robot stopping conditions, [F(2, 48) = 228.770, p < .001, ηp2 = .916], as shown in figure 4(A). Target identification accuracy significantly decreased for low and medium (p = .004), low and high (p < .01) and medium and high (p < .01) conditions. The time to reach the obstacle increased with the increasing workload in the unexpected robot stopping conditions, [F(2, 48) = 113.896, p < .01, ηp2 = .792], as shown in figure 4(B). The increase was significant for low and medium (p < .01), low and high (p < .01) and medium and high conditions (p < .01).
Figure 4. ANBOT collected data: (A) shows the target identification accuracy, (B) shows the time to reach the obstacle, (C) shows the normalized applied force and (D) shows the normalized end-effector velocity for the three workload levels with unexpected robot stopping condition due to obstacle in the blasting path. (** denotes p < .01).
Download figure:
Standard image High-resolution image 4.3. Physical performance resultsThe applied human force decreased significantly with the increasing workload during the unexpected robot stopping conditions, [F(2, 48) = 130.340, p < .01, ηp2 = .828], as shown in figure 4(C). Applied human force decreased significantly for low and medium (p < .01), low and high (p < .01), and medium and high conditions (p < .01). The end-effector velocity decreased with the increasing workload during the unexpected robot stopping conditions, [F(2, 48) = 86.647, p < .01, ηp2 = .762], with significant decreases for low and medium (p < .01), low and high (p < .01), and medium and high (p < .01), as shown in figure 3(D).
5.1. Independent source clustersThe frontal, central and parietal clusters were identified based on the dipole locations and the cluster centroid [50]. The Talairach coordinate of the frontal cluster centroid was at (4, 38, 39) and included 19 components from the 19 participants. The Talairach coordinate of the central cluster centroid was at (3, −5, 51) and had 18 components from 18 participants. The Talairach coordinate of the parietal cluster centroid was at (11, −49, 45), including 24 ICs from 24 participants.
5.2. Frontal clusterThe frontal cluster's ICs' PSD for the different workload conditions during blasting is shown in figure 5(A). There was significant main effect of workload on frontal theta PSD (F(2, 38) = 37.894, p < .01, ηp2 = .643) during unexpected robot stopping condition. Frontal theta PSD increased significantly in the low-medium (p < .01), medium-high (p = .003) and low-high (p < .01) conditions shortly after unexpected robot stopping. Further, the frontal theta power was significantly higher after reaching the obstacle as compared to reaching the target for the low (p < .01), medium (p = .029) and high (p < .01) workload conditions. However, there were no significant differences in the frontal cluster's delta, alpha, beta or gamma PSD.
Figure 5. (A) shows the frontal cluster—(A1) scalp map, (A2) dipole locations of the components, the Talairach coordinate of the cluster centroid was at (4, 38, 39) and (A3) normalized theta PSD for the one second immediately after reaching the target or the obstacle at the ICs selected in the frontal cluster during blasting. (B) Shows the parietal cluster—(B1) scalp map, (B2) dipole locations of the components, the Talairach coordinate of the cluster centroid was at (11, −49, 45) and (B3) normalized alpha PSD for the one second after reaching the target or the obstacle at the ICs selected in the parietal cluster. (C) Shows the central cluster—(C1) scalp map, (C2) dipole locations of the components, the Talairach coordinate of the cluster centroid was at (3, −5, 51), (C3) normalized alpha PSD, and (C4) normalized beta PSD for the one second immediately after reaching the target or obstacle at the ICs selected in the central cluster (** denotes p < .01).
Download figure:
Standard image High-resolution image 5.3. Central clusterThe central cluster's ICs' spectral power for different workload conditions soon after reaching the obstacle in the unexpected robot stopping condition and after reaching the target in the normal conditions is shown in figure 5(C). There was a significant main effect of workload on central alpha PSD (F(2, 36) = 15.274, p < .01, ηp2 = .540) during unexpected robot stopping condition. Central alpha PSD increased significantly in the medium-high (p = .038) and low-high (p < .01) conditions shortly after the unexpected robot stopping. Further, the central alpha power varied significantly only for the low workload condition (p < .01) upon reaching the obstacle as compared to reaching the target. The central beta PSD varied significantly after reaching the obstacle across the three workload levels (F(2, 36) = 18.453, p < .01, ηp2 = .552). Central beta PSD increased significantly in the medium-high (p = .002) and low-high (p = .001) conditions shortly after the unexpected robot stopping. Further, the central beta power increased significantly for the low (p < .01) and medium (p < .01) workload conditions upon reaching the obstacle as compared to reaching the target. No significant changes were noted in the other frequency bands across the workload conditions.
5.4. Parietal clusterThe parietal cluster's ICs' spectral power for the three workload levels upon reaching the target in the unexpected robot stopping condition or reaching the obstacle in the normal condition is illustrated in figure 5(B). There was a significant main effect of workload on parietal alpha PSD (F(2, 48) = 59.458, p < .01, ηp2 = .730) during unexpected robot stopping condition. Parietal alpha PSD decreased significantly in the low-medium (p < .01), medium-high (p = .003) and low-high (p &l
留言 (0)