Animals
Sixty male eight-week-old adult male Kun Ming (KM) mice were purchased from Slac Animal Co., Ltd. (Changsha, China). The number of animals involved in the study and their suffering were kept to a minimum. The Central South University’s Animal Care Ethics Committee authorized all animal experimental protocols. All animal experiments were complied with the regulations and guidelines established by the Animal Care and Use Committee of Central South University (Approval number: 2021sydw0136) and all experiments in this paper adhere to the ARRIVE guidelines. All animals were kept (four mice/cage) under standard laboratory conditions with a 12-hour light/dark cycle and standard humidity and temperature.
EV production and characterization
Primary human ADSCs were procured from Cyagen Biosciences (Guangzhou, China) and cultured following the supplier’s guidelines. ADSCs were isolated from four healthy donors (information supported by the Cyagen Biosciences) and used from passages 3–5. Following the manufacturer’s instructions, adipogenic and osteogenic differentiation kits (Stem Cell Technologies, Canada) were used to perform adipogenic and osteogenic differentiation. Human antibodies labeled with fluorophore-conjugated were used to test CD44-PE, CD73-BV421, CD90-APC, CD105-PE, CD34-FITC, CD45-BV421 (BD Biosciences, USA) on the BD FACSCelesta flow cytometer. ADSCs were grown in medium without serum for 48 h after three PBS washes until they were 85–90% confluent. After three PBS washes, ADSCs were cultured in serum-free media for 48 h until they were 85–90% confluent. Then, to eliminate suspended cells and cell debris, the supernatants were collected and centrifuged for 15 min each at 400 g and 2,500 g at 4°C. The supernatants were then subjected to ultracentrifugation at 140,000 g at 4°C for 2 h (Beckman Coulter, USA) to pellet the EVs after filtration through a 0.8 μm membrane. The pellets containing ADSC-EVs were resuspended in DPBS for subsequent experiments. The phenotype of ADSC-EVs was examined using transmission electron microscopy (TEM), and the protein concentration was determined using a micro-BCA protein assay kit (Thermo Fisher Scientific, USA). The number of particles and their size distributions were measured by nanotracking analysis (ZetaView, Germany). Expression of marker proteins, CD9 and Alix (CST, USA) were detected by Western blotting.
BV-2 cell culture and activation
BV-2 (microglial cell line) was obtained, cultured, and stimulated as described in our previous study. Briefly, complete media (DMEM + 10% FBS, Gibco, USA) was used to grow BV-2 cells at 37°C in a humidified incubator with 5% CO2. Lipopolysaccharide (LPS, 1 g/ml, Sigma, USA) was used to stimulate BV-2 cells for 24 h or LPS + ADSC-EVs (50 µg protein/ml) [21] for 24 h.
ADSC-EVs labeling and cellular internalization
ADSC-EVs labeling was performed using 5µM CM-DiI Dye (Invitrogen, USA) for 30 min following the manufacturer’s instruction, followed by PBS washes and re-ultracentrifugation to remove the unbound dye. BV-2 cells were co-cultured with Dil-labeled ADSC-EVs for 10 h. The cytoskeleton and nuclei were stained with Alexa Fluor 488 phalloidin dye (CST, USA) and DAPI (CST, USA), respectively, before examination with a Zeiss confocal fluorescence microscope.
RT‑qPCR
According to the manufacturer’s instructions, total RNA was extracted from BV-2 cells with the SteadyPure Quick Extraction Kit (Accurate Biotechnology, China). Complementary DNA (cDNA) was synthesized by RT SuperMix (Vazyme, China). The ChamQ Universal SYBR Mix (Vazyme, China) and LightCycler® 96 machine were used to conduct experiments and analyze data. The following primer sequences (5′-3′) were employed: mouse IL-6 (TCTGCAAGAGACTTCCATCCAGT, TCTGCAAGTGCATCATCGTTGT), mouse IL-1β (TCCTTGTGCAAGTGTCTGAAGC, ATGAGTGATACTGCCTGCCTGA), mouse TNF-α (GCCTCTTCTCATTCCTGCTT, CTCCTCCACTTGGTGGTTTG), mouse 18 S rRNA (GACTCAACACGGGAAACCTC, ATGCCAGAGTCTCGTTCGTT). Relative mRNA expression was obtained following the 2−ΔΔCt method compared to 18 S rRNA. All measurements were performed in triplicate.
Cytometric bead array assay (CBA)
The CBA kit (BD Biosciences, USA) was employed to quantify the concentrations of TNF-α, IL-6, and IL-1β in the BV-2 cell culture supernatant following the manufacturer’s recommendations. Measurements were performed by flow cytometry and analyzed using the CBA software (FCAP Array).
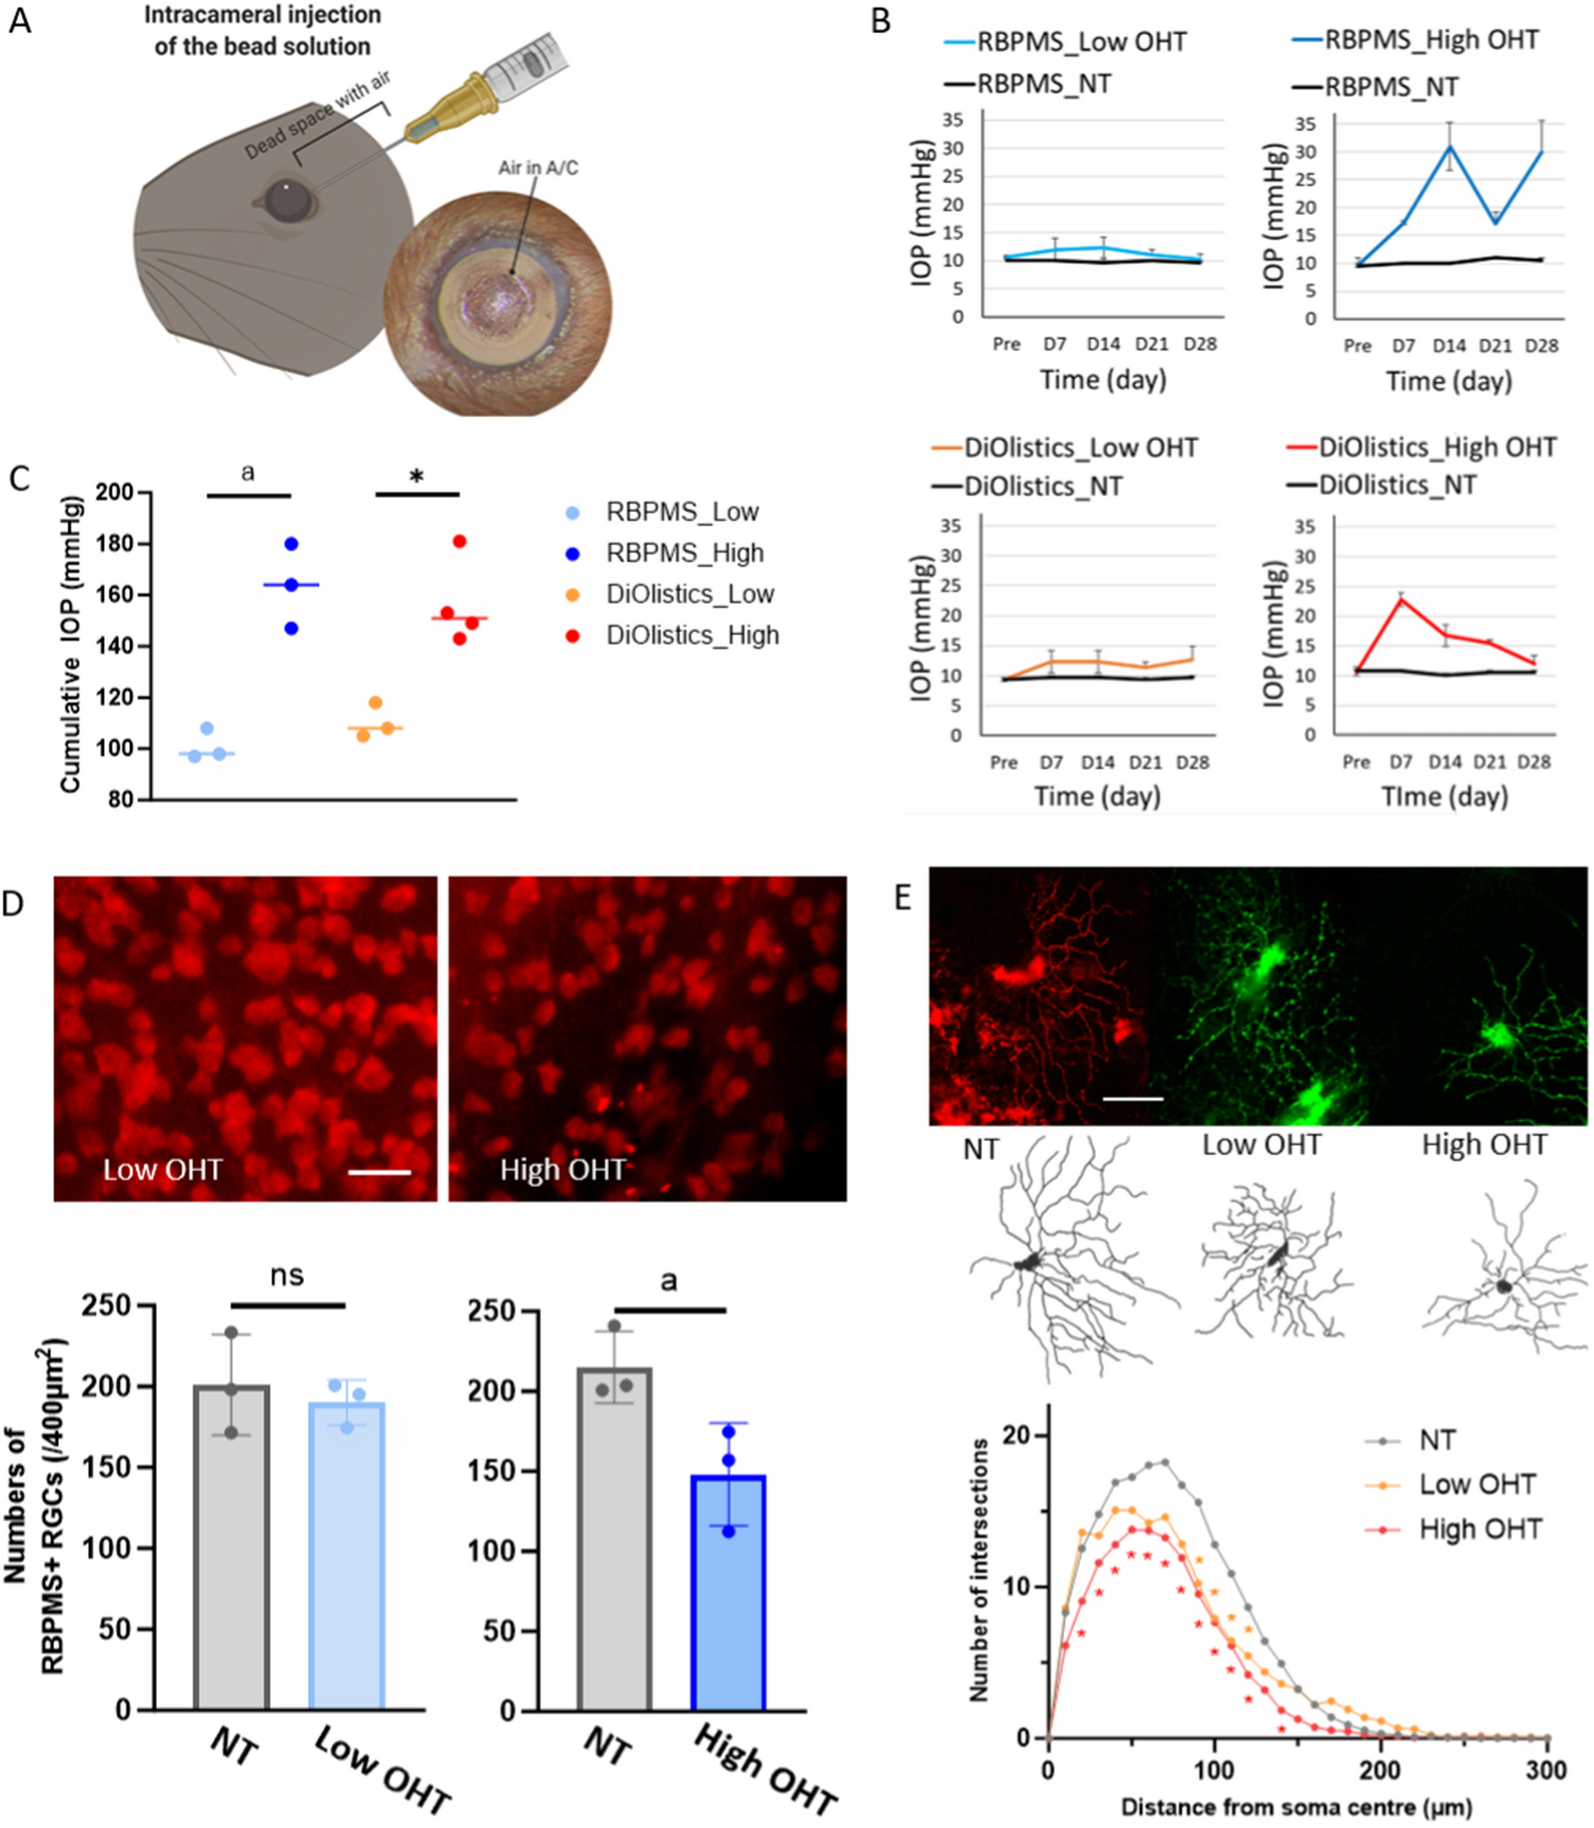
Induction of OHT, IOP measurement, and ADSC-EV administration
The OHT mouse model was established as described in our previous study [13, 20]. Specifically, the animals were anesthetized by intraperitoneal injection of 1.25% tribromoethanol (20 µl/g, Lab Anim Sci-Tech, China) for dilating pupils and anesthetic eye drops with tropicamide phenylephrine (Santen, Japan) and oxybuprocaine hydrochloride (Santen, Japan). After anterior chamber penetration, we injected 2 µL air and 3 µL microsphere suspension (1 × 10⁵ microspheres/µL, 10 μm diameter, Thermo Fisher Scientific, USA) into the anterior chamber to establish the OHT model. Using a handheld tonometer (TonoLab, Finland), IOP was measured once every six days for 17 days at approximately the same time during at the 9 AM and 11 AM. Six measurements from each eye were recorded and averaged. To explore the protective effects of ADSC-EVs, KM mice were split into the following categories at random (n = 20): Control: sham; OHT + ADSC-EVs: OHT mice treated with intravitreal injection of 3 µg (4.5 × 10⁸ particles) ADSC-EVs in 1.5 µl PBS, and OHT + PBS: OHT mice treated with intravitreal injection of 1.5 µl PBS. ADSC-EVs and PBS were administered intravitreally as described in our previous study by using a 33G Hamilton syringe (Hamilton, USA).
Tissue preparation, histological analysis, and immunohistochemistry
Optic nerve and eyeball tissues were harvested, fixed in 3% paraformaldehyde (PFA, Solarbio, China) at 4°C for 4 h, and then either dissected for retinal flatmounts or for tissue slices. Retinal flatmounts and 10 μm slices were permeabilized and blocked in 0.4% Triton X-100 and blocking buffer at room temperature (RT) for two hours. Subsequently, the samples were incubated with primary antibodies (1:100, Novus, USA) overnight at 4°C. The following primary antibodies were used: goat anti-Iba-1 antibody, rat anti-CD68 antibody, mouse anti-CCL2 antibody, and mouse anti-TLR4 antibody. After washing, the samples were incubated with species-specific secondary antibodies at RT for 60 min, rewashed, and counterstained with DAPI (Vector Laboratories, USA). To evaluate RGC axonal loss, we obtained semithin transverse sections from the optic nerve, 2 mm distal to the globe. These sections were stained with 1% toluidine blue and then photographed.
Optical coherence tomography (OCT)
OCT was used to measure inner retinal thickness as previously described [20]. Briefly, fundus and OCT images of the retina around the optic disc were obtained, and the Insight software (Phoenix Research Labs, USA) was used to measure the retinal thickness.
Visual evoked potential (VEP)
Flash VEP (Roland, Germany) examination was used to record RGC function. Mice were dark-adapted for more than 10 h and anesthetized as before. After pupil dilation, needle electrodes were placed under the nasal skin and subdermally in the midline of the head, respectively. Mice were then exposed to flashes of 1 Hz, 3 cd·s/m2. The amplitude and latency of P1 waves were used.
Microscopy
All fluorescently stained images were taken using a Zeiss confocal fluorescence microscope with stable settings. For retinal flat-mounted Iba-1+ cells, images were taken at ×20 magnification with z-stack. Two independent, blinded researchers used ImageJ to count Iba-1+ cells in five retinal pictures. The RBPMS+ RGC counting was performed using the same method. For Iba-1+ cells in the optic nerve cross-section, images were taken at ×20 magnification. We quantified the expression of CD68, Iba-1, CCL2, and TLR4 in the retina and optic nerve sections by measuring their fluorescence intensity using the ImageJ software.
Western blot analysis
RIPA lysis buffer including protease inhibitors (Sigma, USA) was used to obtain the total protein from ADSC-EVs, BV-2 cells, retinas, and optic nerves. Pierce BCA assay (Thermo Scientific, USA) was used to quantify the protein amount. Proteins (30 µg) were separated by SDS-PAGE and transferred onto PVDF membranes (Millipore, USA). Before primary antibody incubation, the membranes were blocked using QuickBlock™ buffer (Beyotime Biotechnology, China) at RT for 20 min. The following primary antibodies (1:800, CST, USA) were used: mouse anti-Alix antibody, rabbit anti-CD9 antibody, mouse anti-GAPDH, rabbit anti-TNF-α, rabbit anti-IL-6, rabbit anti-IL-1β, rabbit anti-β-actin, mouse anti-TLR4 antibody, rabbit anti-phospho-Erk, rabbit anti-phospho-p38 MAPK, and rabbit anti-phospho-NF-κB p65. The PVDF membranes were then incubated for 60 min at RT using species-specific secondary antibodies, detected using the enhanced chemiluminescence (ECL, Millipore, USA) solution, and captured on the Odyssey Imaging System (LI-COR, USA).
Statistical analysis
We used the Prism 8 software to analyze all the data. The mean and standard error of the mean were computed to express our results. Student’s t-test or one-way ANOVA followed by Tukey’s multiple comparison test were used to assess the statistical differences.


留言 (0)