Mice
C57BL/6J male mice (Jackson Laboratory, Bar Harbor, ME) were allowed to acclimatize to the housing facility for 2 weeks before experimentation. Mouse studies were performed in compliance with the ARVO Statement for the Use of Animals in Ophthalmic and Vision Research, and all experimental procedures were approved by the Institutional Animal Care and Use Committee (IACUC) at the University of California, Berkeley. Mice were maintained in a pathogen-free vivarium under a 12-hour dark and light cycle with access to food and water.
Macaque optic nerves
The macaque optic nerves used for the lipidomic study were from the eyes of a 9-year and 306-day-old female from the Oregon National Primate Research Center (NPRC). For the RNAseq studies, optic nerves were from a 12-year-old male acquired at UC Berkeley. In both cases, the eyes were collected postmortem for approved studies by different research groups, and the optic nerves were donated to the Gronert/Flanagan Lab as discarded tissue.
Induction of ocular hypertension by injection of silicone oil
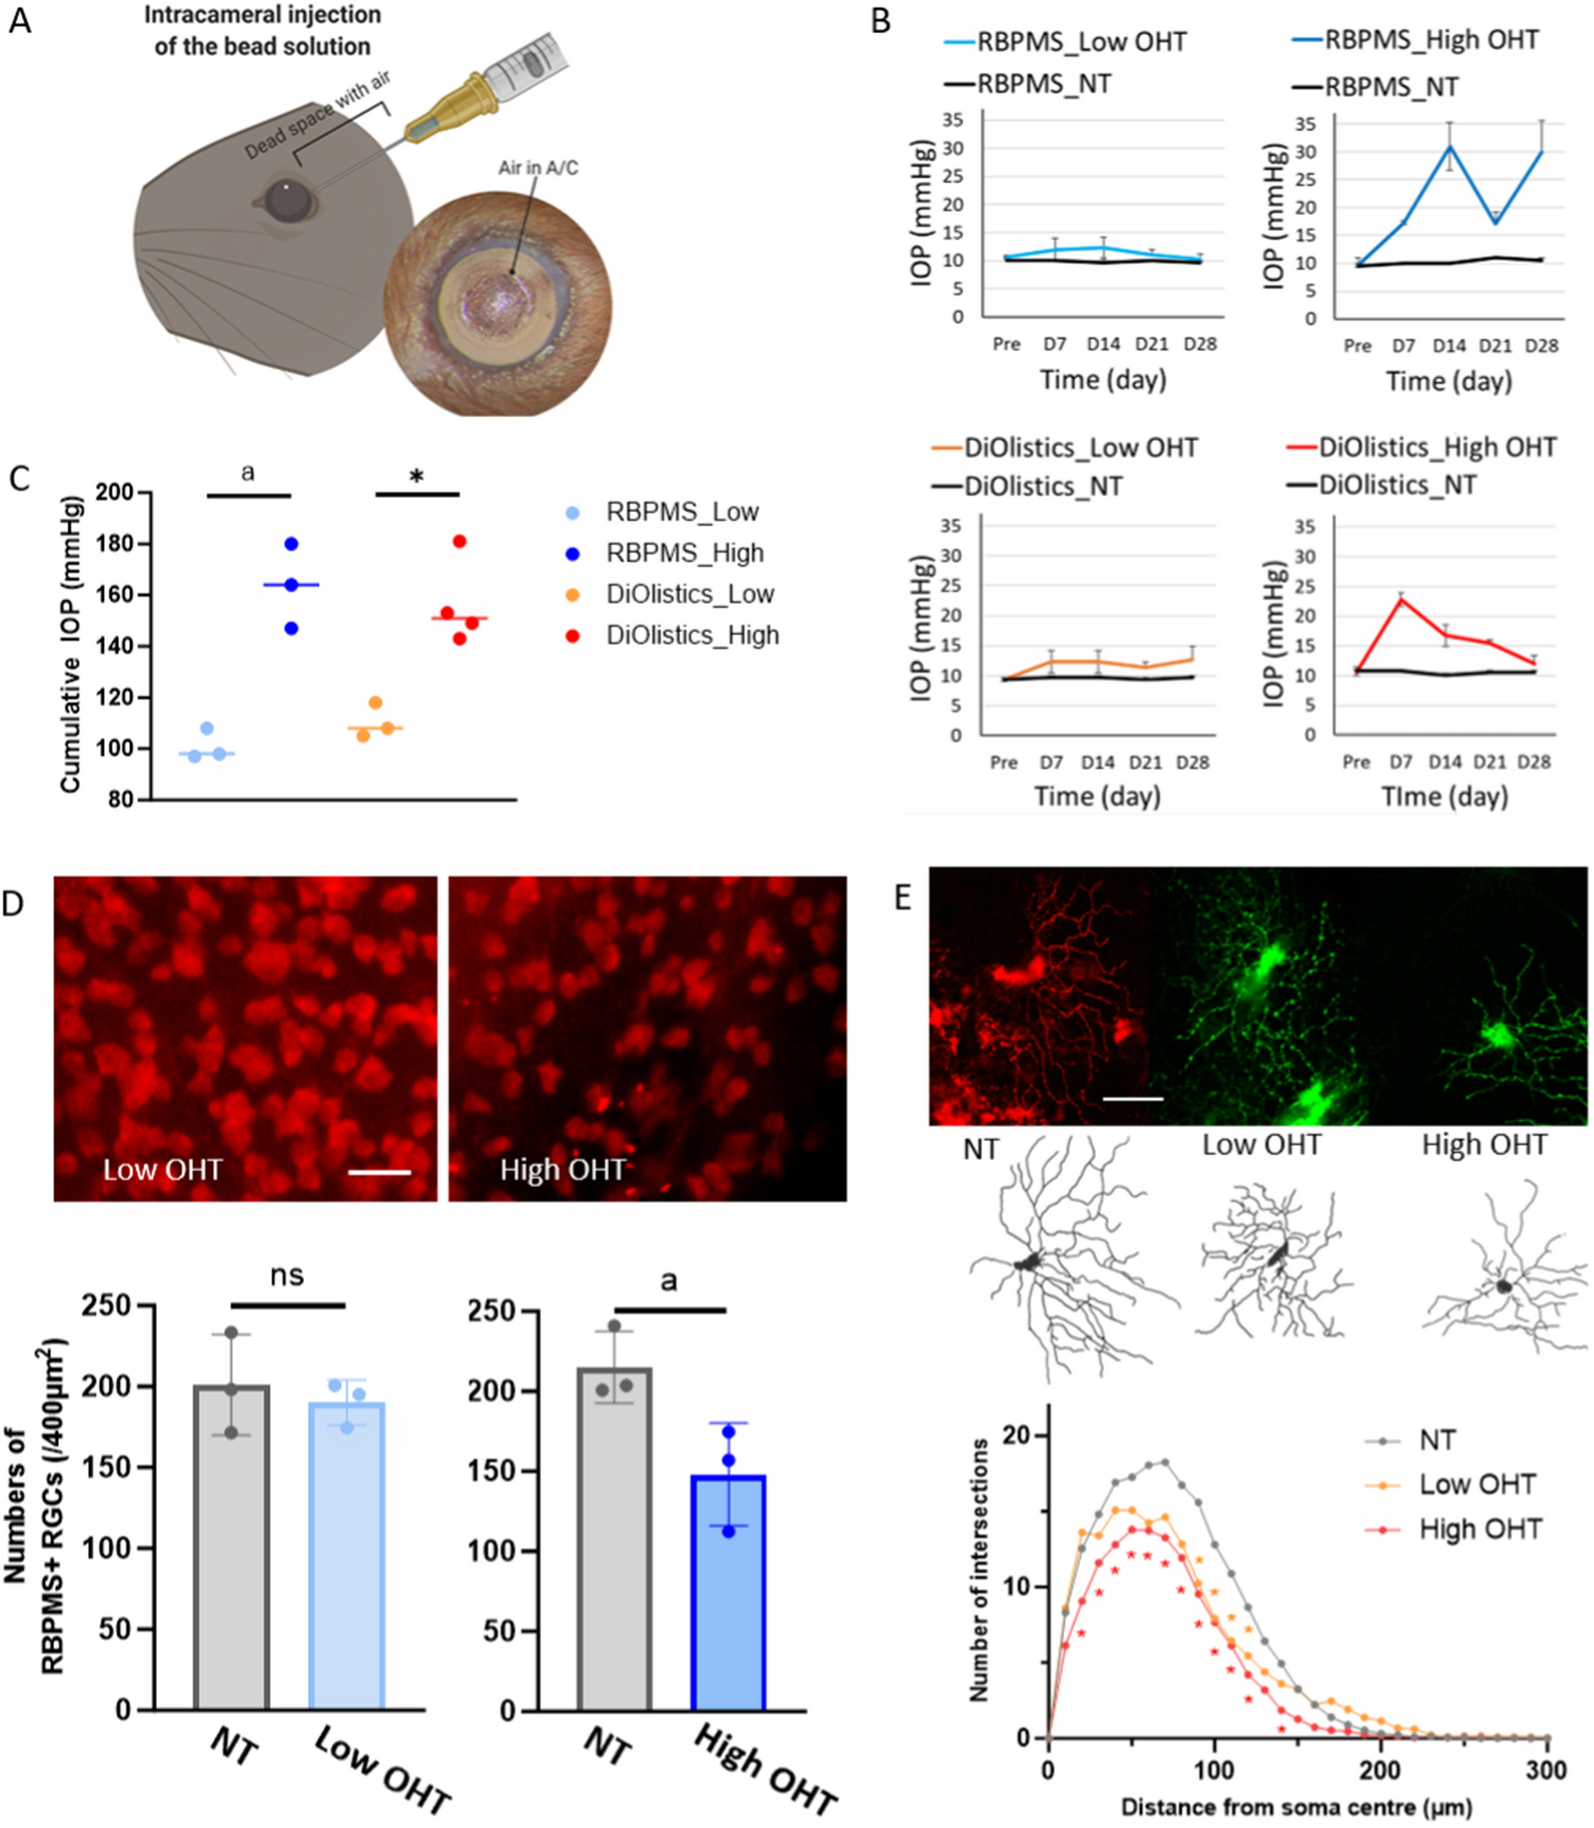
Ocular hypertension was induced in the 8-week-old C57BL/6J mice by injection of pharmaceutical-grade silicone oil (Alcon silikon 1000, Geneva, Switzerland) in the anterior chamber of both eyes, a model of chronic ocular hypertension that was established by Jie Zhang and colleagues [12, 57, 59]. For these experiments the volume of silicone oil was reduced to 1.2 µL to enable a slower onset of mild ocular hypertension induced retinal injury. Briefly, 8-week-old mice were anesthetized by an intraperitoneal injection of ketamine/xylazine (100 mg/kg and 10 mg/kg, respectively) (n = 40). One drop of topical anesthetic (proparacaine hydrochloride, 0.5%, Akorn, Lake Forest, IL) was applied to the cornea of both eyes before the injection. Silicone oil (1.2 µL) was injected into the anterior chamber of both eyes through a 30 G Hamilton glass syringe. After injection, a drop of antibiotic (tobramycin ophthalmic solution 0.3%) was placed on the eye. Sterile PBS (phosphate-buffered saline) was injected into another set of mice and used as a control. Mice were euthanized at 2, 4, and 8-week time points following injections for various experimental procedures.
IOP measurements/pupil dilation
IOPwas monitored once every 2 weeks until 8 weeks after silicone oil injection using the TonoLab tonometer (Colonial Medical Supply, Londonderry, NH). In this model, the pupil needs to be dilated sufficiently to expose it beyond the coverage of the silicone oil droplet, which leads to the reconnection of the front and back chambers of the eye [12]. Each measurement of IOP can be seen as a form of pupil dilation treatment. The dilation of the pupil was accomplished following the protocol outlined in the published literature [12, 57, 59].
Cell culture
Cultured primary human cortical astrocytes (HA1800) were purchased from ScienCell (Carlsbad, CA) and treated with the cytokines: IL-1α, TNF- α, and C1q for 24 h [20]. Astrocytes were treated with LXB4 (Cayman Chemicals, Ann Arbor, MI) (1 µM) or vehicle for 20 min before adding cytokines. After 24 h, the cells were collected in TRIzol (Invitrogen, Waltham, MA) for RNA isolation or ice-cold methanol for lipidomic analysis. For primary retinal astrocytes and optic nerve astrocytes, four mouse retinas were pooled and digested using papain (Worthington, Lakewood, NJ) and plated on poly-D-lysine coated flasks with astrocyte growth media (Lonza, Basel, Switzerland), changing the media every 3 days. Over 95% of the cultured cells were identified as astrocytes through immunofluorescence staining for GFAP and vimentin and were negative for RGCs, microglia, and oligodendrocyte markers.
Bulk RNA-seq
Total RNA from macaque optic nerves (n = 2) was extracted using a Direct-zol RNA Miniprep Kit with an on-column DNase treatment step as per the manufacturer’s instructions (Zymo Research, Irvine, CA). Isolated RNAs were eluted in nuclease-free water and submitted to QB3 Genomics, UC Berkeley, Berkeley, CA, for Bioanalyzer quality control analysis (Agilent, Santa Clara, CA). All submitted samples had an RNA integrity number (RIN) > 8. Sequencing libraries were prepared using the SMARTer v4 Ultra Low Input RNA Kit (Clontech, Mountain View, CA). The Diagenode Bioruptor Pico was utilized for cDNA fragmentation, and the KAPA Hyper Prep kit for DNA (Roche, Basel, Switzerland) was employed to generate libraries for sequencing on a NOVAseq S4 flow cell (Illumina, San Diego, CA). Library preparation and RNA-seq were performed at QB3 Genomics, UC Berkeley, Berkeley, CA, RRID: SCR_022170. The raw sequencing reads were demultiplexed by Illumina bcl2fastq2 software. RNA-seq data processing was performed as described here [37]. In brief, a quality check of FASTQ files was performed with FastQC v.0.11.9. Adapter sequences and low-quality bases with a Phred score of less than 30 were trimmed using Trim Galore! v.0.6.6. Trimmed reads were mapped on macaque genome version Mmul_10 (University of California Santa Cruz) with the STAR alignment tool v.2.7.1a using RefGene annotation. The total number of read counts mapped for each gene was extracted from BAM files using FeatureCount v.1.5.3. The count matrix was imported into Rstudio v.4.2.0. Raw count values were normalized using the Transcripts Per Million method by NormalizeTPM. Mean TPM values of normalized counts for genes of interest were plotted for visualization in Rstudio v.4.2.0.
Electroretinography
After an 8-week time point of silicone oil injection, the mice underwent overnight dark adaptation for ERG analysis. They were then anesthetized and received tropicamide (1%, Akorn, Lake Forest, IL) and phenylephrine (2.5%, Paragon BioTeck, Portland, OR) to dilate their pupils. The Celeris system (Diagnosys LLC, Lowell, MA) was used to conduct the ERG measurement, with stimulus intensities ranging from − 5.90 to 2.25 log cd.s/m2. The tail subdermal needle electrode served as ground. A positive scotopic threshold response (pSTR) elicited with an intensity of -2.50 log cd.s/m2 was used to represent RGC function (average of 20 repeats, interstimulus interval of 2 seconds).
Optical coherence tomography
Before imaging, at the 8-week time point of silicone oil injection, mice received anesthesia and were given lubricant eye drops. We used a Bioptigen spectral domain OCT system (Envisu R2300, Durham, NC) for imaging. Our previous studies described the OCT image acquisition and analysis protocols [31, 32]. We captured an en-face retinal fundus image with the optic nerve head in the center, using 1.8 × 1.8 mm rectangular scanning. Each replication involved 100 B-scan images (1536 A-scans for each B-scan). Retinal layer B-scan images were analyzed by masked observers using ImageJ software. We quantified the thickness of the retinal layer at both left and right locations from the center of the optic nerve head in each retinal quadrant. The average data from both locations represented the thickness value.
Retinal flat mount and RGC quantification
Eyes were removed at 8 weeks and fixed with 4% paraformaldehyde (PFA). Posterior eyecups were incubated overnight in a blocking buffer (10% normal donkey serum and 2% PBS-Triton-X-100). Eyecups were stained with primary antibodies, GFAP (Abcam, Cambridge, UK), and RBPMS (Phosphosolutions, Aurora, CO) (1:1000 dilution each) and were incubated on a shaker for 48–72 h at 4 °C. After incubation, eyecups were washed with 0.25% PBST and further incubated with either Alexa Fluor 488- or 594- conjugated secondary antibodies (Invitrogen; at 1:1000 dilution) under dark conditions for 2 h at room temperature. After washing with PBST, the retinas were gently detached, and four perpendicular clover cuts were made. ProLong™ Gold Antifade Mountant (#P36930, Invitrogen, Eugene, OR) was added to mount the retinas. Retinas were imaged on a Nikon Ti Eclipse microscope using a 20x objective. A minimum of 5–6 independent specimens (biological replicates) were analyzed for each flat mount. There was no observed RGC loss in the central region. To count peripheral RGCs, eight fields were sampled from the peripheral areas of each retina using a 20x lens on a Nikon Ti Eclipse microscope. (Supplementary Fig. 2 displays a flat-mounted retina that defines the central and peripheral regions). RGCs were counted using ImageJ software. The percentage of RGC survival was determined by calculating the ratio of surviving RGC numbers in the injured eyes compared to the control eyes. GFAP is expressed in all mature retinal astrocytes. However, GFAP expression can also be induced in reactive Muller glia. Astrocytes and Muller glia in the retina were differentiated based on their unique morphology and specific spatial localization on cross-sections.
Immunohistochemistry
The eyes were fixed in 4% PFA and transferred into 30% sucrose. Tissues were then embedded in OCT media and cut into 10-µm-thick sections using a CM1900 Cryostat (Leica, Wetzlar, Germany). Primary human astrocytes were fixed with 4% PFA for 20 min. The cells were permeabilized with 0.3% Triton®-X-100 PBS for 5 min at room temperature. Sections and cells were blocked using a blocking buffer (5% donkey serum in 0.3% Triton X-100 containing PBS) for 30 min. Primary antibodies against GFAP (Abcam), RBPMS (Phosphosolutions), LCN2 (Invitrogen), 5-LOX (Abcam), Pax2 (Abcam), Vimentin (Invitrogen), and CD44 (Proteintech) were added to blocking buffer and incubated overnight at 4 °C. Sections and cells were washed and incubated with Alexa Fluor 488- and 594- conjugated secondary antibodies (Invitrogen; at 1:1000 dilution) for double labeling for 2 h at room temperature under dark conditions. They were then washed and mounted using ProLong™ Gold Antifade Mountant, and images were captured using a Nikon Ti Eclipse microscope.
RNAscope in situ hybridization
RNA in situ hybridization for Alox5, Alox15, and Fpr2 mRNA was performed manually using RNAscope Multiplex Fluorescent Reagent Kit v2 Assay (Advanced Cell Diagnostics, Inc., Newark, CA) according to the manufacturer’s instructions. Briefly, 10 μm of PFA fixed frozen retina and optic nerve sections were pretreated with heat and protease (30 min, 40 °C) before hybridization with the target probes. Tissue was incubated in primary amplification probes and Opal™ 690 dye fluorophore (2-hour primary probe, 30 min AMP1, 30 min AMP2, 15 min AMP3, and 30 min fluorophore at 40 °C) and washed between steps with RNAscope washing buffer. Each sample was quality controlled for RNA integrity with an RNAscope® probe specific to PPIB RNA and for background with a probe specific to bacterial dapB RNA. Specific RNA staining signals were identified as red, punctate dots. The tissue was counterstained with DAPI. After mounting in ProLong™ Gold Antifade Mountant, images were acquired on a Nikon Ti Eclipse microscope using a 40x objective. The RNAscope probes used were as follows: Alox15 (Cat. No: 539,781-C1), Alox5 (Cat. No: 436,101-C2), and Fpr2 (Cat. No: 509,281-C3). Image analysis was performed using the QuPath open-source software developed by Edinburgh University [3].
qPCR
RNA was isolated from mouse retinal tissue and human brain astrocytes and quantified according to our published protocol [33]. Gapdh was used as the reference gene. The mouse primers used in this study are listed in Table 1. Primers for the human genes used in this study are listed in Table 2 (please refer to supplementary material for primer details).
Liquid chromatography-tandem mass spectrometry (LC‒MS/MS)
Mouse retinas and macaque optic nerves were immediately snapped, frozen on dry ice, and stored at − 80 °C before processing for lipidomic analyses. Eicosanoids and PUFAs in the cells and conditioned media from astrocyte cultures were identified and quantified by LC‒MS/MS according to our published protocol [33, 52]. Briefly, deuterated internal standards (leukotriene B4-d4, prostaglandin E2-d4, 5-HETE-d8, LXA4-d5, AA-d8, docosahexaenoic acid-d5) were added to all samples before processing to calculate class-specific recoveries. Frozen tissues were placed in MeOH and processed in a refrigerated beat homogenizer. Supernatants were extracted using C18 solid-phase columns. Extracted lipids were analyzed by a triple-quadrupole linear ion trap LC‒MS/MS system using an AB SCIEX 4500 QTRAP mass spectrometer equipped with a Kinetex C18 mini-bore column. The mobile phase was a gradient of A [water/acetonitrile/acetic acid (72:28:0.01, v: v:v)] and B [isopropanol/acetonitrile (60:40, v: v)] with a 450 µl/min flow rate. MS/MS analyses were conducted in negative ion mode. PUFA and PUFA lipoxygenase metabolites were quantitated by scheduled multiple reaction monitoring (MRM mode) using established transitions for arachidonic acid (AA; 303→259 m/z), 5-hydroxyeicosatetraenoic acid (5-HETE; 319→115 m/z), 15-HETE (319→175 m/z), 12-HETE (319→179 m/z), LXA4 (351→115 m/z), LXB4 (351→221 m/z), DHA (327→283 m/z), and 4-hydroxy DHA (4-HDHA; 343→101 m/z) [22]. Peak identification and integration criteria were a signal-to-noise ratio above 5:1, matching retention with synthetic standards, the retention time of class-specific deuterated internal standards, and analyte-specific diagnostic ions. For quantification, calibration curves (1 to 1000 pg) and HPLC retention times for each analyte were established with synthetic standards (Cayman Chemicals). Results were normalized to class-specific deuterated standard recovery and tissue weights in pg or ng or no. of cells. Structures were confirmed for selected autacoids by MS/MS analyses using either enhanced product ion mode (EPI) or the presence of 4–6 diagnostic ions in the multiple reaction monitoring mode (MRM).
Statistical analysis
All values are presented as the mean ± standard error of the mean (SEM) of n observations, where n represents the number of animals studied or independent in vitro experiments. Statistical analysis was performed using GraphPad Prism 9.0 (GraphPad Software, San Diego, CA). One-way ANOVA followed by post hoc Tukey’s multiple comparison test or unpaired Student’s t-test was used to compare intergroup differences. The results were considered statistically significant when P < 0.05. We confirmed that standard deviations are equal for all groups (Bartlett’s test requires n > 5) and that the data follows a normal distribution (Kolmogorov-Smirnov test).


留言 (0)