
記住我
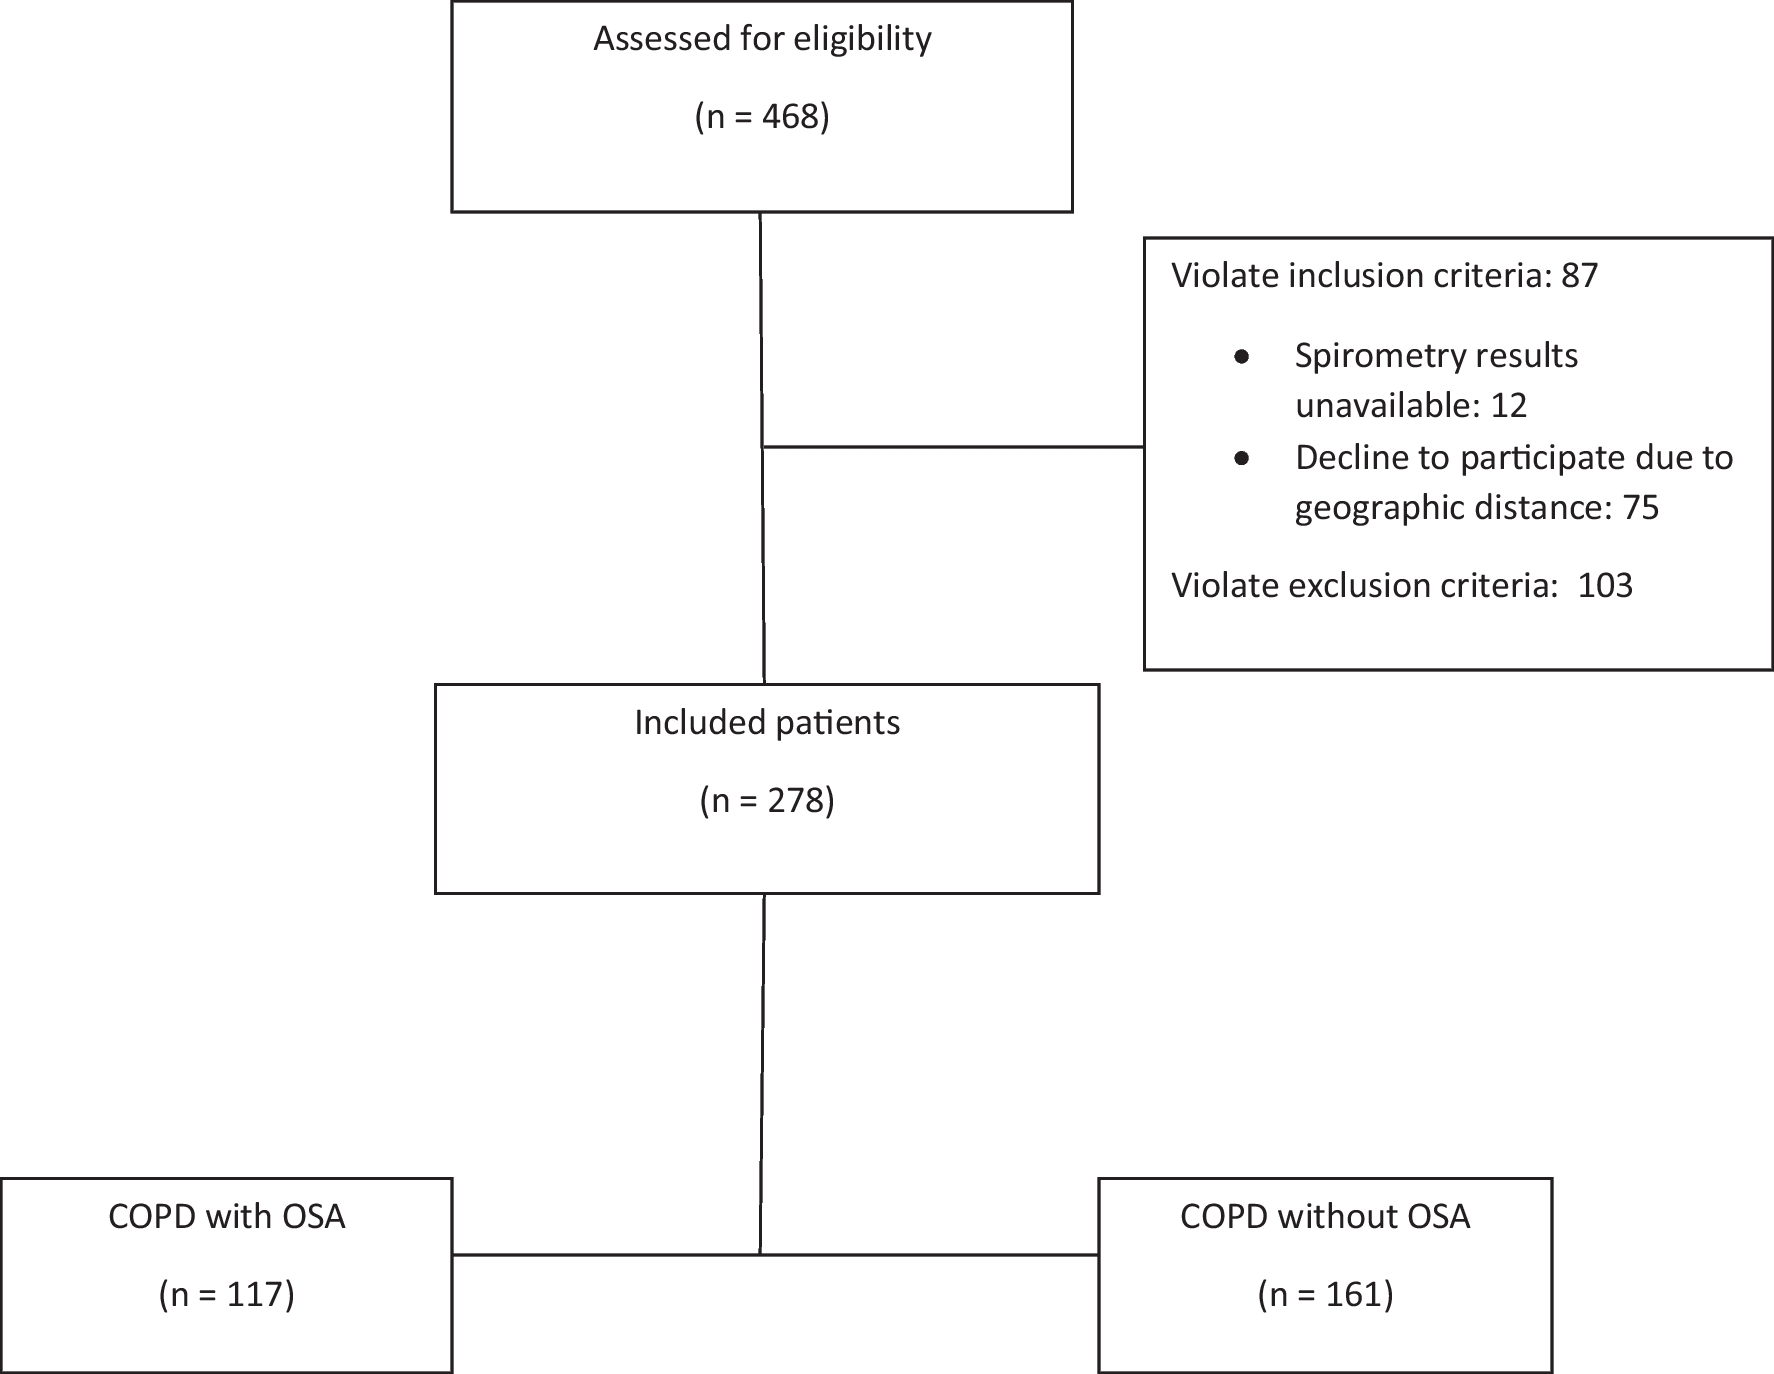


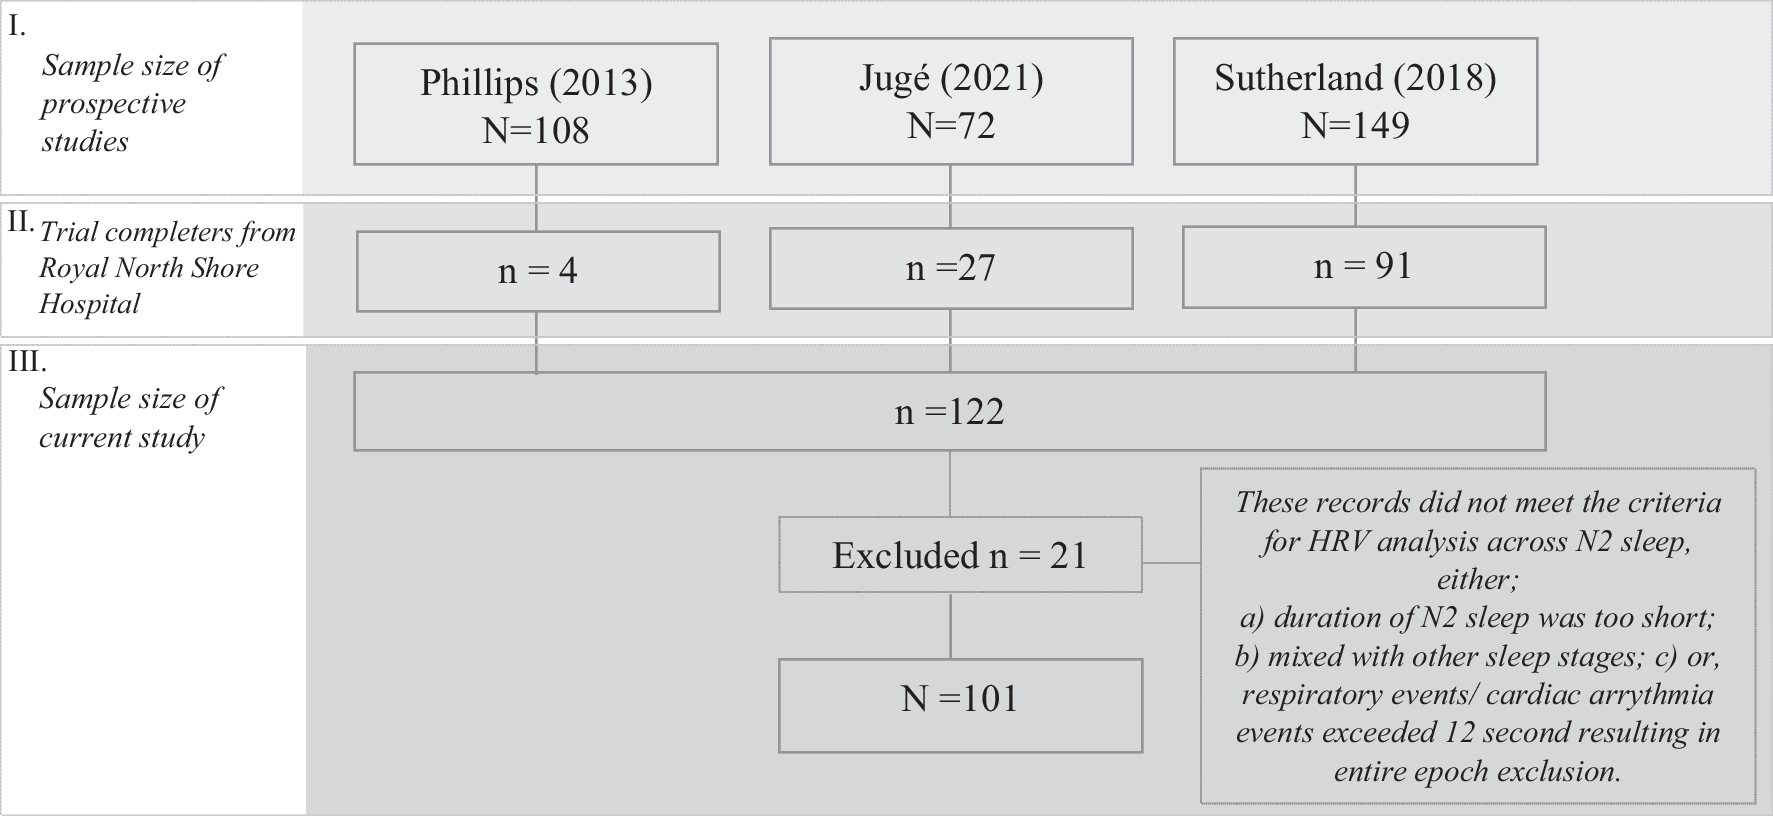
This study utilized data from three prospective MAS therapy research studies conducted at the Sleep Investigation Laboratory, Royal North Shore Hospital. Adult participants (age ≥ 18 years) diagnosed with OSA (AHI ≥ 10/h) and treated with MAS were included in the current analysis (Fig. 1). These studies collected baseline polysomnography (PSG) upon initial visit to the clinic, and this was followed by a treatment PSG with MAS after at least one month of MAS therapy [4, 12, 13]. Sutherland et al. [12] used this data to derive multimodal phenotypes to predict treatment response in patients using MAS. Phillips [4] performed a randomized controlled trial (RCT) comparing health outcomes of MAS and CPAP treatment. Jugé [13] used imaging techniques to characterize whether inspiratory tongue movement is associated with MAS treatment outcomes. Study characteristics and outcomes were compared across these three datasets and are presented in the Supplementary Material (Supplementary Tables 1–2). In all studies, dental eligibility was assessed by a dentist, and exclusion criteria were limited to contraindications to MAS therapy i.e. periodontal disease, temporomandibular joint diseases, active upper airway infection, and insufficient teeth.
Fig. 1
We used the same MAS design for all studies — a titratable, custom-fitted two-piece device (SomnoMed Ltd., based in Sydney, Australia). Participants incrementally adjusted the MAS to the point of maximum comfortable mandibular advancement, as a means of self-titration and titration degree, with the titration degree confirmed by a dental specialist to ensure the correct adjustment. All studies were approved by Institutional Human Research Ethics Committees, and informed consent was obtained from all participants before the trials commenced.
For the present study, the participants included patients of varying response to treatment. Study characteristics and outcomes for different response groups were compared and presented in the Supplementary Material (Supplementary Table 3–4).
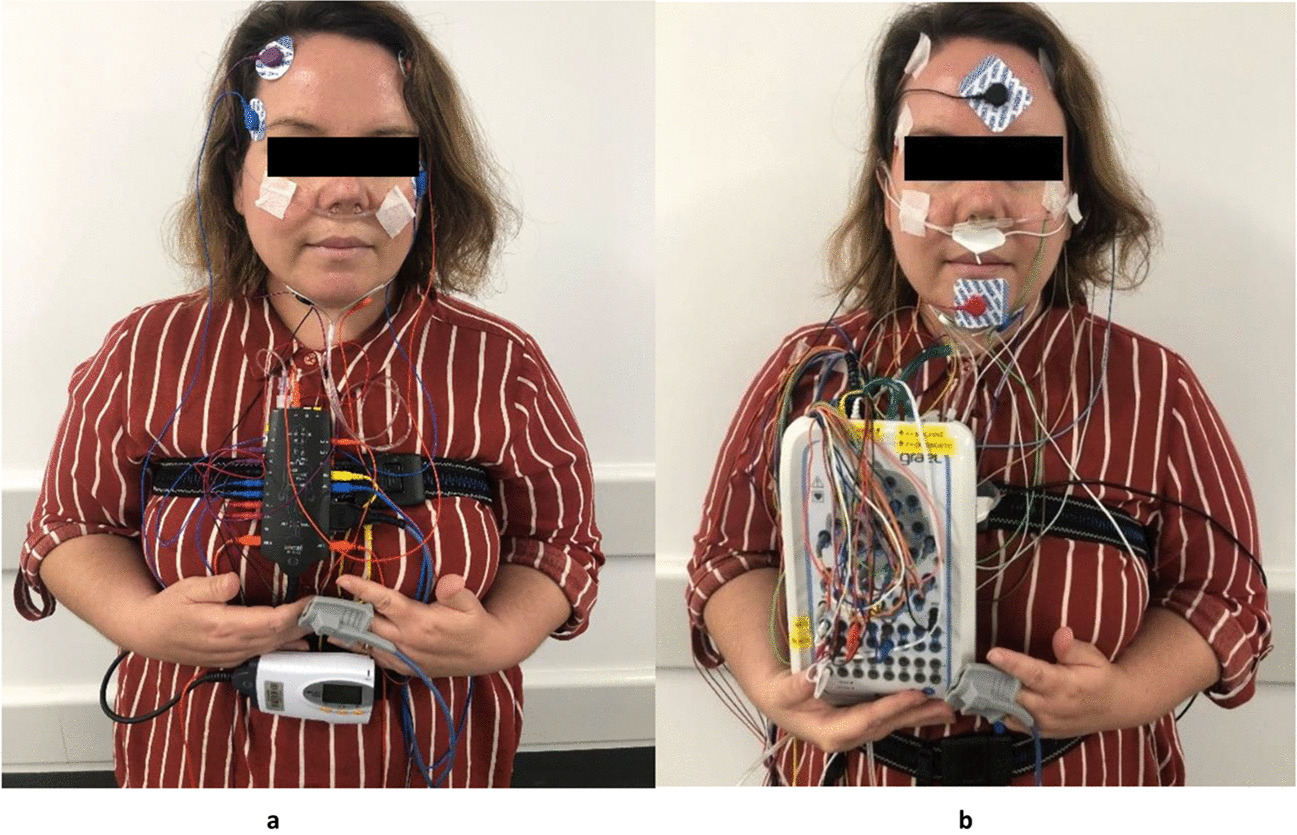
PolysomnographyDuring full night PSG, standard channels were utilized to record physiological parameters, including electrooculography (EOG), chin electromyography (EMG), nasal airflow pressure via nasal cannula, thoracic and abdominal respiratory effort, finger pulse oximetry to measure oxygen saturation (SpO2%), body position, and leg electromyography. Trained sleep scientists scored each recording according to the guidelines set by the American Academy of Sleep Medicine [14].
Holter monitor processingAs part of in-laboratory PSG, electrocardiogram (ECG) data was collected using three electrodes placed in the standard lead II configuration. The ECG signals were extracted from the polysomnograms and analysed using commercially available Holter software for QRS detection, ectopic beat detection, and labelling (Sentinel Holter Data Management System v11.5.1, Spacelabs Healthcare, Issaquah, WA, USA). QRS detection was performed with a resolution of 1 ms.
Heart rate variabilityHRV analysis was performed on ECG recordings in accordance with standard guidelines [10] using HRV algorithms implemented in signal processing software (MATLAB 2017, version 9.2.0.538062 (R2017a), Mathworks, Natick, Massachusetts). HRV parameters were calculated using 2-min epochs, shifted by 30 s, across the entire ECG signal, and then averaged across segments of N2 sleep (stage 2 non-rapid eye movement). N2 sleep is the preferred stage for nocturnal HRV analysis due to its relative stability, as it is primarily controlled by the parasympathetic nervous system and has fewer arousals that may impact the sensitivity of HRV measures [15]. Epochs with mixed sleep stages and ECG sections associated with respiratory events or cardiac arrhythmia (including atrial and ventricular ectopic beats) were excluded from HRV analysis. If the total exclusion period exceeded 12 s (10% of epoch length), the entire epoch was excluded [16].
Time — domain measuresThe time domain HRV metrics employed in the analysis were (1) Average NN interval (2) SDNN, standard deviation of NN intervals, utilized as a measure of global HRV, (3) RMSSD, which is the square root of the mean squared differences of successive NN intervals, and (4) pNN50, the percentage of absolute differences in successive NN values greater than 50 ms (Table 1). RMSSD and pNN50 are short-term measures that are strongly associated with high-frequency oscillations and reflect parasympathetic modulation of the heart [10].
Table 1 Description of time and frequency domain HRV measures. Frequency — domain measuresFrequency-domain HRV parameters were calculated using the Lomb periodogram on the preprocessed data. Total power (TP, ms2) was defined as the power between 0.04 and 0.4 Hz and is associated with global HRV changes. Absolute power within the low frequency band (0.04–0.15 Hz; LF, ms2) reflects sympathetic cardiac modulation with a vagal component (Table 1), while absolute power within the high frequency band reflects vagal cardiac autonomic control (0.15–0.40 Hz; HF, ms2. Normalized values LFnu and HFnu are associated with sympathetic and parasympathetic activity, respectively [10]. The ratio between these indices (LF: HF) represent sympathovagal balance [10].
Statistical analysisMean and standard deviation (SD) were presented for continuous variables. Paired t-tests were utilized to compare polysomnographic characteristics and HRV markers before and after MAS treatment. Normality was evaluated using the Shapiro–Wilk test, and distribution plots were visually examined. Wilcoxon signed rank test was used for pairwise comparisons of nonparametric continuous data.
To investigate whether the responsiveness to MAS treatment influenced the changes in HRV, regression analyses were conducted for the change in HRV markers (∆HRV) (outcome variable) against treatment duration (predictor), and against treatment duration and change in AHI (∆AHI) (predictors). Treatment duration was calculated as the amount of time, in months, between the PSG collected at baseline and with treatment. The change (\(\Delta\)) was calculated using the following formula: \(\Delta = T-B\) where \(T\) referred to treatment outcomes and \(B\) indicated baseline outcomes. The p value was adjusted for multiple comparisons using Bonferroni correction; therefore, significance is denoted as p values less than 0.005 (10 comparators). Subgroup analyses were also performed comparing clinical and HRV outcomes between (1) all three data sources, (2) treatment response groups, and (3) treatment duration groups (Supplementary Tables 1 – 5). All data analyses were performed using SPSS software (version 24; SPSS Inc., Chicago, IL).
留言 (0)