
記住我
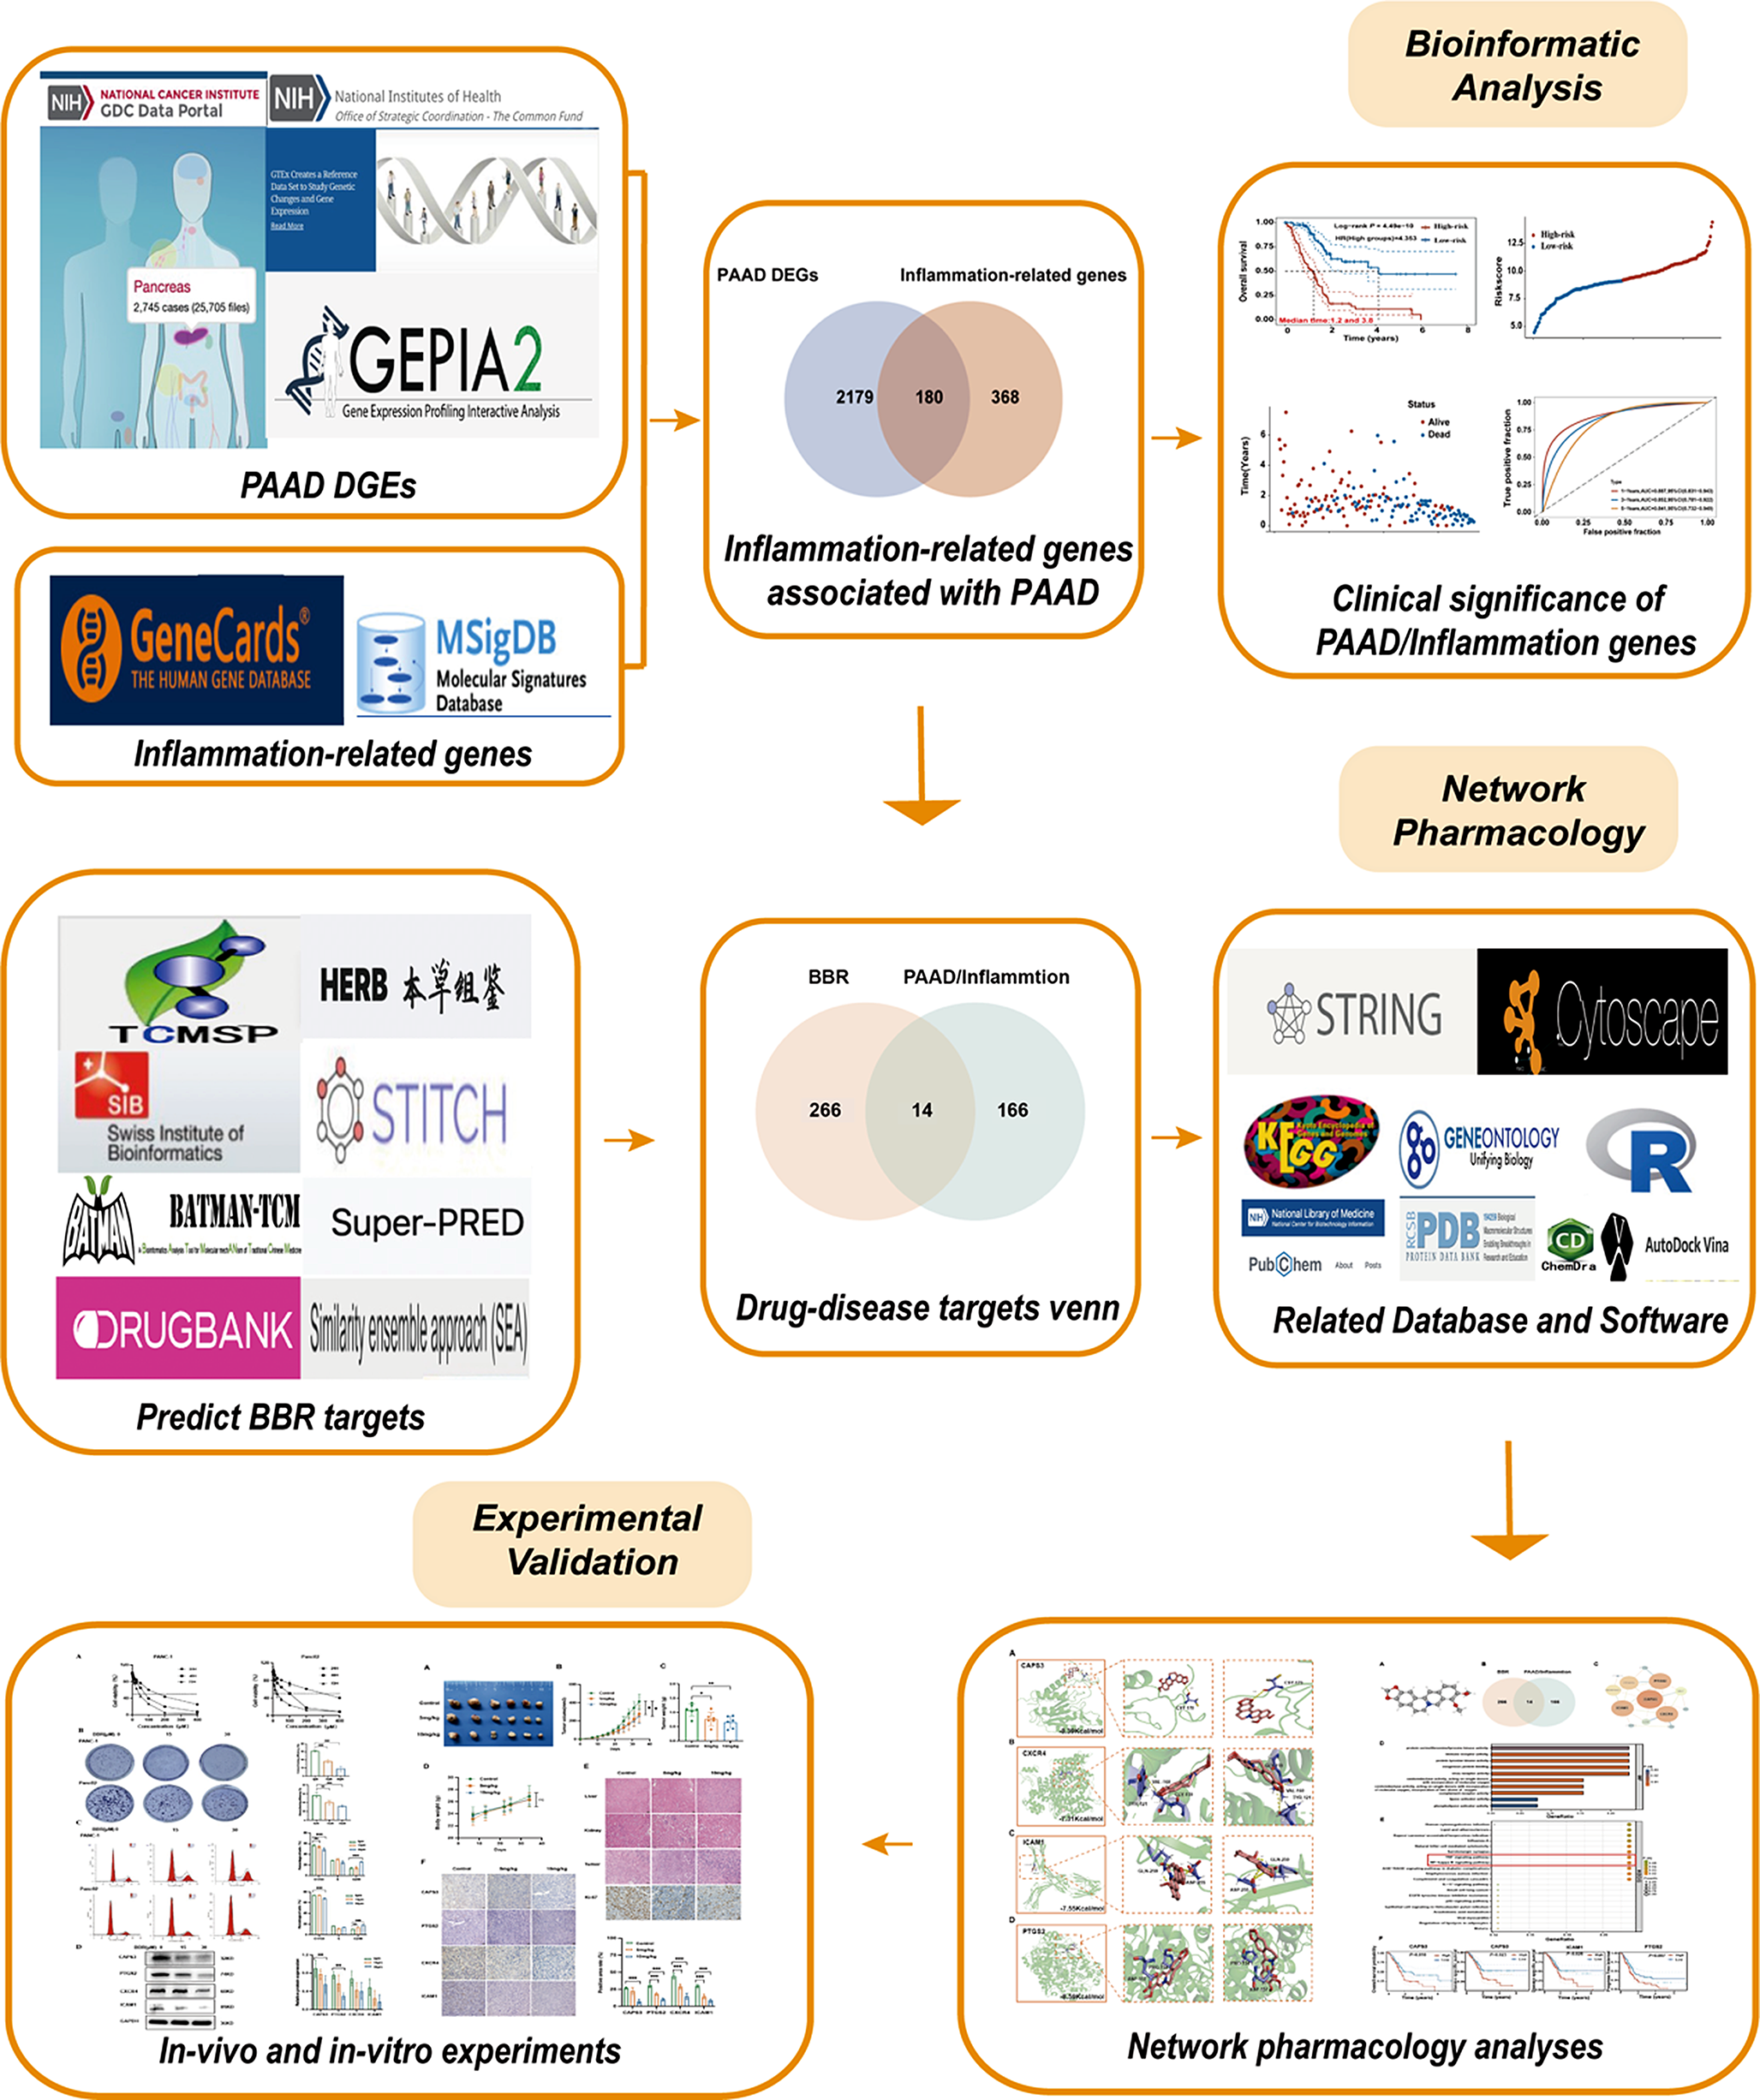
First, 2359 DEGs in PAAD were obtained from TCGA and GTEx databases using GEPIA2. Additionally, 200 and 390 inflammation-related genes were obtained from the MSigDB and Genecards databases, respectively. All inflammation-related genes are listed in Supplementary Table 1. One hundred and eighty inflammation-related genes in PAAD were identified by comparing these two gene clusters (Fig. 2A). Then we observed that 174 genes were upregulated and six were downregulated in PAAD by examining the differential expression of the intersecting genes (Fig. 2B). Subsequently, 58 inflammation-related genes correlated with PAAD OS were identified as prognostic indicators by univariate Cox analysis (Fig. 2C, Supplementary Table 2). Multifactorial Cox regression analysis were used to construct prognostic models for identifying genes significantly associated with the prognosis of patients with PAAD. The risk scores are presented in Supplementary Table 3. According to the median cut-off value, patients were divided into high- and low-risk groups and survival analysis showed that high-risk patients had a significantly poorer survival than their low-risk counterparts (Fig. 2E); a gradual increase in deaths with increasing risk scores as showed in the risk curves and scatter plots (Fig. 2D and F). The sensitivity and specificity of the prediction model were analyzed by generating the time-dependent ROC curves; the area under the curve reached 0.887, 0.852, and 0.841 at 1, 3, and 5 years, respectively (Fig. 2G), indicating the high reliability of the model. Additionally, the prognostic genes expression profiles were displayed (Fig. 2H). These results suggested that inflammation-related genes are closely associated with PAAD prognosis and may provide new therapeutic targets for PAAD.
Fig. 2
Prognostic significance of PAAD/inflammation. (A) Venn diagram to identify the inflammation- related genes in PAAD. (B) Volcano-plot representation of differential inflammation-related genes expression in PAAD. (C) Venn diagram to identify the prognostic genes in PAAD/inflammation. (D) Curve of risk score for the high- and low-risk groups. (E) Kaplan–Meier curves for OS of patients in high- and low-risk groups. (F) Scatter plot indicated the survival status of the high- and low-risk groups. (G) Time-dependent ROC analysis the prognostic-gene signature. (H) Heatmap showing expression profiles of the prognostic genes. P < 0.05 indicates significance. PAAD, pancreatic adenocarcinoma; BBR, berberine; DEGs, differentially expressed genes; AUC, the area under the curve; CI, confidence interval; ROC, receiver operating characteristic
Functional analysis of targets underlying BBR inhibition of PAAD/InflammationThe 3D structure of BBR is shown in Fig. 3A. Two-hundred-eighty BBR pharmacological targets were obtained from multiple databases, as described in the Methods section, and 14 intersecting genes were identified after an overlap of inflammation-related genes in PAAD with BBR-associated pharmacological targets (Fig. 3B). Protein–protein interaction (PPI) networks were illustrated using STRING, and then input the mapped intersecting proteins into the Cytoscape software to calculate the topological parameters, four key targets were highlighted: caspase 3 (CAPS3), Prostaglandin-Endoperoxide Synthase 2 (PTGS2), Intercellular Adhesion Molecule 1 (ICAM1), and C-X-C Motif Chemokine Receptor 4 (CXCR4) (Fig. 3C). Survival analysis revealed differences in OS, progression-free interval, and disease-specific survival between the high- and low-expression groups for the four key targets (Fig. 3D, P < 0.05).
Fig. 3
Functional analysis of targets that BBR inhibits in PAAD/inflammation. (A) 3D structure of Berberine. (B) Venn diagram of 14 overlapping targets for PAAD/inflammation and BBR. (C) PPI analysis screening for key targets-CAPS3, CXCR4, ICAM1, and PTGS2. (D) Survival analysis revealed differences in OS, PFI, and DSS according to the optimal cut-off expression value. (E) GO analysis of targets of BBR and PAAD/inflammation based on MF, which were mainly enriched in oxidoreductase activity and immune receptor activity. (F) KEGG analysis of top 20 pathways, including NF-kappa B signaling pathway and TNF signaling pathway. (G) Drug–target–pathway–disease network. P < 0.05 indicates significance; PAAD, pancreatic adenocarcinoma, BBR, berberine, GO-MF, gene ontology-molecular function; KEGG, Kyoto Encyclopedia of Genes and Genomes; OS, overall survival; PFI, progress free interval; DSS, disease specific survival; PPI, protein–protein interaction
Subsequently, the 14 intersecting genes were subjected to GO enrichment analyses, which indicated that BBR affects a series of molecular functions, cellular components, and biological processes, including response to lipopolysaccharide, response to molecules of bacterial origin, cellular response to drugs, response to oxygen levels, reproductive structure development, reproductive system development, response to oxidative stress, virus receptor activity, hijacked molecular function, protein tyrosine kinase activity, and protein phosphatase binding (Fig. 3E and S1). Additionally, 24 pathways related to all core targets were found in KEGG pathway analysis (P-adjust < 0.05), which included the nuclear factor kappa-B (NF-κB) signaling pathway, TNF signaling pathway, staphylococcus aureus infection, human cytomegalovirus infection, microRNAs in cancer, serotonergic synapse, natural killer cell mediated cytotoxicity, Influenza A, and kaposi sarcoma-associated herpesvirus infection (Fig. 3F). Figure 3G showed the drug–target–pathway–disease network.
Molecular docking simulationMolecular docking analysis was performed to determine the possible binding of BBR to the identified key targets. The crystal structures of the four targets, CAPS3 (PDB ID 1NME), PTGS2 (PDB ID 5IKV), ICAM1 (PDB ID 1P53), and CXCR4 (PDB ID 3OE9), were retrieved from the PDB database for docking stimulation against BBR. Binding energies below zero indicated that the two molecules bound spontaneously, with smaller binding energies leading to a more stable conformation [16]. The results showed that the four key targets docked well with BBR; the structures and binding sites are shown in Fig. 4.
Fig. 4
Molecular docking simulation and visualization of BBR binding with key targets, CAPS3, CXCR4, ICAM1, and PTGS2. (A) Sites of BBR binding with CAPS3 (binding energy − 8.39 Kcal/mol, hydrogen bond formed on CSY-170). (B) Sites of BBR binding with CXCR4 (binding energy − 7.31 Kcal/mol, hydrogen bond formed on TYR-121, VAL-120, and GLY-159). (C) Sites of BBR binding with ICAM1 (binding energy − 7.55 Kcal/mol, hydrogen bond formed on ASP-255 and GLN-259). (D) Sites of BBR binding with PTGS2 (binding energy − 8.59 Kcal/mol, hydrogen bond formed on PRO-154 and ASP-157). BBR, berberine
BBR suppressed PAAD cell proliferation in vitroWe further verified the inhibitory effects of BBR on PAAD cells in vitro. The cell viability, determined using the CCK8 assay, showed that after intervention for 24, 48, and 72 h, the PANC-1 cells respective IC50 values were 146.1 µM, 68.89 µM, and 36.63 µM, and the Panc02 cells respective IC50 values were 284.7 µM, 73.75 µM, and 22.33 µM, means that BBR inhibited PAAD cells dose-dependently and time-dependently (Fig. 5A). Results of the colony formation assay suggested that as the drug concentration increased, the colony formation ability was considerably inhibited (Fig. 5B). Subsequently, we investigated whether BBR had an effect on cell cycle arrest in PAAD cells; after incubation with 0, 15, and 30 µM BBR for 48 h, the results showed that the percentage of G2/M phase cells increased from 14.19 ± 1.24% to 25.71 ± 0.93% in PANC-1 and from 10.59 ± 0.069% to 18.09 ± 0.39% in Panc02 cells (Fig. 5C). These results suggest that in vitro BBR inhibited PAAD cell proliferation and induced cell cycle arrest.
Fig. 5
BBR suppressed PAAD proliferation in vitro. (A) Cell viability assays after intervention of BBR. (B) Cell clonogenicity assays after intervention of BBR. (C) Cell cycle analysis after intervention of BBR. (D) The key protein expression after intervention of BBR. BBR, berberine; PAAD, pancreatic adenocarcinoma. P < 0.05 indicates significance: *P < 0.05, ** P < 0.01, ***P < 0.001 when compared with the control group; # P < 0.05, ## P < 0.01 and ### P < 0.001 when compared with the 5 µM group
BBR suppressed PAAD growth in vivoA pancreatic subcutaneous tumor model was established to investigate whether BBR inhibits PAAD in vivo. Different doses of BBR were injected intraperitoneally for 28 days. The results show that compared with the control group, BBR significantly reduced tumor volume, tumor growth rate, and tumor weight (Fig. 6A–C, P < 0.05). Higher proportion of Ki-67-positive cells were observed in the control group than in the BBR treat group, indicating that BBR suppressed the proliferative activity of the tumor (Fig. 6E). Furthermore, there was no significant decrease in mice body weight (Fig. 6D, P > 0.05) or pathological changes upon histological examination of the liver or kidneys (Fig. 6E) after BBR intervention. Taken together, our results suggest that BBR suppresses tumor growth in mouse PAAD models.
Fig. 6
BBR inhibits pancreatic tumor growth in vivo. (A) Tumors in different groups of mice (n = 6). (B) Tumor growth curve. (C) Tumor weights between different groups. (D) Changes in mouse body weight. (E) Representative images of HE staining in the liver, kidney, and tumor tissues (HE, 100×, 200×), and Ki-67 (IHC, 200×). (F). Immunohistochemistry analysis and statistical analysis of the effects of BBR on CAPS3, PTGS2, CXCR4, and ICAM1 expression (IHC, 200×). BBR, berberine; HE, hematoxylin and eosin; IHC, immunohistochemistry; P < 0.05 indicates significance: *P < 0.05, ** P < 0.01, ***P < 0.001 when compared with the control group; # P < 0.05, ## P < 0.01 and ### P < 0.001 when compared with the 5 mg/kg group
BBR suppressed inflammation-related gene protein expressionNext, we verified whether BBR inhibited PAAD via the four key targets. IHC results demonstrated that, treatment with 5 and 10 mg/kg of BBR significantly suppressed the protein expression of the four candidate targets in vivo compared with the control group (Fig. 6F, P < 0.01). Meanwhile, western blotting results showed that the four candidate targets protein expression were reduced after treatment with different does of BBR, among which CAPS3 and PTGS2 were significant in vitro (Fig. 5D). These results demonstrated that BBR inhibits PAAD may be associated with suppress the inflammation-related genes.
留言 (0)