Animal ethics
Animals used are under the protocols approved by the University of British Columbia (UBC), Animal Care Committee, and conformed to the guidelines of the Canadian Council on Animal Care, in accordance with the Resolution on the Use of Animals in Research of the Association of Research in Vision and Ophthalmology. Laboratory mice C57BL/6 J (WT) and GzmB−/− mice with C57BL/6 J background were obtained from Jackson Laboratory (Bar Harbor, ME, USA).
Human ethics
Human donor eyes, consented for research, were obtained from the Eye Bank of British Columbia (Canada) and were approved by the UBC Clinical Ethics Research Board and strictly adhered to the Declaration of Helsinki.
Ocular tissue processing
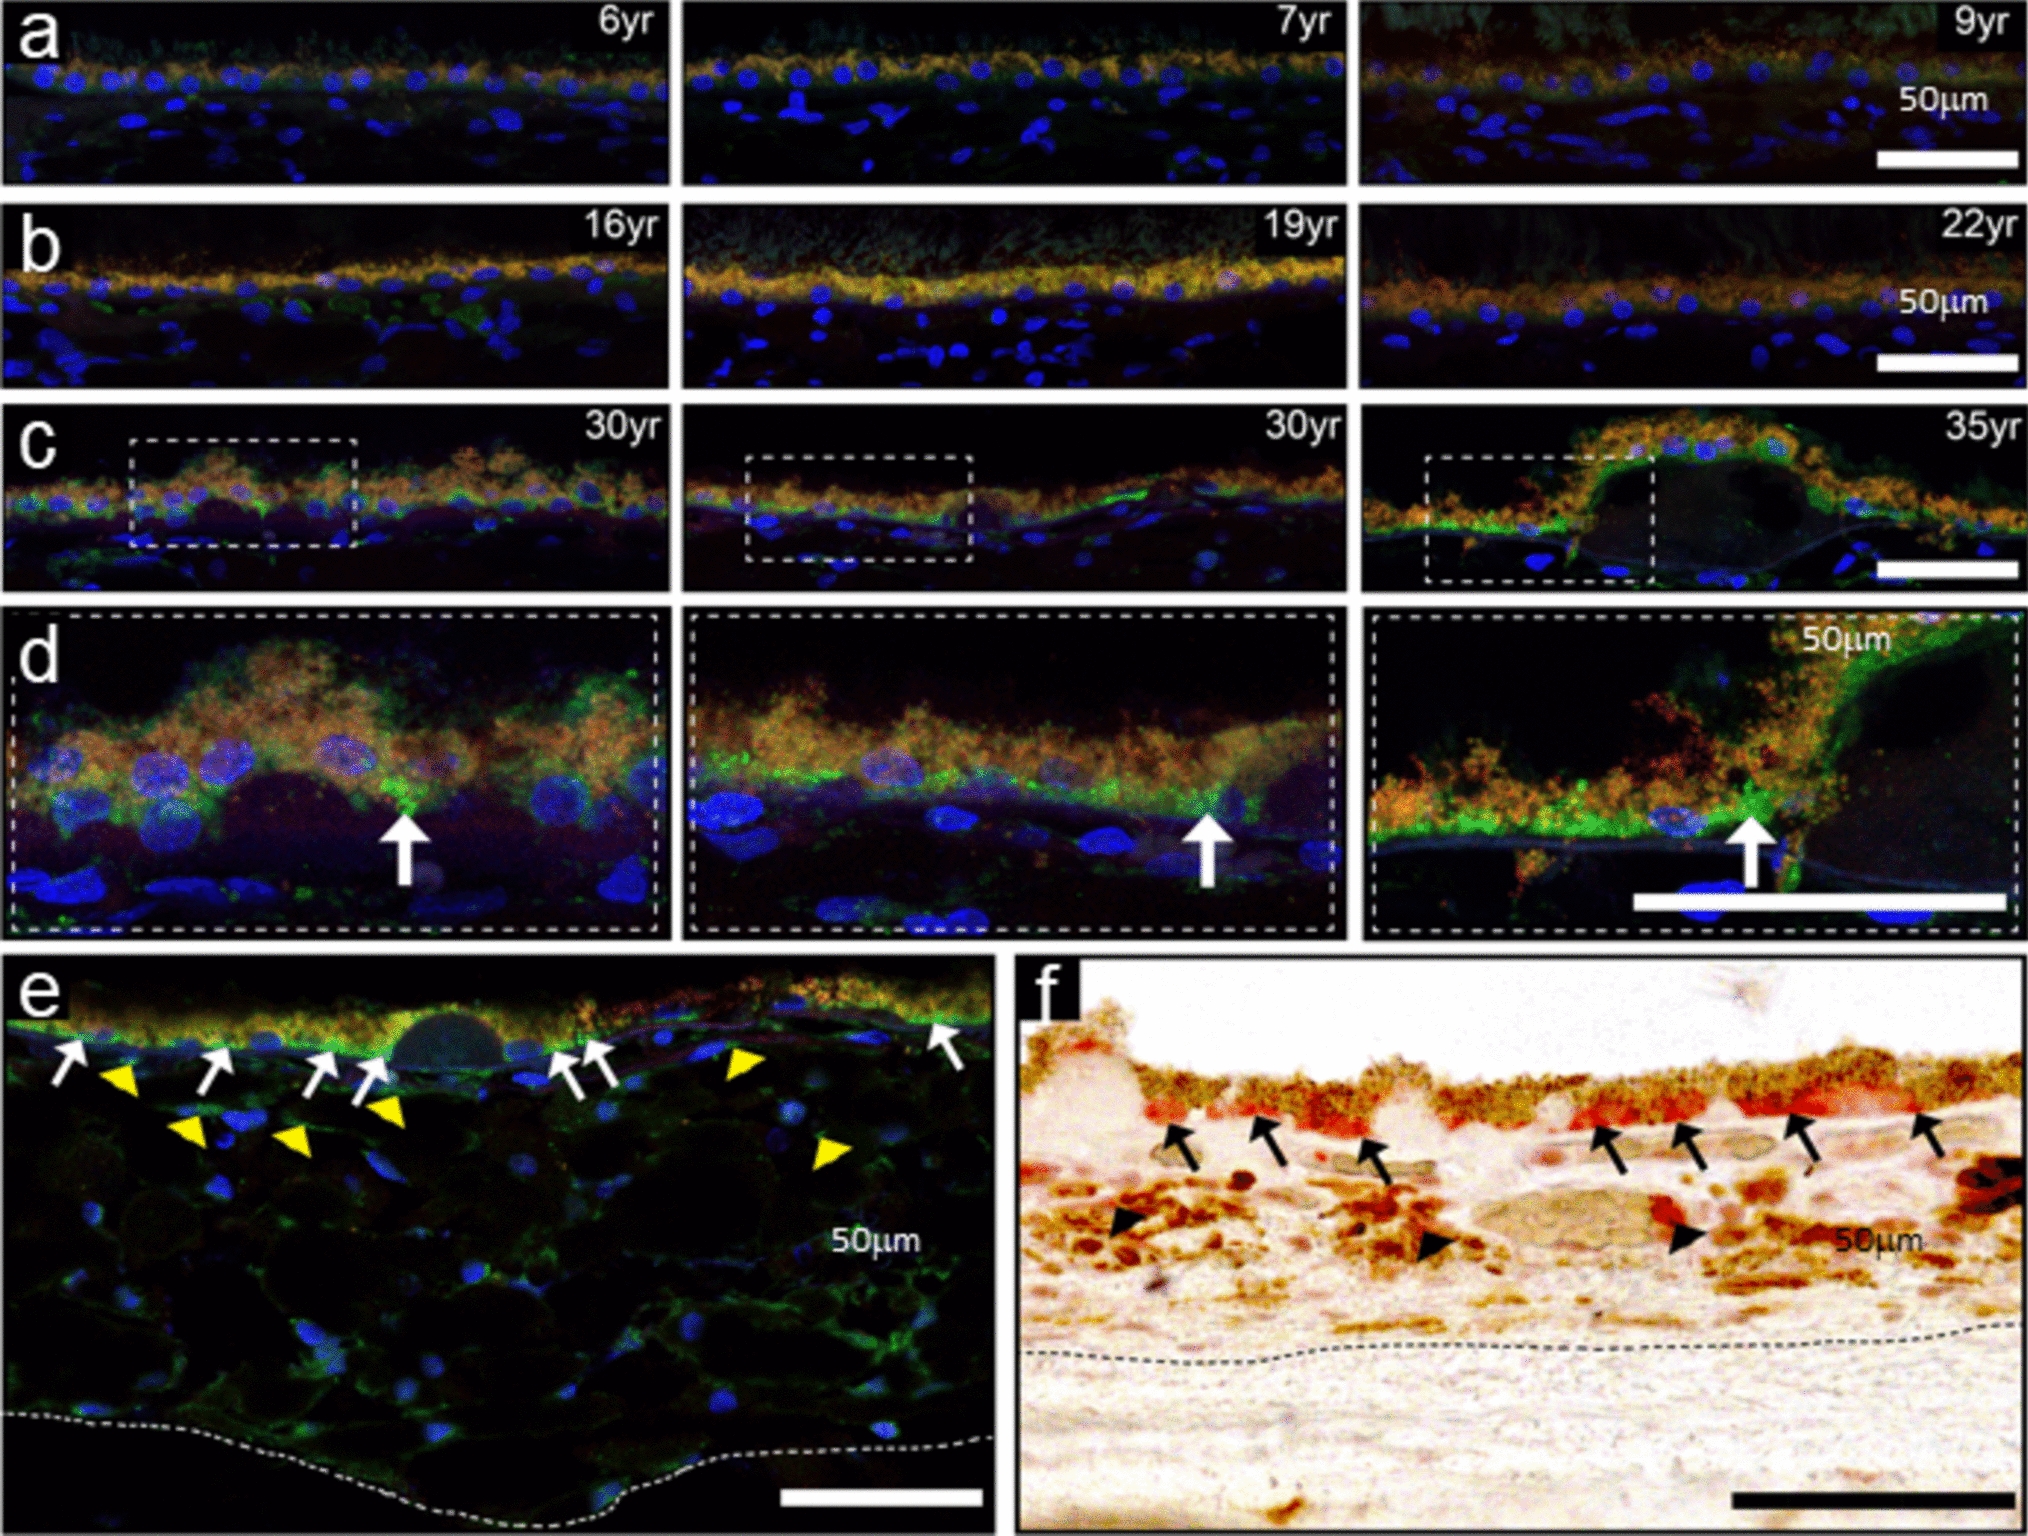
Macaque, human and mouse whole globes were fixed in 10% buffered formalin or 4% paraformaldehyde, then embedded in paraffin for 6–10 µm sagittal sections. Tissue sections were mounted onto glass slides and deparaffinized using a series of alcohol washes. Some tissues underwent wholemount processing, in which eyecups were first dissected, removing the anterior segment and lens, then the neural retinas were removed to allow processing of the RPE/choroid wholemounts. For mouse eye cups, relief cuts were made to flatten the RPE/choroid tissues, then the vitreous humour removed under a dissecting microscope. Human eyecups were dissected by separating the neural retinal layer and the sclera from the RPE/choroid layers. The intact sheet of RPE/choroid was then cut into 12 equivalent pie shape pieces. Punches (3 mm in diameter) from the central, mid-peripheral and peripheral areas of each pie piece were then used for immunolabeling.
Histological stainsToluidine blue
Mast cells were identified using a 0.1% toluidine blue (Abcam, ab146366) solution in 70% ethanol/1% sodium chloride with pH adjusted to 2.0–2.5. The tissue was incubated in toluidine blue solution for 5 min, washed in PBS, then mounted using 50% Glycerol and 50% PBS, and quickly imaged at 100X (Nikon Eclipse 80i). Mast cells appeared pink/purple/red and comprised cell profiles that were approximately 10–25 µm diameter while the background was stained blue.
Non-specific esterase (NSE)
Mast cells and granulocytes were stained in mouse choroid cross-sections using naphthol AS-D chloroacetate (Millipore Sigma, 91C-1KT) following the manufacturer's protocol. NSE left an autofluorescent signal seen at 543 nm with confocal microscopy. Mast cells were distinguished from other granulocytes by size. NSE-positive cells were counted in central retinal regions in the mouse choroid.
ImmunohistochemistryRhesus macaque eyes
Macaque eyes were enucleated within 10 min of humane euthanasia and immersion-fixed for 24 h in 4% paraformaldehyde. The anterior chamber was removed, and the posterior eye cups were cryoprotected with 10, 20 and 30% sucrose concentrations. Samples were embedded in optimal cutting temperature (OCT) compound, frozen, and cut at 14 µm sections. Slides used for immunofluorescence staining were blocked for 30 min in a phosphate buffered saline-based buffer containing 4% horse serum, 0.5% Triton-X 100 and 1.0% bovine serum albumin. Sections were incubated with an anti-Granzyme B (Abcam, ab4059, 1:100) antibody overnight at 4 °C followed by incubation with an Alexa-Fluor 488™ secondary antibody (1:300). Slides were counterstained with 4′,6-diamidino-2-phenylindole (DAPI). Confocal z-stack images were acquired using a Leica SP5 laser-scanning confocal microscope and processed using ImageJ software.
Human donor eyes
Human donor eyes were processed for paraffin-embedded cross sections [15] or as RPE/choroid wholemount punches (3 mm). The samples underwent citrate buffer antigen retrieval, and then probed using primary antibody against GzmB for 2 h at room temperature (RT) and washed thoroughly with PBS, before the appropriate secondary antibody was applied and incubated for 45 min. After additional washes, the nuclei were labeled with DAPI. Next, the immunoreacted cross-sections and RPE/choroid wholemount punches were coverslipped and imaged using Zeiss LSM 800 confocal microscope at 4X, 20X, 40X or 80X magnification.
Mouse eyes
Mouse eye cross-sections underwent antigen retrieval with proteinase-K for 20 min or heated in citrate buffer for 10 min. A solution of 3–10% normal goat serum (NGS) (Vector Laboratories, S-1000–20) in 0.3–1.0% TX-100 in PBS was then used for 20 min to block non-specific binding. This was followed by incubation in primary and secondary antibodies (see below). In all cases, negative control sections were processed in parallel in an identical manner, except the primary antibody was omitted from the diluent and replaced with a matched IgG at the same concentration as the primary antibody.
Immunohistochemistry
All primary and secondary antibodies are identified in Supplementary Table 1. To characterize perivascular macrophages or GzmB-positive cells in the choroid, primary antibodies against F4/80 (Abcam, ab6640) or GzmB were used. Slides were incubated for 1–2 h at RT and left overnight at 4 °C.
GzmB and c-Kit double label immunohistochemistry
To determine the number of mast cells that were GzmB positive, we dissected wholemounts of mouse or human RPE/choroid for immunostaining. Following antigen retrieval with citrate buffer, the tissues were rinsed, placed in a solution of 1:100 primary antibody against c-Kit (Biolegend, 105816) for 1 h at RT, rinsed and next placed in a solution of 1:100 GzmB and incubated for 2 h at RT.
Angiogenic and pro-inflammation Immunohistochemistry
To assess the angiogenic potential of the outer retina of naïve and laser-induced CNV in WT and GzmB−/− mice, we used primary antibodies against CD31 (Cell Signaling 77699) or VEGF-A (Abcam, ab46154). To assess the pro-inflammatory events associated with CNV we used primary antibodies against IBA-1 (Fujifilm Wako) and IL-6 (Novus Biologicals). Each of the four antibodies was used at 1:100 dilution in 3% normal goat serum in 0.3% TX-100 PBS, and incubated at RT for 1–2 h.
After all primary antibody incubations, slides were rinsed in PBS and an appropriate fluorescently tagged secondary antibody was applied, followed by DAPI for nuclear labeling. Slides were then coverslipped and imaged.
Confocal microscopy
Paraffin sections and wholemounts of eye tissues were imaged using a Zeiss LSM 800 confocal microscope with Zen 2.6 Blue version software (Carl Zeiss, Germany) focusing on the outer retinal areas, specifically the RPE/BrM and choroidal layers. Confocal microscopy was completed at ×20, ×40 or in some cases, a digital crop factor was applied (×80 magnification). For wholemounts, Z-stack images were taken, and orthogonal reconstructions of z-stack images were used to visualize the full depth of the wholemount, from the RPE monolayer and into the choroidal layers. Confocal images of cross-sections were taken at minimum of four positions—two central and two peripheral positions around the optic nerve. All settings on confocal were kept constant throughout the imaging sessions to compare intensity of fluorescent signals between experimental groups or between WT and GzmB−/− mice.
Immunostaining analysisCD31, F4/80 and NSE
CD31 + vessels, F4/80 + cells, or NSE + cells were identified based on their bright green (CD31 and F4/80) or their bright red (NSE) fluorescence compared to negative control sections. Positive profiles were counted on four confocal images taken in the central and mid-peripheral retinal zones. Raters of the immunolabeling were masked to the mouse strain and/or experimental group. The average number of CD31+, F4/80+, or NSE + cells per mouse was calculated and normalized by areal measurement.
VEGF-A analysis
Immunofluorescence of VEGF-A can be used as a relative indicator of the angiogenic potential of the mouse RPE and choroid. Images taken at identical confocal settings underwent pixel analysis using ImageJ software (NIH, Bethesda, USA). The area of interest was selected using the freehand cropping tool to quantify the mean fluorescent intensities. Threshold and radius of pixels were set to select the positively stained pixels while omitting the non-specific fluorescence artifacts. Negative control sections supported the threshold and radius settings. The histogram tool was used to count all selected pixels. Percentages of pixel counts were normalized by dividing by the total area of analysis.
Choroid sprouting assay (CSA)
The detailed protocol of the CSA, an ex vivo model of microvascular angiogenesis is described in Shao et al. [24] Briefly, the peripheral RPE-BrM-choroid-sclera tissues were dissected into 6–10 smaller pieces of approximately 1 square mm explants from 2–3-month-old C57BL/6 J mice. The explants were placed on growth factor reduced Matrigel™ (Corning, 354,230) or Geltrex™ (ThermoFisher, A1413201) and cultured at 37 °C with 5% CO2 for 8–10 days with media changes every 48 h. For the CSAs involving exogenous GzmB treatment, CSA explants were stimulated with either exogenous GzmB (50 nM) or PBS (control) on Days 4, 6, 8 and 10 of culture. On Day 10 of culture, after five hours of GzmB treatment, culture supernatants were collected, processed, and stored at -80 °C for later analysis. For all other CSAs, on Day 2 of culture, HBSS (control), 48/80 (6.25 µg/mL), or Ketotifen Fumarate (Zaditor®, 2.0 µg/mL) was added to culture media every second day until Day 8. For those experiments using the GzmB-specific inhibitor, VTI-1002 was added once daily (250 µM). The supernatant was collected every second day and replaced by fresh media. Images of individual explants were taken every 48 h, and the areas of vascular sprouting were analyzed by a standardized SWIFT-Choroid macro based on ImageJ software and quantified relative to the original explant area or shown as total growth in pixels where 6600 pixels represents 1mm2 sprouting.
Western Blot
To assess the expression and/or cleavage of various proteins after GzmB or mast cell stimulation, western blots (WBs) were performed. CSA supernatants (20–40 µl) were separated by electrophoresis on a 10% SDS-PAGE gel and transferred to a polyvinylidene difluoride (PVDF) membrane. Membranes were blocked in Blocker™ FL Fluorescent Blocking Buffer (Thermo Fisher Scientific, 37565) for 1 h at RT before probing with the following primary antibodies at a dilution of 1:1000: fibronectin (Abcam, ab2413), laminin (Abcam, ab11575), decorin (Abcam, ab175404), IL-6 (Abcam, ab6672), TGF-β (Abcam, ab92486) and VEGF-A (Abcam, ab46154) in Blocker™ FL Fluorescent Blocking Buffer overnight at 4 °C. Blots were then probed with rabbit IgG HRP-conjugated secondary antibody (R&D Systems, HAF008, 1:20,000 or 1:100,000 dilution) in 50% Blocker™ FL Fluorescent Blocking Buffer in 0.1% Tween-20-1× PBS for 2 h at RT. All membrane washes were performed with 0.1–0.2% Tween-20-1X PBS. For quality control, either the housekeeping gene, vinculin with a molecular weight of 124 kDa or total protein labeling with No-Stain™ Protein Labeling Reagent (ThermoFisher Scientific, A44449) following protocols from the manufacturer was used. The respective proteins were detected with SuperSignal™ West Pico PLUS Chemiluminescent Substrate (ThermoFisher Scientific, 34579) or SuperSignal™ West Atto Ultimate Sensitivity Substrate (ThermoFisher Scientific, A38554). Membranes were imaged with iBright FL1500 Imaging System (ThermoFisher Scientific), and densitometric band intensities relative to vinculin expression or total protein were analyzed by Image StudioLite v 5.4 software.
MSD U-PLEX assay
A MesoScale Discovery (MSD) U-PLEX mouse biomarker multiplex kit was used to measure concentrations of IL-6, CCL2 (also known as monocyte chemoattractant protein-1 [MCP-1]) and VEGF-A in CSA supernatant according to the manufacturer’s instructions. Supernatant samples (100 µg protein) were plated out in duplicates. The MSD 96-well plate was read on a MesoQuickPlex SQ 120 instrument within 10 min of adding the MSD read buffer. To quantify the concentrations of the analytes in the CSA supernatant, MSD.
Discover Workbench V4 software was used to generate a logarithmic standard curve according to manufacturer instructions.
Laser-induced CNV
Two-to-12 weeks old C57BL/6J or Gzm−/− mice were anesthetized with a mixture of xylazine (6 mg/kg) and ketamine (100 mg/kg), and pupils dilated with topical drops of 2.5% Mydfrin and 1% Mydriacyl (Alcon, Fort Worth, TX). A drop of 0.5% proparacaine was used as a topical anesthetic. Next, lubricating eye drops (Alcon) were applied to the cornea. The fundus was viewed with an imaging camera, and laser photocoagulation was induced using the image-guided laser system (Micron IV, Phoenix Laboratories). The fundus image as well as the aiming beam were visualized on the monitor. Four laser burns at equal distance from the optic nerve were induced in one eye by a green Argon laser pulse with a wavelength of 532 nm, a fixed diameter of 50 μm, duration of 100 ms, and power level of 250 mW. The presence of a bubble at the time of the laser photocoagulation was considered as an indication of disruption of the Bruch’s membrane and subsequent formation of CNV.
Fundus fluorescein angiography (FFA)
FFA to determine choroidal neovascular leakage after laser-induced CNV was performed with the micron IV 7 days after laser photocoagulation. Mice were anesthetized, pupils dilated and intra-peritoneally injected with fluorescein AK-FLUOR (Akorn) at 5 μg/g body weight. Fluorescent fundus images were taken 10 min after fluorescein injection. The fluorescent intensity of CNV lesions was graded using ImageJ (NIH) in a masked fashion.
In-vivo imaging
For functional in-vivo imaging, the previously developed swept source-based small animal retinal imaging system [25] was modified for a spectral domain optical coherence tomography (SD-OCT) system to achieve a better resolution and higher phase stability. A super-luminescent laser diode (BLM2-D, Superlum Diodes) with central wavelength of 810 nm and bandwidth (1/e2) of 90 nm was used as a light source which yields the axial resolution of 3.2 µm (in air). Polarization diversity detection for melanin-specific contrast imaging [25] was adopted by implementing two numerically calibrated custom spectrometers [26] that acquire two orthogonally polarized optical signals separated by a polarization beam splitter. The scanning beam (1 mm diameter) was directed into the pupil, with an optical power < 700 µW which is below the ANSI standard at the wavelength [27]. The OCT-based angiography (OCTA) images were derived from three consecutive OCT scanning at a single transversal location to visualize retinal vasculature. Each retinal OCT and OCTA volume data contains 500 A-scans per B-scan and 500 B-scans per volume, which were acquired at an A-scan rate of 242 kHz with a B-scan rate of 440 Hz.
The structural OCT images were constructed by averaging the two complex signals acquired by each spectrometer to form a polarization-insensitive coherent composite OCT image that compensates for the signal loss inherited from the separation of the output signals into two channels [25, 28, 29]. The vascular contrasts visualized with OCTA were obtained by conventional method of estimating complex variance between B-scans acquired at the same spot. The melanin-specific contrast images were processed by the calculation of the noise-suppressed degree of polarization uniformity (DOPU) which visualize the melanin composite in the retina [25, 29]. All computation operations for data processing and image reconstructions were conducted in MATLAB-R2022b (MathWorks).
Electroretinograms
Two groups of mice, a younger group (2–5 months) and an older group (11–15 months) were used to compare age-related changes in ERGs and functional imaging in both WT and GzmB−/− strains. Mice were dark-adapted for 40 min prior to electroretinogram (ERG) recordings, after which all work was conducted under red light (640–700 nm). Anesthesia was administered to each mouse through an intraperitoneal (IP) injection of ketamine and xylazine. Mice remained on a temperature-controlled heating pad for the duration of the experiment. Once fully anesthetized, dilating drops (Phenylephrine 2.5%, Tropicamide 0.5% Drops) and ophthalmic anesthetic drops (Proparacaine Hydrochloride Ophthalmic Solution (Alcaine 0.5% Ophthalmic) are applied to eyes. After the eyes are checked for dilation using a red light, artificial “tear gel” (Systane Gel Lubricant) is applied to act as a buffer between the cornea and microscope lens during recordings.
Full field ERG (ffERGs) recordings were taken using the Ganzfeld ERG platform (Phoenix Laboratories). Scotopic ffERGs were recorded at seven intensities ranging from − 1.7 to 2.1 log (cd s/m2) with 10–20 flash stimuli presented at each intensity. Special care was given to increase time intervals and lowering flash duration as stimuli intensity increased to prevent photoreceptor bleaching. Recordings were taken from both eyes. ERGs from the right eye were recorded for 300 ms after the flash stimuli, producing both a and b-waves. Left eye ERGs recorded for 2 s after each flash to account for the c-wave as well. All data were collected and analyzed in LabScribe Data Recording Software (iWorx). Later, mice were injected with a reversal agent atipamezole hydrochloride (ANTISEDAN® Zoetic Inc, 1 mg/kg) or 0.9% saline (20 ml/kg) subcutaneously and placed on heating pads until fully awake and returned to cages.
Statistics
Statistical data were analyzed using GraphPad Prism version 9 and expressed as mean ± standard error of the mean. Analysis between two groups of continuous variables was conducted using independent samples t-test while analysis between multiple groups of continuous variables was conducted using one-way ANOVA followed by a Tukey’s post-hoc test. Analysis between two groups of ordinal variables was conducted with a one-tailed Mann–Whitney U test. A p-value < 0.05 was considered statistically significant.


留言 (0)