Reconstructions
PET raw data (i.e., sinograms) were reconstructed using five combinations of algorithms as shown in Table 1.
Table 1 Deep learning algorithm combinations explored in this study with brief descriptionsReconstruction one (ToF-BSREM) is the gold standard, all subsequent reconstructions were compared against it. ToF-OSEM is the expected input for DLE, as used in reconstruction two (ToF-OSEM + DLE) and previously evaluated [19]. Reconstructions three (OSEM + DLE + DLT), four (ToF-OSEM + DLE + DLT) and five (ToF-BSREM + DLT) apply the DL algorithms beyond their intended use. In these cases, the input image being provided to the DL algorithm potentially has characteristics or features that are outside the boundaries of the training data used in creation of the DL model.
DLE is a 3D residual convolutional coder-decoder (U-Net) network developed and implemented in Pytorch. The model was trained in supervised sessions, where it mapped low-contrast high-noise OSEM PET images to low noise high contrast BSREM images. In the supervised sessions, the output OSEM + DLE was compared to a target patch BSREM and based on the result of the smooth L1 loss function the trainable parameters were updated. The DLE architecture is composed of convolutional layers (using 3 × 3 × 3 kernels), batch normalisation (BN), 3D max pooling layers and tri-linear up-sampling layers, skip and residual connections and leaky rectified linear unit (ReLU) activation functions. DLE used 510 [18F]-FDG PET/CT scans from six sites equipped with D710 and DMI, of these scans, n = 480 were used for training, n = 15 for validation and n = 25 for testing. The OSEM reconstructions were of matrix size 256 × 256, field-of-view 700 mm, voxel size 2.7 × 2.7 × (2.8 or 3.7) mm3 and 2 iterations, 34 and 24 subsets for Discovery MI and 710 scanners, respectively, with PSF and standard z-filter [19].
DLT is similar to DLE’s network that is a 3D residual U-Net developed and implemented in Pytorch. The model was trained in supervised sessions, where DLT compared the predicted ToF-BSREM images to target ToF-BSREM using the MSE loss function. For DLT, a total of 273 [18F]-FDG PET/CT scans were used from six sites equipped with DMI scanners only, split into training (n = 208), validation (n = 15), and testing (n = 50) sets. The matrix size of each reconstructed image was of 256 × 256 and field-of-view of 700 mm (x–y pixel size: 2.73 mm, slice thickness: 2.79 mm) [17].
The manufacturer’s Bayesian penalised-likelihood reconstruction algorithm was used to reconstruct all BSREM images with a fixed regularization factor, β = 400 [13]. All OSEM reconstructions used two iterations with 32 (D710) or 34 (DMI) subsets, no in-plane (x-y) post filter, and with the manufacturer’s standard z-filter which is the anticipated (trained) input for the DLE model. Out of the three DLT models available (low, medium, high) with names that describe the strength with which the models were trained to transform non-ToF BSREM images to their target ToF BSREM, the current study used ‘high’ consistently. This was based on previous reader preference [17], and to provide greater changes to the images thus increasing the likelihood of detectable differences in the current study while limiting the number of variables under examination.
Patient selection
The study made use of 40 whole-body 18F-FDG PET-CT scans. 20 scans were performed sequentially on a Discovery 710 and 20 on 25 cm axial field of view Discovery MI (both GE HealthCare). All scans were free breathing, and ungated. For each patient, a whole-body helical CT was performed for PET attenuation correction using 100–120 kVp, 150–200 mAs. For the DMI subjects, the range in activity was (mean ± std MBq) (391.4 ± 99.0 MBq), the patient size range was BMI (26.9 ± 5.6 kg/m2), FDG uptake time range was (80.1 ± 21.2 min) and the acquisition time per bed position was two minutes per bed position. For the D710 subjects, the range in activity was (309.0 ± 77.6 MBq). The patient size range was (27.2 ± 6.8 kg/m2), the FDG uptake time range was (89.7 ± 7.9 min) and all scans were three minutes per bed position.
Clinical and quantitative evaluation
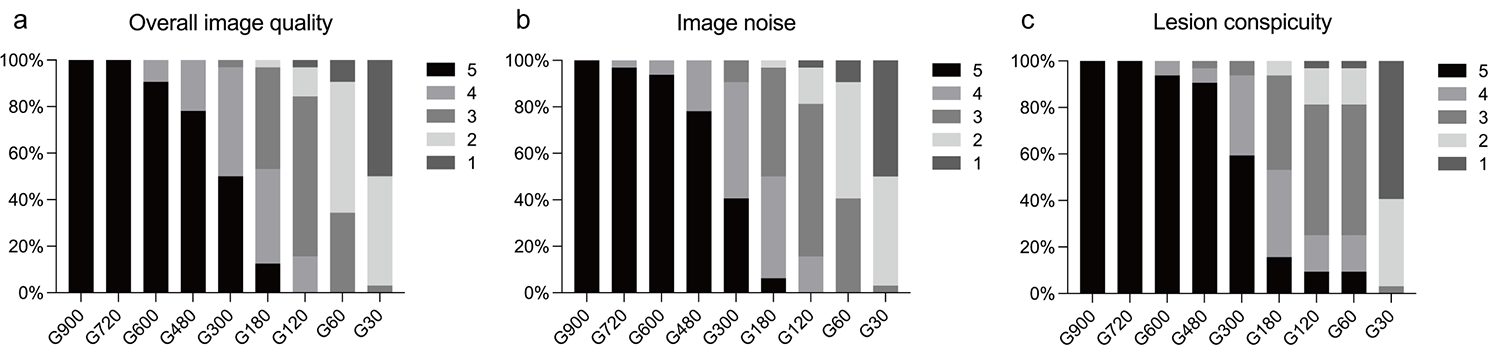
Two experienced radiologists, reader 1 (K.M.B. 20 years board certified in clinical radiology and nuclear medicine) and reader 2 (P.A.F. 19 years board certified in clinical radiology and nuclear medicine), blinded to method of reconstructions, rated the images on a Likert scale (5 best) based on diagnostic confidence, lesion detectability and image quality. The Likert scale used was 0 (non-diagnostic), 1 (poor,), 2 (satisfactory), 3 (good), 4 (very good), and 5 (excellent) as in previous work [17]. Inter-reader agreement was determined using Intraclass Correlation Coefficient (ICC) (two-way random effects model) carried out in SPSS 29. To check for differences across groups a Friedman test was carried out. When significant differences were found, Wilcoxon signed-ranks test with Bonferroni post-hoc were performed for pair-wise comparisons with a significance threshold of p < 0.05.
Radiologist K.M.B identified lesions that were subtle and/or small and recorded the SUVmax of these lesions. To assess noise, the standard deviation between voxels within a 30 mm spherical VOI was calculated using VOIs placed in normal lung and liver. Group-wise differences were calculated using the Kruskal-Wallis test. When significant differences were found, Wilcoxon signed-ranks test with Bonferroni post-hoc were performed for pair-wise comparisons with a significance threshold of p < 0.05. Friedman and Wilcoxon-signed ranks tests were carried out in Python 3.11.


留言 (0)