
記住我


The CHNS is an ongoing community-based longitudinal cohort study in China that enrolled more than 12,000 individuals in approximately 9 provinces. Health information was obtained via questionnaires, household surveys, and biospecimen collection. Study details and protocols have been previously published elsewhere [23]. The CHNS was approved by the Institutional Review Board of the University of North Carolina at Chapel Hill, the National Institute for Nutrition and Food safety at China Center for Disease Control and Prevention, and the Human and Clinical Research Ethics Committee of the China-Japan Friendship Hospital.
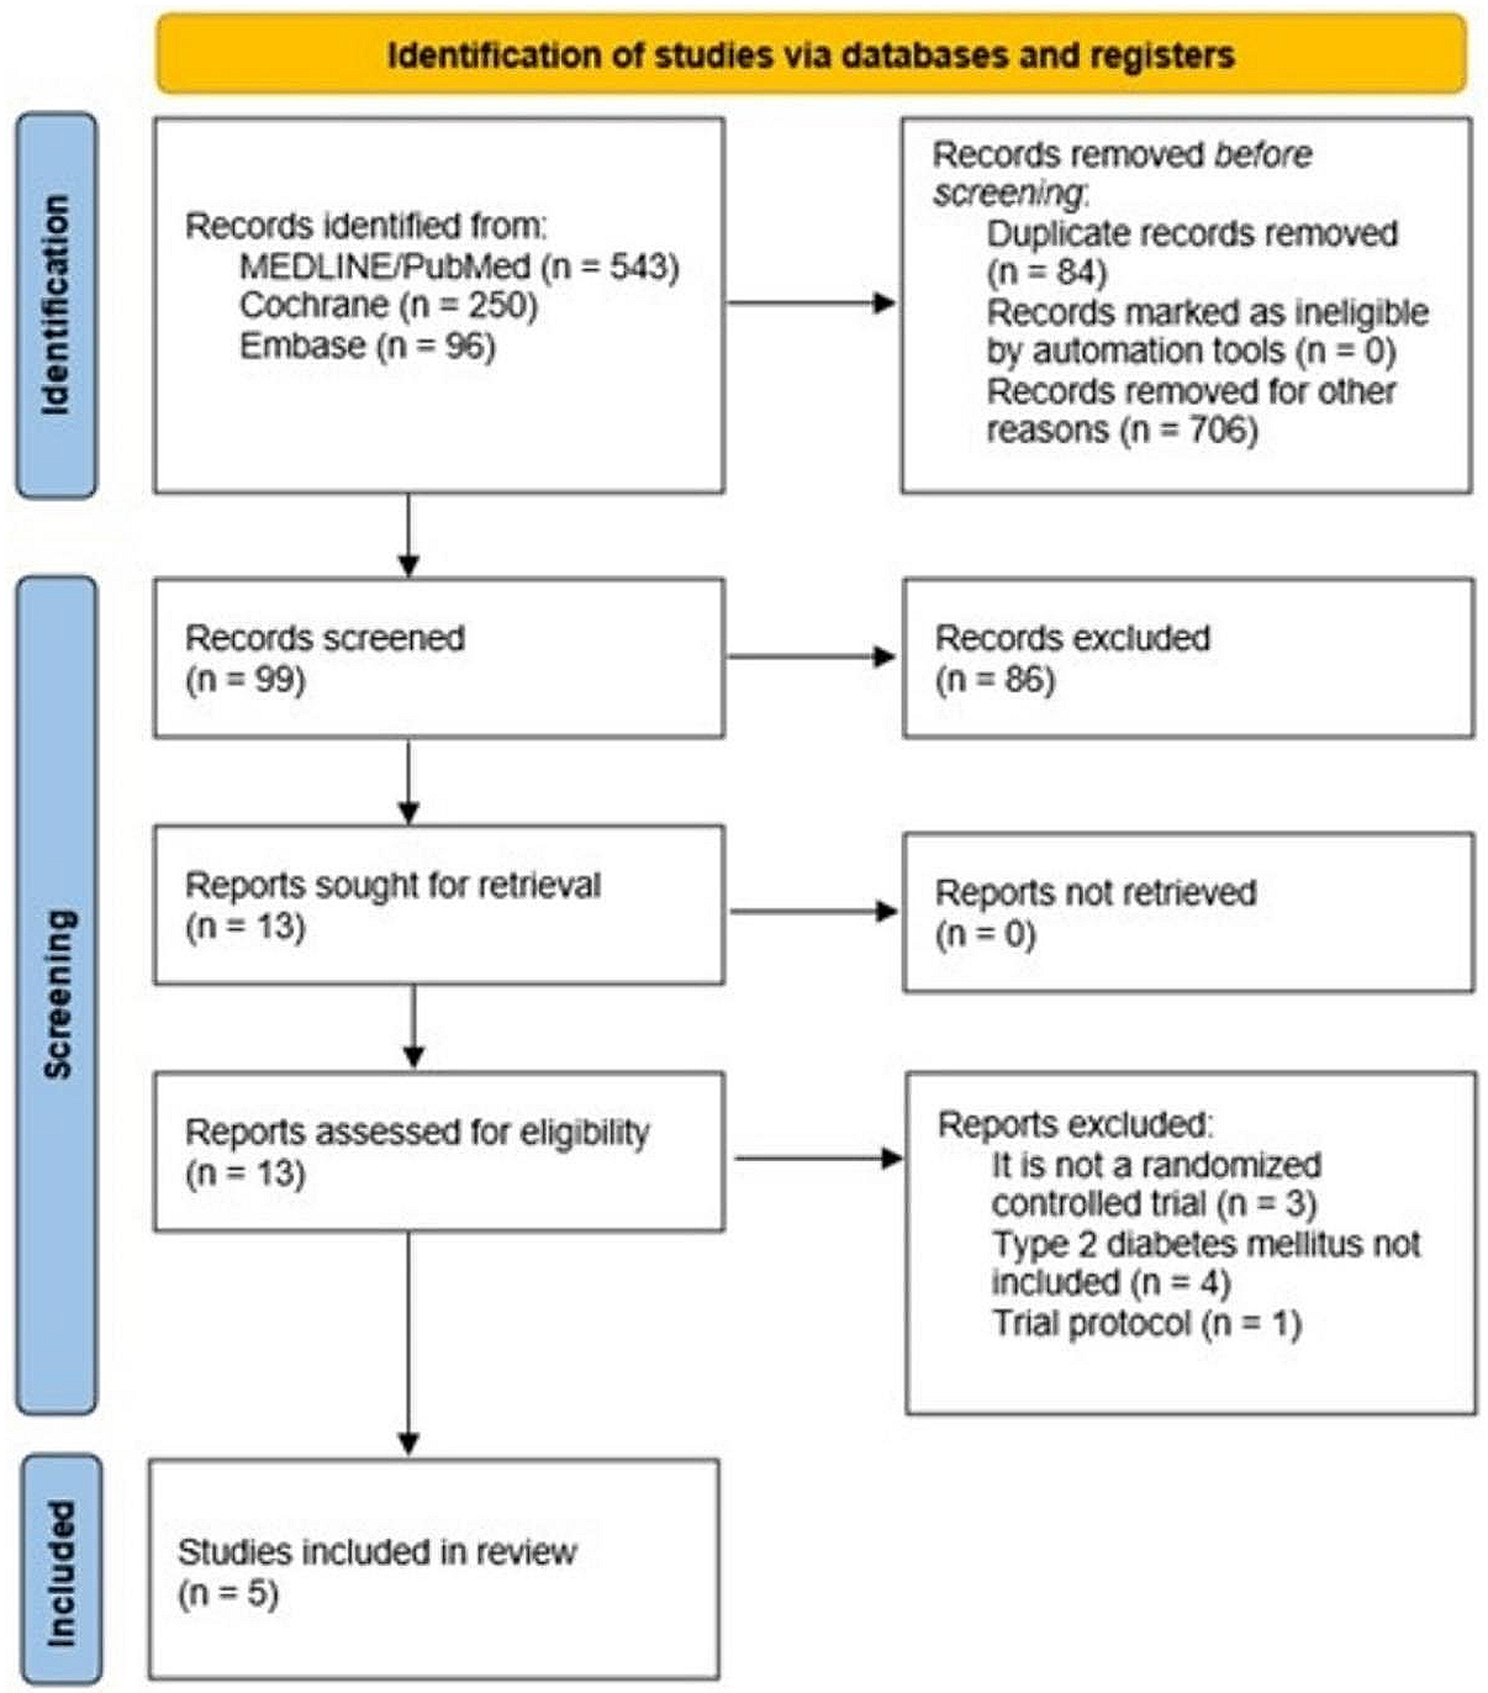
Within the research Waves of the CHNS, blood test was only available in Wave 2009 among 9549 participants. Of these, 1054 participants without RC measurements, 57 pregnant women, 741 participants who were under 18 years old, and 12 participants missing information about iron status markers were excluded in this study. Thus, the present analysis included 7685 participants (Fig. 1). Baseline characteristics of included versus excluded participants are also listed (Additional file 1: Table S1).
Fig. 1
Study flowchart. RC Remnant cholesterol
Measures and definitionsRC (mmol/L) was calculated as total cholesterol (TC) (mmol/L) minus low-density lipoprotein cholesterol (LDL-C, mmol/L), minus high-density lipoprotein cholesterol (HDL-C, mmol/L) [24]. Iron status was assessed as serum ferritin (SF) and total body iron (TBI) [25]. The concentration of TBI was measured using ferritin and soluble transferrin receptor (sTfR), and was calculated as the following formula: (TBI = − [log(sTfR/SF) − 2.28229]/0.1207) [26].
Prior to blood sample collection, individuals were asked to maintain a normal lifestyle for at least 3 days and then fasted for 8–12 h. Transferrin and sTfR were detected by Siemens BNP (Siemens, Germany) via nephelometry. Ferritin was measured by Gamma counter XH-6020 (North Institute of Bio-Tech, China) via radioimmunology. TC, HDL-C, and LDL-C were measured using the CHOD-PAP method, and the polyethylene glycol-modified enzyme method, respectively, by determiner regents [Kyowa Medex Co., Ltd, Tokyo, Japan]. Fasting blood glucose (FBG) and triglyceride (TG) were measured with the GOD-PAP method by determiner regents (Randox Laboratories Ltd, UK for FBG, and Kyowa Medex Co., Ltd, Tokyo, Japan for TG). Creatinine was measured with the picric acid method by determiner regents (Randox Laboratories Ltd, UK). All lipid and creatinine measures were on the Hitachi 7600 automated analyzer (Hitachi Inc., Tokyo, Japan). White blood cells (WBCs) and hemoglobin was measured with a Beckman Coulter LH751 (Beckman Coulter, USA). High-sensitivity C-reactive protein (Hs-CRP) was measured using the immunoturbidimetric method by a Hitachi 7600 (Denka Seiken, Japan). Routine blood test was on-site test and all local laboratories were asked to provide their Levey-Jennings chart for one month. Other samples were analyzed in a national central lab in Beijing (medical laboratory accreditation certificate ISO 15189: 2007) with strict quality control. Homeostatic model assessment of insulin resistance (HOMA-IR) was calculated by: FBG (mmol/L) × fasting insulin level (mIU/L) /22.5.
DM was defined according to medical diagnosis and/or receiving treatment for DM according to questionnaire responses to the following items: “Has a doctor ever told you that you have DM?” and “Have you used any of the following treatments such as special diets, weight control, oral medications, insulin injections, traditional Chinese medicine, home remedies, or qigong/spiritual therapy)?” In addition, an additional criterion (fasting blood glucose ≥ 126 mg/dL, and/or HbA1c ≥ 6.5% according to the American Diabetes Association criteria was also applied for DM screening [27]. Diagnosis of anemia based on hemoglobin concentration (< 120 g/L in men, < 110 g/L in women).
Assessment of covariatesCovariates that could possibly confound the associations between RC, iron, and DM were included in analysis and are described in turn below. Height and weight were measured while the participants were wearing light clothing without shoes by the study staff. Body mass index (BMI) was calculated by weight (kg)/height (m)2. Renal function assessed via the estimated glomerular filtration rate (eGFR) calculated using the Chronic Kidney Disease (CKD) Epidemiology Collaboration (CKD-EPI) equation [28]. CKD was diagnosed based on an eGFR of < 60 mL/min1/1.73 m2. Urban or rural residence, occupation (farmer [including fishermen and hunters]/non-farmer), health behaviors (smoking and alcohol consumption) and education levels (upper middle school and above/ Junior high school or below) were self-reported. Smoking was defined as any previous smoking (yes/no), and alcohol consumption was defined as greater than three times per week (yes/no). History of hypertension was defined by medical diagnosis as reported to the following questionnaire item: “Has a doctor ever told you that you have hypertension?” Cardiovascular disease was defined as having one of the following conditions: coronary artery disease, stroke, or transient ischemic attack. Antidiabetic drug use included oral medications and insulin injections. Energy intake, carbohydrate intake, fat intake and protein intake per day were all calculated by multiplying the intake of each food by the standard serving size (100 g) from the average self-reported dietary intake for 3 days. Participant age and sex were also examined.
Statistical analysisAll participants were divided into four groups according to quartiles of RC levels. Continuous variables were presented as mean ± standard deviation for normal distributions or medians and interquartile range (IQR, 25–75%) for skewed distributions, and categorical variables were expressed as frequency (percentages). The generalized linear regression analysis and Cochran-Armitage trend χ2 test were employed to test for trend across RC quartiles for continuous and categorical variables, respectively. Then, we used a general linear model to evaluate the associations between RC and iron status markers by β-coefficient and 95% confidence intervals (95% CIs). According to the STROBE recommendation, we simultaneously showed the results from unadjusted, minimally adjusted and fully adjusted analyses [29]. Potential confounders that were significant in the univariate analysis or clinically important were included for model adjustment. We also developed directed acyclic graphs (DAGs) for the selection of covariates (Additional file 1: Figs. S1, S2). For the association between RC and iron status, the confounders included age, sex, BMI, residence, occupation, education, smoking, alcohol consumption, eGFR, LDL-C, HDL-C, average energy intake, average carbohydrate intake, average fat intake, and average protein intake. Subgroup analyses (including age, sex, BMI, residence, occupation, education, smoking, CKD, anemia and alcohol consumption) were performed using stratified linear regression models. Moreover, to explore the possible dose–response relationships between RC, iron status markers and DM prevalence, logistic regression assigned to all subjects was performed by incorporating a restricted cubic spline (RCS) function with odds ratios (ORs) and 95% CIs, adjusting for age, sex, BMI, residence, occupation, education, smoking, alcohol consumption, eGFR, LDL-C, HDL-C, antidiabetic drug, average energy intake, average carbohydrate intake, average fat intake, and average protein intake. Four knots at the 5th, 35th, 65th and 95th percentiles were set for the RCS. Finally, the causal steps approach based on R package “mediation” was conducted to investigate the effect of RC on DM partially mediated through SF and TBI, and Sobel test was performed to avoid missing any significant results [30]. Adjusting for all covariates in Model 3, bootstrapping method with 10,000 repeats was used to estimate the 95% CI of indirect (mediated) effects. Mediation was confirmed if the bias-corrected 95% CI for the indirect effect did not include zero. Additionally, sensitivity analyses were performed to specifically assess the association of RC and iron status: (1) further considering TG and hs-CRP as covariate, and (2) excluding participants without covariates.
The proportion of missing data in the analysis sample was not more than 2%. Missing data was interpolated by the method of the last observation carried forward, or the mean value of continuous variables and the median value of skewed variables. Associations where p < 0.05 (two-sided) were considered to be statistically significant. We performed all analyses with Stata 15.0 and R (version 4.0.2).
留言 (0)