General Methods
Experimental procedures were approved by the National Research Ethics Committee for the East of England (ref. number 00/327), and written informed consent was collected prior to any testing. All experiments were performed with participants implanted with a CI manufactured by the Advanced Bionics company. Information on each participant and on the centre electrode of the maskers tested is shown in Table 1. CI electrodes were stimulated by bypassing the clinical processor and connecting the radio-frequency coil to a Platinum Series Processor provided by Advanced Bionics (Valencia, USA), which in turn was connected to a laptop computer. Stimuli were generated using programs written in Matlab and that called routines from the Bionic Ear Data Collection System provided by Advanced Bionics.
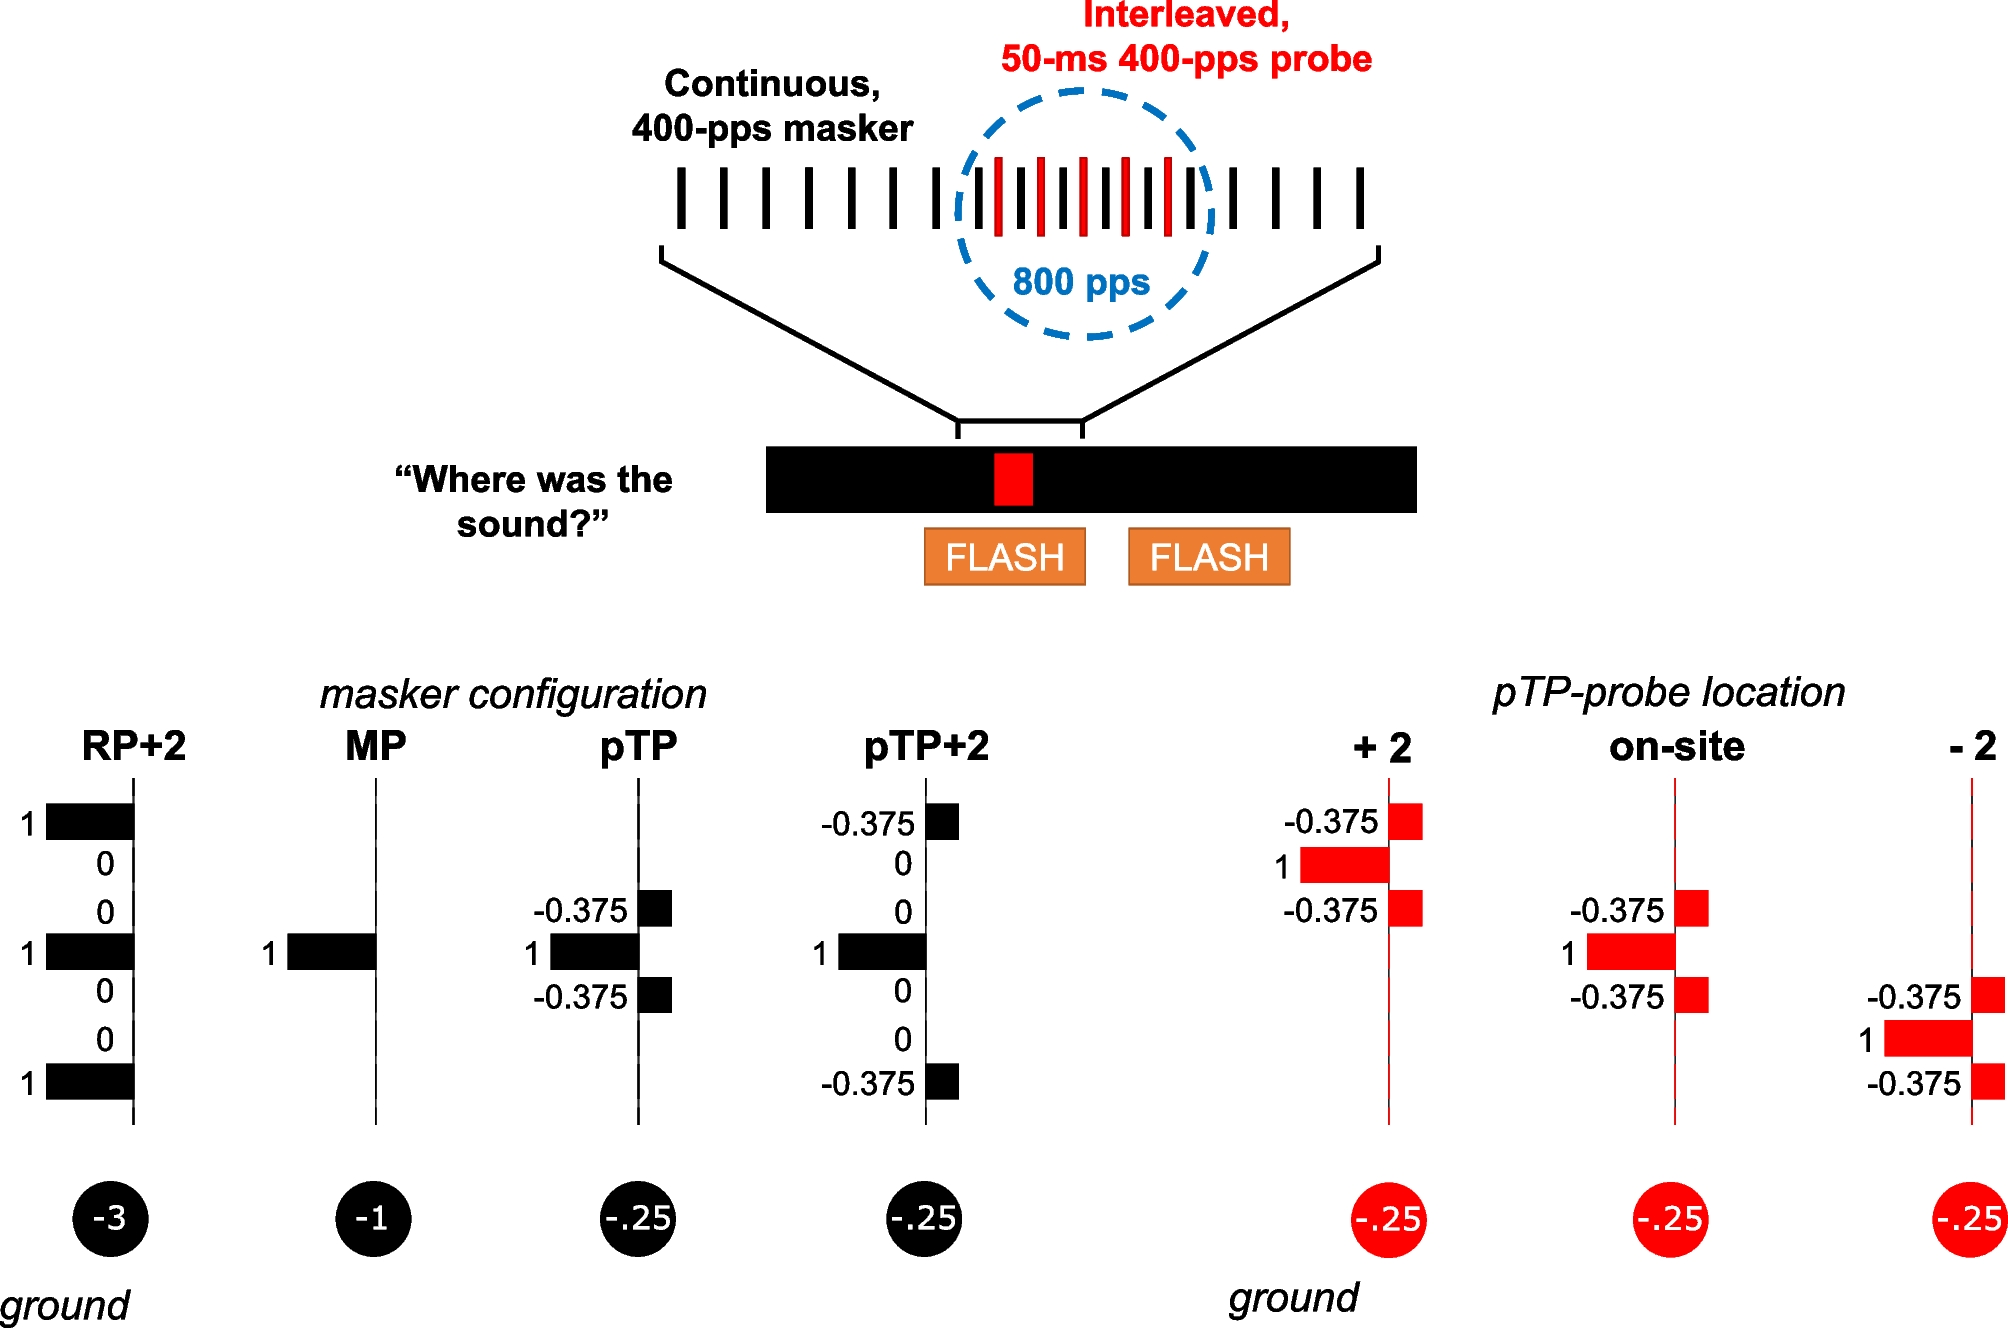
Table 1 Participant details. 1j is a straight electrode array; ms (‘mid-scala’) is a pre-curved electrode arrayAs shown in Fig. 1, listeners were required to detect a 400-pps 50-ms pulse train (the probe) interleaved with various masker types. The masker centre electrode was fixed throughout all experiments, and the probe centre electrode was either the same as the masker centre electrode or shifted by 2 electrodes more basally/apically. This probe was presented in partial tripolar (pTP) configuration, with current injected via a central electrode and with 75% of that current returned through two adjacent flanking electrodes; the remaining 25% was returned through the case of the implant (Fig. 1). In each 2-interval 2-alternative forced-choice trial, the listener indicated which of two intervals, marked by flashing virtual buttons on a computer screen, contained the probe. When a masker was present, it had a pulse rate of 400 pps, and the masker and probe were interleaved so that the probe pulses fell exactly mid-way between adjacent masker pulses leading to a centre-to-centre inter-pulse interval for the combined stimulus of 1.25 ms (Fig. 1). This was chosen such that the inter-pulse interval was long enough to minimise charge interactions, but short enough such that the individual and combined pulse rates fell above the “upper limit” of temporal pitch (~300-400 pps). The strength of any pitch change introduced by the probe would presumably have been greatest when the probe and masker pulses were equally loud, and we wished to avoid the nature of the cue changing during an adaptive track. The masker had a duration of 2.4 s: 500 ms of masker-only pre-stimulation, 450 ms for the first interval (200 ms masker-only, 50 ms masker + probe, 200 ms masker-only), 500 ms of inter-interval stimulation, 450 ms for the second interval, and 500 ms of masker-only to end with. All stimuli consisted of trains of symmetric biphasic pulses having phase durations of 97 µs and with zero inter-phase gap. Probe thresholds were estimated using a ‘1-up-2-down’ adaptive procedure in which probe level was increased after every incorrect answer and decreased after every two consecutive correct answers, thereby converging on the 70%-correct point of the underlying psychometric function [16]. The change from decreasing to increasing probe level or vice versa defined a turn point. The size of the level steps were 1 dB for the first 2 turn points and 0.5 dB thereafter. The procedure ended after the 8th turn point, and the probe levels from the last 6 turn points were averaged to obtain threshold for that run. Thresholds for each listener and condition were calculated from the average of three runs, or from four runs if thresholds for any two of the first three runs differed by more than 2 dB.
Statistical analyses were performed using IBM SPPS version 27. Mauchly’s test of sphericity was used to check for equality of variance, where necessary p values and effect sizes were adjusted using the Huynh–Feldt correction and are reported along with the original degrees of freedom. Effect sizes (ηp2) are reported for all significant effects and interactions. For analysis of post hoc comparisons, we always used the Bonferonni correction for multiple comparisons and report this by multiplying the ‘raw’ p value by the number of comparisons made.
Preliminary Experiment: Charge Interactions
Four listeners took part in a preliminary experiment to check for facilitation effects between the masker and the probe. Facilitation effects are stronger when the second phase of one biphasic pulse has the same polarity as the first phase of a following pulse [7, 17,18,19]. In our main experiment, the masker second phase and the probe first phase are of opposite polarity (both consisted of cathodic-leading biphasic pulses), but we verify here that flipping the polarity of either the probe or the masker does not change thresholds, as this would be a sign that facilitation could be occurring at the inter-pulse interval we use (1.25 ms). We first measured the Most Comfortable Loudness level (MCL) for the MP and pTP maskers. To do this, the masker durations were reduced to 500 ms. The experimenter played the stimuli, and the listeners pointed on an 11-point scale ranging from ‘inaudible’ to ‘too loud’, with the MCL corresponding to point 7. The experimenter always started with very soft stimuli and increased the level until point 7 was reached, making sure to go down and up again in level to confirm the listener’s judgement before deciding on the final MCL. The MCL was obtained in this way both for pulse trains with anodic-leading and cathodic-leading polarity. A unique level, slightly below the MCLs of each polarity, was picked for the masked detection thresholds; note that for each masker type (MP or pTP), the level was the same for both polarities. The MCLs for the 50-ms pTP probe were similarly obtained for both polarities. Next, masked on-site thresholds for the probe were obtained for all four combinations of masker and probe polarity, as described in the ‘General Methods’ section and using the full 2.4-s masker duration.
Main ExperimentMasked Excitation Patterns
The main experiment measured probe thresholds in quiet and in the presence of four different maskers, each of which is illustrated in Fig. 1. The MP and pTP maskers were the same as described above. The pTP + 2 masker was similar to the pTP masker except that the flanking electrodes were separated from the central electrode by two unused electrodes. The electrodes used in the RP + 2 stimulus were the same as for pTP + 2, but stimulated in the same (rather than opposite) polarity and with equal amplitude applied to all three electrodes (The abbreviation RP stands for ‘ralopirt’, which is the word ‘tripolar’ spelled backwards). The electrode location of the RP + 2 complex is given by the centre of the three source electrodes. All maskers as well as the probe consisted of cathodic-leading biphasic pulses.
The first part of the experiment measured on-site masking for seven listeners in two conditions. In the first condition, the maskers were set to have equal loudness. It started with a loudness-scaling procedure identical to that used in the preliminary experiment and using shortened, 500-ms versions of each masker. The maskers were then loudness-balanced to each other using a procedure based on the one described by Landsberger and McKay [20]. Initially, the level of the MP stimulus was fixed to its MCL and presented first (the reference) in a pair with another masker type (the test). The listener was instructed to report whether the test sound was quieter, at the same loudness, or louder than the reference. The experimenter then increased and/or decreased the level of the test stimulus until the participant was confident that both sounds were at equal loudness, making sure to first bracket the level of the test stimulus in order to yield softer and louder percept than the reference stimulus. The whole procedure/run was repeated four times, each with a slightly different initial level of the test stimulus, and each time swapping the stimulus type (i.e. MP stimulus became the test if it was the reference in the previous run, and vice versa). The matched loudness of the test stimulus was then taken as the level of MP stimulus plus the mean level difference obtained from all four matches. The second condition measured the changes in masker level needed to produce approximately equal on-site masking for all maskers. To do this, any masked thresholds for the pTP, pTP + 2, and RP + 2 maskers that differed by more than 1 dB from the MP masker in the first condition were re-measured (i.e. a full set of 3–4 threshold measurements) with the masker level adjusted by a small amount (typically 0.25 or 0.5 dB). In some cases, the level of the masker had to be adjusted several times for the masked threshold to differ by less than 1 dB from the MP-masker condition.
In previous studies and in some preliminary measures, we used a different method for equating on-site masking, in which the levels of the different on-site maskers were varied throughout using an adaptive procedure so as to just mask the probe. We found that although this method sometimes worked well with the stimuli used here, it also sometimes produced quite variable results and with erratic adaptive procedure tracks; furthermore, the masked thresholds subsequently measured by adaptively varying the probe level were not, as intended, always the same for all maskers. Procedural difficulties in equating on-site masking using a masker-varying method have also been reported in an earlier study [10]. We reasoned this may have been due to listeners attending primarily to the masker, which varied from trial to trial, rather than to the probe which was fixed in level throughout each run. The method that we finally adopted, although relying on the experimenter’s best estimates of what level to try next, produced a pragmatic solution as reflected in reliable thresholds and monotonic underlying psychometric functions (not shown here).
The second part of the experiment measured masked excitation patterns using the equally effective (on-site) masker levels obtained in the first part. To do this, masked thresholds were obtained for probe locations that were 2 electrodes apical and 2 electrodes basal to the masker electrode (or to the central electrode of the RP + 2 configuration) and by combining these with the on-site masked thresholds from the first part. In this configuration, the active electrode of the probe was one electrode displaced from the flanking electrodes of the pTP + 2 and RP + 2 configurations (Fig. 1). Probe thresholds for each electrode in the absence of the masker were also obtained so that masked thresholds could be expressed as the amount of masking in dB relative to the unmasked thresholds.
Cochlear Voltage Recordings
For all participants and masker types, we measured the resulting stimulation voltage along the whole length of the electrode array at the stimulation levels of the main experiment. To do so, we first obtained Stimulation-Current-Induced Non-Stimulating Electrode Voltage recordings (‘SCINSEVs’ [21]) using the Volta software provided by Advanced Bionics, who use the term ‘Electric Field Interactions’ for this type of measurement: each electrode was stimulated in monopolar configuration, with the resulting voltage recorded at all the electrodes. This yielded a 16-by-16 matrix with all possible combinations of stimulating and recording electrode, which was then normalised by the input current to give values in ohms. The diagonal of this matrix Z (stimulating and recording on the same electrode) does not reflect the true voltage at the electrode array, because of the contact impedance contributing to the values being measured [22, 23]. The underlying voltage can however be estimated with linear extrapolation [23] or a ladder-network of resistors [22]. We used the linear extrapolation method described by van den Honert and Kelsall [23] for simplicity. Once the diagonal values were estimated, and assuming linearity, we could estimate the voltage at each electrode for any stimulation modality and level by matrix multiplication: V = Z * I, where V is the resulting voltage, Z the 16-by-16 matrix, and I the injected current at the different electrodes. The linearity assumption is valid as long as measures are within compliance limits of the device [24, 25]. As common practice in our laboratory and for safety reasons, we always measure limits of compliance prior to and after any testing. As a check, we also measured the voltages for each masker stimulation configuration at the non-stimulating electrodes using the Advanced Bionics ‘BEDCS’ software; these voltages were very similar to the voltages estimated from the matrix multiplication, apart from an overall difference in gain due to measuring the voltages at a different time point in the waveform.


留言 (0)