
記住我


Bladder cancer is one of the most common malignant tumors of the urinary system. Bladder cancer is a common malignancy in women and the fourth most common cancer in men, accounting for 7% of all newly diagnosed cancers. As the eighth leading cause of cancer death, bladder cancer accounts for 4% of all cancer deaths in American men [1]. In China, the incidence and mortality of bladder cancer are also increasing year by year [2]. Bladder tumors can manifest as gross or microscopic hematuria. Based on the degree of hematuria and the risk of malignant tumors, evaluations are performed using cystoscopy and upper urinary tract imaging. About 70% of bladder cancers are nonmuscle-invasive bladder cancer. The main treatment for nonmuscle-invasive bladder cancer is transurethral resection of bladder tumor and intravesical therapy, but it has a high recurrence rate [3]. About 20–30% of bladder cancers are muscle-invasive bladder cancer. More aggressive treatments are necessary, including radical cystectomy, urinary diversion surgery or trimodal therapy, including maximal transurethral resection of bladder tumor, radiosensitizing chemotherapy and radiotherapy to reduce the risks of metastasis and disease-specific mortality. Bladder cancer surgery is highly traumatic, with many postoperative complications, easy recurrence and poor prognosis [4]. Therefore, early detection, diagnosis and treatment are crucial for the prognosis of bladder cancer patients. In recent years, diagnosis of bladder cancer is usually based on cytology, ultrasound (US) and cystoscopy, all having certain limitations. Although cytological assessment and US are noninvasive, inexpensive and easy to implement, they have low sensitivity [5]. Cystoscopy is currently the gold standard for bladder cancer diagnosis, but it has some invasiveness, causing pain and discomfort to patients, and risks of urinary tract infections [6]. Due to the limited success rate and complications of such invasive biopsies, there is a growing need to explore a noninvasive, reliable biomarker for bladder cancer. The detection of biomarkers in urine by liquid biopsy represents a promising new noninvasive approach to overcome these limitations and supplement current clinical practice. However, current biomarkers lack sufficient clinical value. Therefore, it is clinically significant to identify new biomarkers for the early diagnosis of bladder cancer [7].
However, at present, the existing biomarkers of bladder cancer have low clinical application value [8]. Therefore, it is of great clinical significance to find a new biomarker that can be used as an early diagnosis of bladder cancer. Applying urine-based markers such as DNA, mRNA and cfDNA to reliably distinguish invasive from noninvasive tumors could transform monitoring and reduce the need for cystoscopy [9]. As an emerging noninvasive approach, the detection of clinical biomarkers in urine by liquid biopsy is increasingly used for diagnosis and follow-up of bladder cancer patients, and noninvasive urine tests are expected to assume greater roles in the clinical evaluation of this disease [10]. Exosomes are nanometer-sized extracellular vesicles carrying cell-specific cargos of proteins, lipids and nucleic acids [11]. Many recent studies have shown the potential of exosomes as a noninvasive, economical and convenient liquid biopsy tool for the diagnosis and prognosis of bladder cancer, with high sensitivity and specificity [12]. Exosomes are abundant in urine. Their lipid bilayers protect genomic and proteomic cytoplasmic contents from degradation by urinary pH and enzymes [13], effectively providing reliable information on the molecular landscapes of bladder cancer [14]. Currently, exosome genes identified in urine show promise as diagnostic biomarkers for bladder cancer [15]. Therefore, collecting urine from bladder cancer patients to detect exosomal mRNAs provides a new direction for diagnosis. This study screened and verified exosomal mRNAs in the urine of bladder cancer patients and healthy controls, and preliminarily explored the diagnostic value of differential genes, to achieve a noninvasive diagnosis of bladder cancer, improve patient prognosis and increase overall survival rate.
Materials and methods Clinical dataCase group: collected the morning urine and clinical pathological data of patients admitted to the Affiliated Hospital of Chengde Medical College from February 2022 to February 2023 who were pathologically diagnosed with bladder cancer. Inclusive criteria: (1) all tissue samples of patients with bladder cancer were pathologically confirmed as bladder cancer; (2) no malignant tumors other than bladder tumors and (3) no malignant tumors other than bladder tumors. Exclusion criteria: (1) patients with concurrent urinary tract infections; (2) patients who give up treatment or transfer to another hospital during the treatment period and (3) patients with other major organ injuries or functional impairments.
Control group: collect morning urine samples from healthy individuals who were matched to the case group in terms of gender and age during the same period. Inclusive criteria: (1) no chronic disease history such as diabetes and hypertension; (2) no history of malignant tumor diseases; (3) no significant organ damage or dysfunction. Exclusion criteria: previous history of chronic urinary system diseases.
All participants in the above admission groups voluntarily participated in this experiment and signed an informed consent form, which was finally approved by the ethics committee.
Experimental methods Urine sample collection and extracellular vesicle extractionCollection: 100 ml of preoperative morning urine from patients in the case group and 100 ml of morning urine from healthy individuals undergoing physical examination. Centrifuge 2000 g in a 50-ml centrifuge tube at 4 °C for 15 min, discard the sediment and refrigerate the supernatant in a −80 °C freezer for subsequent experiments. Next, the extracellular vesicles were extracted using differential ultracentrifugation. The supernatant of the centrifuged urine was taken, and the precipitate was discarded by centrifugation at 4 °C for 30 min at 10000 g. The supernatant was then centrifuged at 4 °C for 70 min at 100000 g using an ultracentrifugation machine. Discard the supernatant, resuspend the precipitate obtained from pre-cooled PBS at 4 °C and centrifuge at 100000 g for 70 min. Discard the supernatant, resuspend the extracellular vesicles with 100 ml of pre-cooled PBS, and store them in an EP tube at −80 °C.
Electron microscopy observation of exosome morphologyTake 20 µl of extracellular vesicle suspension and drop it into the copper mesh of the electron microscope in the form of water droplets. Leave the droplet on the copper mesh for a moment (about 1 min), fix it with phosphotungstic acid solution negative staining for 1–10 min, dry the filter paper naturally at room temperature, observe and take photos under a biological transmission electron microscope.
Detection of extracellular vesicle particle size and concentration using nanoparticle electric diameter (nanoparticle tracking analysis)Only after passing the instrument performance test with a standard sample can the extracellular vesicle sample be loaded. It is important to perform gradient dilution to avoid sample blockage of the injection needle. Separate the extracellular vesicles, and the sample size is generally 2 μ L-100 μ Unequal L, machine detection and zetaview soft analysis to obtain particle concentration within a specific particle size range.
Western blot detection of expression of extracellular vesicle marker proteinsExtract the protein from the exocrine body, detect the protein concentration and then carry out the steps of SDS-PAGE gel electrophoresis to separate the protein, transfer the membrane, and so on, put it in 5% skim milk for sealing, and tris buffered saline with tween washing for three times. Incubate the membrane with a dilution of primary antibody (1 : 20000 dilution of CD63 antibody and 1 : 2000 dilution of CD81 antibody) overnight at 4 °C, and then incubate at room temperature with a 1 : 5000 dilution of secondary antibody for darkroom development.
Extraction and RNA sep of total RNA from urine exosomesThree urine samples were randomly selected from both the case group and the control group, and extracellular vesicles were extracted using differential ultracentrifugation. The samples were sent to Kideo Biotech for library construction and sequencing analysis, and two differentially expressed genes were screened. After obtaining the differentially expressed genes, we performed gene ontology (GO) functional analysis and kyoto encyclopedia of genes and genomes (KEGG) pathway analysis on the differentially expressed genes.
Real-time fluorescence quantitative PCR detection of differential gene expressionExtract RNA from the extracted extracellular vesicle samples using trizol lysis and measure the total RNA concentration. Take 2 µl of RNA samples and reverse transcribe them into cDNA using a two-step method according to the instructions of the reverse transcription kit. Take 1 µl of cDNA template and perform a PCR reaction in a 20 µl reaction system. Pre denature at 95 °C for 1 min for one cycle, denature at 95 °C for 10 s, and anneal at 60 °C for 30 s. Amplify the PCR using an Applied Biosystems 7500 Fast fluorescence quantitative PCR instrument for 40 cycles and collect data. The primer sequence is shown in Table 1. Each sample was sequenced three times, and the average value was taken as the result.
Table 1 - Differential gene primer sequences Gene Forward primer sequence (5′~3′) Human TMEFF1F TGTGAGGGAGTCTGACGTAAG Human TMEFF1R TGTATGGCACTGAAATTGGCA Human ACBD7F ATTGCGTGTCCAGGAATGCTA Human ACBD7R AAATATAGGCACTCGTCGCATC Human SDPR F CATCCGGGACAACTCACAGG Human SDPR R CAGCGTCTAGCATGTTCACCA Human LRRC31F GGAGAAACTAAGCCCCAGACT Human LRRC31R TGGGTTGGGAATCACTTGTTTTA Human LRRC15F TGCCCTAGCGAGTGTACCT Human LRRC15R GATGTGCGTGTTGAGGATCTG Human EYA1 F CACCACAGATTTACCCTTCCAAC Human EYA1 R GTACGTGGCATAGGCTGTAGC Human ISLR F CGACTGTGGGGAAAAGTATGG Human ISLR R GGCTCAGTGTAGTCACATTGG Human SCG2 F TCAACGATGAGATGAAACGCTC Human SCG2 R TTTGCCCATTCTGTAACCTCC Human COL6A2 F GACTCCACCGAGATCGACCA Human COL6A2 R CTTGTAGCACTCTCCGTAGGC Human SDHD F ATTTCTTCAGGACCGACCTATCC Human SDHD R CAGCCTTGGAGCCAGAATG Human MMP1F AAAATTACACGCCAGATTTGCO Human MMP1R GGTGTGACATTACTCCAGAGTT Human NTRK1 F AACCTCACCATCGTGAAGAGT Human NTRK1 R TGAAGGAGAGATTCAGGCGACMeasurement data that follow a normal distribution are expressed as means (± SD), while those that do not follow a normal distribution are expressed as median and interquartile intervals. Excel software, GraphPad Prism 8.0, and SPSS 26.0 software were used for data organization and analysis. Student t-tests were used to compare the means that conform to normal distribution and homogeneity of variance between the two groups, with P < 0.05 indicating statistically significant differences. Nonparametric tests, such as the Mann–Whitney U test, are used to compare data that does not conform to normal distribution or homogeneity of variance between two groups. P < 0.05 indicates a statistically significant difference. Count data is represented by n, rows χ2 inspection. The correlation of two variables was analyzed by Spearman correlation analysis, and the receiver operating charateristic curve (ROC) curve was drawn to analyze the diagnostic value of urinary exosome genes in bladder cancer. All statistical results are double-sided tests, with testing criteria set α = 0.05; P < 0.05 indicates a statistically significant difference.
ResultsIn the case group of bladder cancer, 60 patients were included, including 49 males and 11 females. Their ages ranged from 44 to 89 years old. According to the American Joint Committee on Cancer 8th edition tumor node metastasis (TNM) staging, there were 36 cases in stage I, 21 cases in stage II and 3 cases in stage III. According to the 2016 WHO grading system, there were 25 cases classified as low-grade pathology and 35 cases as high-grade pathology. There were 15 cases with a tumor diameter <1 cm and 45 cases with diameter ≥1 cm. There were 34 cases with less than three primary lesions and 26 cases with more than three primary lesions. The control group included 40 samples, including 28 males and 12 females, aged 30–65 years old.
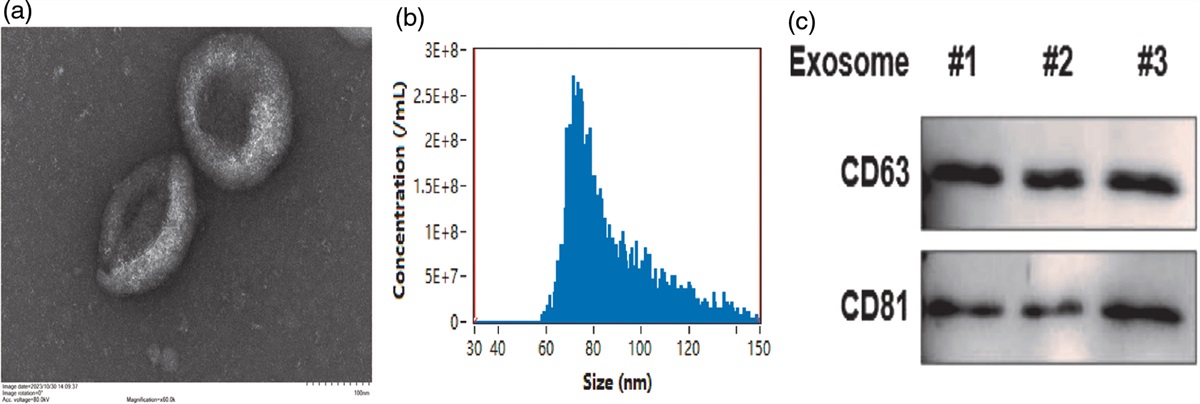
Identification results of urinary exosomesAfter the extraction of two groups of urine exosomes using differential ultracentrifugation, the morphology of the exosomes was observed by transmission electron microscopy (Fig. 1a): they were concave vesicles with similar morphology, with a double-layer membrane structure and an elliptical shape. The diameter of the extracellular vesicles in the nanoparticle diameter detection sample is about 87.6 nm, with a concentration of 1.22E + 10 particles/ml (Fig. 1b), and the diameter size is within the range of the diameter of the extracellular vesicles. A western blot was used to detect the expression of markers CD63 and CD81 on the extracellular vesicle membrane (Fig. 1c), and the results showed a significant increase in the expression of extracellular vesicle-specific proteins in urine. Based on the above experimental results, it can be proven that the samples extracted by differential ultracentrifugation are exosomes.
 Fig. 1:
 Identification of extracellular vesicles in urine samples. (a) The electron microscopy results, as shown in the above figure, show that the extracellular vesicles are concave and vesicular in shape, with a relatively clean background and normal morphological structure. (b) The particle size analysis results showed that the average particle size of extracellular vesicles was 87.6 nm, with a concentration of 1.22E + 10 particles/ml, which was consistent with the size of extracellular vesicles. (c) The western blot (WB) results indicate that the expression of label proteins CD63 and CD81 was detected in all extracted exosomes, indicating that the quality of exosome samples is appropriate.
High throughput sequencing results of urinary exosomesThree urine samples were randomly taken from the bladder cancer case group and the control group, and the RNA-seq analysis of the urine exosomes was carried out. The differential gene expression was screened according to the false discovery rate (FDR) < 0.05 and | log2FC |>1 conditions. The results showed that, compared with the normal people, there were 189 significant genes in the urine exosomes of bladder cancer patients, of which 33 were significantly upregulated and 156 were downregulated. Cluster analysis of the differential gene expression patterns of the two groups of samples (Fig. 2a): red indicates that the expression in the urinary exocrine body of the bladder cancer group is increased, and green indicates that the expression is decreased. A volcano plot (Fig. 2b) was created by statistical analysis of differentially expressed genes between groups. Red represents upregulation of expression, green represents downregulation of expression, red and green dots indicate differences in gene expression (with a judgment criterion of FDR < 0.05 and a difference multiple of more than twice), and black dots indicate no difference. Through GO enrichment and KEGG analysis (Fig. 2c,d), the above differentially expressed genes may participate in the occurrence and development of bladder cancer through the MAPK signaling pathway, PPAR signaling pathway, PI3K Akt signaling pathway, Hippo signaling pathway, and so on, affect protein metabolism, lipid metabolism, RNA enzyme activity, polysaccharide synthesis, signal transduction and other biological processes and participate in cell proliferation, death, movement, adhesion, cell differentiation and cell signal transduction.
 Fig. 2:
 RNA sep sequencing analysis of urinary exosomes in bladder cancer group and control group. (a) Cluster analysis of differential gene expression patterns. (b) In the volcano map, red indicates an increase in expression level, green indicates a decrease in expression level, and black dots indicate no difference. (c) GO classification map of differentially expressed genes between two groups. (d) KEGG enrichment map of differentially expressed genes between two groups.
Verification of high-throughput results of urinary exosomes by quantitative real-time PCR detectionFinally, we identified the 12 genes with the most significant differential expression: TMEFF1, SDPR, LRRC31, ACBD7, LRRC15 and EYA1 were highly expressed, while SDHD, MMP1, ISLR, SCG2, NTPK1 and COL6A2 were low expressed. According to the 12 genes screened above, primers were designed and quantitative real-time (qRT) PCR was carried out in 100 urine exocrine samples of the two groups. The results showed that the expression of TMEFF1, SDPR and ACBD7 in the bladder cancer case group was significantly higher than that in the healthy control group (Fig. 3a), and the expression of SCG2 and COL6A2 in the bladder cancer case group was significantly lower than that in the healthy control group (Fig. 3b), with statistically significant differences (P < 0.05). However, there was no statistically significant difference (P > 0.05) between the LRRC31, LRRC15, EYA1, SDHD, MMP1, ISLR and NTPK1 groups.
 Fig. 3:
 The expression of differentially expressed genes in urinary exosomes of the bladder cancer case group and normal control group. (a) The expression of TMEFF1, ACBD7 and SDPR detected by q-PT-PCR was significantly upregulated in the bladder cancer group compared with the normal control group (P < 0.01). (b) The expression of SCG2 and COL6A2 detected by q-PT-PCR in the bladder cancer group was significantly lower than that in the normal control group (P < 0.05). Q-RT-PCR, quantitative real-time PCR.
The relationship between the expression of SDPR in urinary exocrine bodies and clinicopathological parameters in patients with bladder cancerAccording to the expression level of SDPR in the urine of bladder cancer patients, all bladder cancer patients were divided into the high expression group and the low expression group of SDPR. The results showed (Table 2) that the expression level of SDPR in the urinary exocrine body was related to the histological type, pathological grade and TNM stage of bladder cancer patients (all P < 0.05), but not to the age, gender, tumor size and number of tumors (all P > 0.05).
Table 2 - The expression of differentially expressed genes in urinary exosomes of bladder cancer case group and normal control group Variables n Lower expression Higher expression χ2 P value n % n % Age 0.486 0.486 <65 24 10 34.5 13 43.3 ≥65 36 19 64.5 17 56.7 Gender 0.074 0.786 Male 48 24 82.8 24 80.0 Female 11 5 17.2 6 20.0 Tumor size 0.674 0.412 <1 cm 15 6 20.7 9 30.0 ≥1 cm 44 23 79.3 21 70.0 Tumor number 0.141 0.708 <3 34 16 55.2 18 60.0 ≥3 25 13 44.8 12 40.0 Histological types 4.984 0.026 NMIBC 27 9 31.0 18 60.0 MIBC 32 20 69.0 12 40.0 Pathological grading 4.051 0.044 Low-grade 24 8 27.6 16 53.3 High-grade 36 21 72.4 14 46.7 Clinical stages 4.965 0.026 I 35 13 44.8 22 73.3 II-III 24 16 55.2 8 26.7MIBC, muscle invasive bladder cancer; NMIBC, non-muscle invasive bladder cancer.
TMEFF1, SDPR, ACBD7, SCG2 and COL6A2 are significantly expressed in the bladder cancer case group than in the healthy control group. To further evaluate the diagnostic value of the five differential genes in bladder cancer, the ROC curve is used for analysis (as shown in Fig. 4) and the cutoff value, sensitivity, specificity and area under the curve (AUC) are calculated (Table 3) to evaluate the diagnostic value of the differential genes in bladder cancer.
Gene AUC 95% CI P value Sensitivity Specificity Cutoff value TMEFF1 0.6934 58.54–80.15% <0.05 42.11% 90.00% 0.3211 ACBD7 0.7239 60.99–83.80% <0.05 47.37% 96.36% 0.4372 SDPR 0.7746 67.73–87.19% <0.001 64.86% 81.38% 0.4622 SCG2 0.6396 52.34–75.58% <0.05 73.53% 61.02% 0.3455 COL6A2 0.6610 54.18–78.02% <0.05 76.47% 58.18% 0.3465AUC, area under the curve; ROC, receiver operating charateristic curve.
 Fig. 4:
 ROC curves of seven genes with statistical differences, with SDPR having the highest AUC. (a) The ROC curves of the three upregulated genes TMEFF1, ACBD7 and SDPR. (b) The ROC curves of the two downregulated genes COL6A and SCG2. AUC, area under the curve; ROC, receiver operating charateristic curve.
Spearman analysis of related factors in the diagnosis of bladder cancerWith the presence or absence of bladder cancer lesions as the dependent variable, Spearman correlation analysis was performed on the expression levels of five differential genes in the urine exocrine body of the case group and the normal control group. According to the results of the correlation coefficient r and P value, we speculated that TMEFF1, SDPR and ACBD7 were related to the occurrence of bladder cancer (0.3 < r < 0.5; P < 0.05), while COL6A, SCG2 were not related to the diagnosis of bladder cancer (0<| r |<0.3) (Table 4).
Table 4 - Spearman correlation analysis Gene Correlation coefficient P value TMEFF1 0.326 <0.05 ACBD7 0.381 <0.001 SDPR 0.466 <0.001 SCG2 −0.233 <0.05 COL6A2 −0.271 <0.05According to the above analysis, the expression levels of TMEFF1, SDPR and ACBD7 in the urinary exocrine body are related to the occurrence of bladder cancer. To further evaluate the diagnostic value of these three differential genes in bladder cancer, the ROC curve was used for joint diagnostic analysis and the cutoff value, sensitivity, specificity and AUC were calculated. The combined diagnosis of TMEFF1, SDPR and ACBD7 for AUC was 0.7775, with a sensitivity of 67.27% and a specificity of 76.32% (Fig. 5a); The combined diagnosis of TMEFF1 and SDPR for AUC was 0.7526, with a sensitivity of 65.45% and a specificity of 81.58% (Fig. 5b); The combined diagnosis of TMEFF1 and ACBD7 for AUC was 0.7086, with a sensitivity of 85.45% and a specificity of 55.26% (Fig. 5c); The combined diagnosis of SDPR and ACBD7 for AUC was 0.7945, with a sensitivity of 67.27% and a specificity of 76.32% (Fig. 5d).
 Fig. 5:
 ROC curve results of combined diagnosis of three genes TMEFF1, SDPR and ACBD7 related to bladder cancer. (a) TMEFF1, SDPR, ACBD7 combined. (b) TMEFF1 and SDPR combined. (c) TMEFF1 and ACBD7 combined. (d) ACBD7, SDPR joint. ROC, receiver operating charateristic curve.
DiscussionCurrently, pathological tissue biopsy is still the gold standard for bladder cancer diagnosis. However, tissue biopsy has certain limitations in accessibility, repeatability, patient age, cost and time. Some may even lead to harmful clinical complications. Therefore, liquid biopsy, an emerging noninvasive diagnostic approach, is of great significance for bladder cancer patients.
Liquid biopsy of tumors includes circulating tumor DNA (ctDNA), circulating tumor cells (CTCs), tumor-derived exosomes and other extracellular vesicles. The number of detectable CTCs is very limited [16] and they seem more suitable for assessing late-stage disease [17]. ctDNA reflects information from apoptotic or dead tumor cells in a limited manner. In comparison, exosomes are continuously released by cells (including cancer cells), highly abundant and enriched with biological information such as cellular DNA, RNA and proteins [18]. They can provide insights into living tumor cells [19] and show great promise for early lesion detection.
Currently, exosomes have emerged as a platform with potentially broader and complementary applications. Early exosome research mainly focused on microRNAs (miRNAs) [20]. However, subsequent extracellular vesicle RNA studies based on high-throughput sequencing reported all RNA biotypes are contained in extracellular vesicles, including messenger RNAs (mRNAs) [21]. RNA sequencing (RNA-seq) is now being applied to detect cerebrospinal fluid [22], plasma and urine [23] samples. More typically measured in validation studies for clinical use are mRNA biomarkers, which can not only quantify gene expression levels and detect tumor-specific somatic alterations but may also provide information on disease status or progression [24].
In this study, urine samples were collected from clinically diagnosed patients and healthy controls. Exosomes were extracted, and high-throughput sequencing (RNA-seq) was utilized to determine mRNA expression profiles in urinary exosomes and identify differentially expressed genes. Bioinformatic analysis predicted the major biological functions of differential genes and related signaling pathways. RT-PCR, Spearman analysis and receiver operating charateristic curve (ROC) curves evaluated the diagnostic value of differential genes for bladder cancer to screen potential novel biomarkers. The results showed TMEFF1, SDPR and ACBD7 were correlated with bladder cancer occurrence. Combined detection of exosomal SDPR and ACBD7 had higher clinical significance. This study also has some limitations. The sample size was small. The sensitivity and specificity of ROC curves were limited. Therefore, future studies will expand sample sizes, use cultured cell lines to validate differential gene expression, further explore the impacts of differential genes on bladder cancer development, and maximize their diagnostic value.
In summary, urinary exosomal TMEFF1, SDPR and ACBD7 have certain clinical value for bladder cancer diagnosis. As a noninvasive diagnostic assessment, it is more acceptable to patients and promising for clinical application. Meanwhile, issues such as low purity, yield, sensitivity and specificity of exosome extraction pose great challenges for academic research and practical application.
Conflicts of interestThere are no conflicts of interest.
References 1. Siegel RL, Miller KD, Jemal A. Cancer statistics, 2020. CA Cancer J Clin. 2020; 70:7–30. 2. Chen W, Zheng R, Baade PD, Zhang S, Zeng H, et al. Cancer statistics in China, 2015. CA Cancer J Clin. 2016; 66:115–132. 3. Dobruch J, Oszczudłowski M. Bladder cancer: current challenges and future directions. Medicina (Kaunas). 2021; 57::749. 4. Lenis AT, Lec PM, Chamie K, Mshs MD. Bladder cancer: a review. JAMA. 2020; 324:1980–1991. 5. Sylvester RJ, Rodríguez O, Hernández V, Turturica D, Bauerová L, Bruins HM, et al. European Association of Urology (EAU) Prognostic Factor Risk Groups for Non-muscle-invasive Bladder Cancer (NMIBC) Incorporating the WHO 2004/2016 and WHO 1973 classification systems for grade: an update from the EAU NMIBC guidelines panel. Eur Urol. 2021; 79:480–488. 6. Witjes JA, Bruins HM, Cathomas R, Compérat EM, Cowan NC, Gakis G, et al. European Association of Urology guidelines on muscle-invasive and metastatic bladder cancer: summary of the 2020 guidelines. Eur Urol. 2021; 79(1):82–104. 7. Matuszczak M, Kiljańczyk A, Salagierski M. A liquid biopsy in bladder cancer-the current landscape in urinary biomarkers. Int J Mol Sci. 2022;23:8597. 8. Soria F, Krabbe L-M, Todenhöfer T, Dobruch J, Mitra AP, et al. Molecular markers in bladder cancer. World J Urol. 2019; 37:31–40. 9. Maas M, Bedke J, Stenzl A, Todenhöfer T. Can urinary biomarkers replace cystoscopy? World J Urol. 2019; 37:1741–1749. 10. Crocetto F, Barone B, Ferro M, Busetto GM, La Civita E, Buonerba C, et al. Liquid biopsy in bladder cancer: state of the art and future perspectives. Crit Rev Oncol Hematol. 2022; 170:103577. 11. Zhang Y, Liu Y, Liu H, Tang WH. Exosomes: biogenesis, biologic function and clinical potential. Cell Biosci. 2019; 9:19. 12. Piao X-M, You C, Byun YJ, Kang HW, Noh J, Lee J, et al. Role of exosomal miRNA in bladder cancer: a promising liquid biopsy biomarker. Int J Mol Sci. 2021; 22:1713. 13. Mulcahy LA, Pink RC, Carter DR. Routes and mechanisms of extracellular vesicle uptake. J Extracell Vesicles. 2014; 3:24641. 14. Georgantzoglou N, Pergaris A, Masaoutis C, Theocharis S. Extracellular vesicles as biomarkers carriers in bladder cancer: diagnosis, surveillance, and treatment. Int J Mol Sci. 2021; 22:2744.
留言 (0)