
記住我


NHANES is a survey of population health and nutritional status conducted by the Centers for Disease Control and Prevention in the United States. They used a complex, multistage probability design to conduct a sample survey of the unincorporated civilian population residing in the 50 states and D.C. Comprehensive data collection including demographic, socioeconomic, examination related to health and dietary information have been conducted biennially.
In this study, we selected six consecutive NHANES cycles from 2007 to 2020 due to the lack of Vitamin D (VD) measurements in the data prior to 2007. Besides, data collection was incomplete in the cycle of 2019–2020 owing to the coronavirus disease 2019 (COVID-19) pandemic. Therefore, data collected from 2019 to March 2020 were combined with data from the NHANES 2017–2018 cycle to form a nationally representative sample of NHANES 2017-March 2020 pre-pandemic data. All databases were available from the NHANES website (https://www.cdc.gov/nchs/nhanes/index.htm).
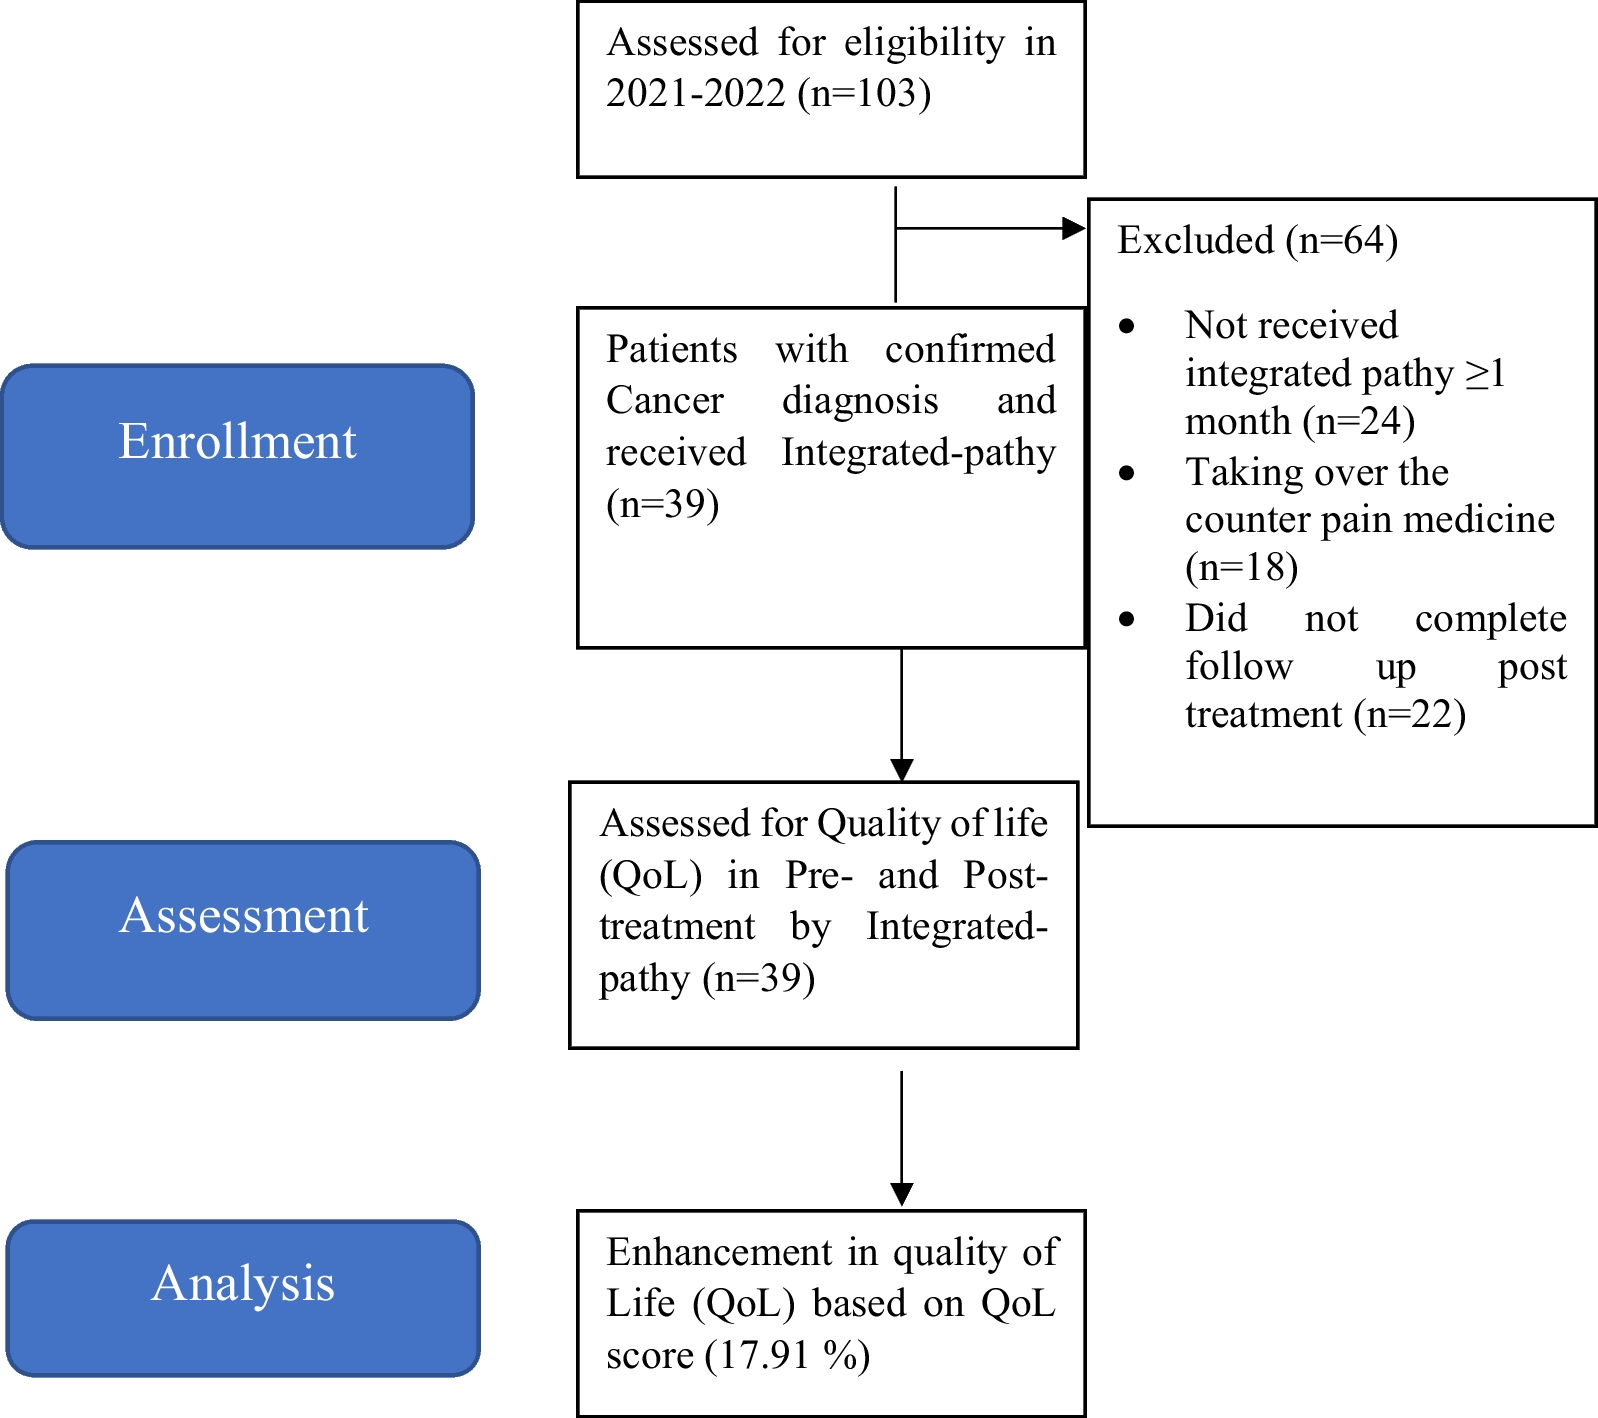
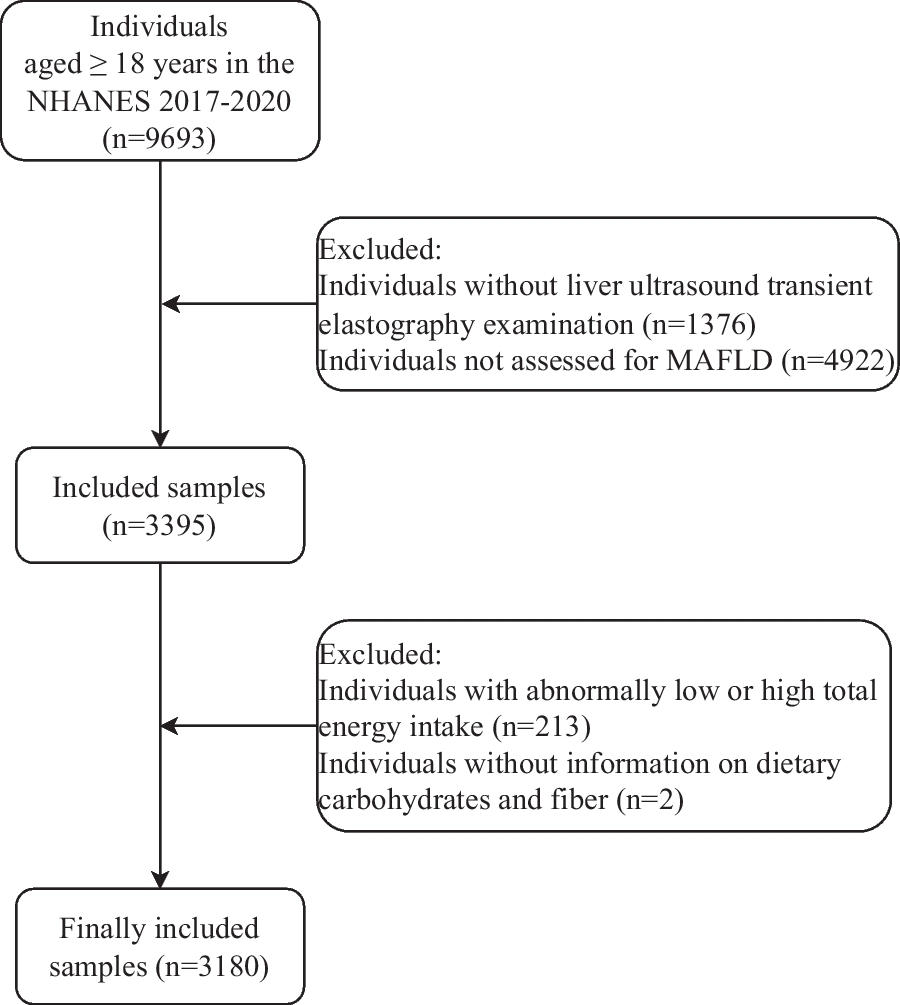
In total, 20,488 participants were enrolled in this study (Fig. 1). The exclusion criteria include: (1) Age under 20 years; (2) Individuals without data of HBV testing; (3) Participants without data of dietary calcium intake; (4) Participants without data of serum calcium; (5) Missing of other variables including education, marital status, BMI, smoking, diabetes, hypertension and HDL.
Fig. 1
Flow chart for inclusion and exclusion of research subjects
HBV infectionThe participants' serum samples were collected, processed and frozen (− 30 °C), and then transported to the CDC. The test was carried out by professionals through the VITROS HBsAg reagent kit and VITROS immune diagnostic products HBsAg calibrator on the VITROS ECi/ECiQ immune diagnostic systems and the VITROS 3600 immune diagnostic system. Hepatitis B surface antigen positive participants were considered as HBV carriers or infected. The variable of HBV infection was recorded as a binary variable (1 = infected with HBV; 0 = uninfected with HBV).
CalciumTwo types of calcium exposure were estimated: dietary calcium intake (mg) and serum calcium (mmol/L). The assessment of dietary calcium was obtained from the 24-h dietary recall questionnaire which was self-reported by the participants. Then the USDA’s Food Surveys Research Group (FSRG) encoded the data and calculated dietary calcium content according to their Food and Nutrient Database for Dietary Studies [19]. Blood samples were collected and stored in mobile devices by certified laboratory professionals. Serum calcium concentrations was determined by Beckman Synchron LX20(Beckman Coulter, Brea, CA) [20].
CovariatesThe covariates involved in this secondary analysis were selected based on previous studies on HBV infection [10, 21], including demographic characteristics, lifestyle and disease history, and other nutrients ingested through food.
We included the following demographic information: sex, age (≥ 20 years old, all responses of participants aged 80 years and older were coded as “80”), race/ethnicity (Mexican American, Other Hispanic, Non-Hispanic White, Non-Hispanic Black, Other Race), body mass index (BMI, calculated as weight in kilograms divided by height in meters squared, and then rounded to one decimal place, kg/m2), education level (less than high school diploma, high school, more than high school diploma) and marital status (married or living with partner, widowed or divorced or separated, never married). In addition, we also controlled for smoking (whether smoking more than 100 cigarettes in life), diabetes and hypertension as confounding variables. Disease history information was obtained from participants self-reported data, that was whether they were diagnosed as hypertension or diabetes by doctors (yes or no). Some variables were missing too much, such as drinking alcohol. If the missing values were deleted, it will affect the positive rate of HBV infection, so it was not included in the covariate analysis.
The calculation of other dietary substances intake was the same as that of dietary calcium, which was obtained through the 24-h dietary recall questionnaire. Other indicators mainly included fat (g), fatty acid (Saturated fatty acids, Monounsaturated fatty acids, Polyunsaturated fatty acids, g), vitamin [VB6 (mg), VB12 (µg), VC (mg), VD (µg)], folate (µg), caffeine (mg) and high-density lipoprotein (HDL, mmol/L). The detailed methodology for all the examinations were presented on the NHANES website.
Statistical analysisAll analyses were performed by using the R 4.2.2 and SPSS 26.0 software. Since the selected dietary and serum calcium data showed skewed distribution after the normality test, we conducted log10 function conversion to facilitate subsequent data analysis. If the continuous variables which were presented as mean ± standard deviation met the test of homogeneity of variance, the differences between groups were tested by independent sample T test (two groups) or one-way ANOVA (more than two groups). Otherwise, the non-parametric Kruskal–Wallis (K–W) test was used. The categorical variables were expressed as percentages, and the inter-group comparison was performed by Chi-square test. We grouped dietary calcium and serum calcium by using quartile in order to estimate differences in HVB infection and covariates among different calcium levels. As for dietary calcium, Q1 is ≤ 522 mg/day; Q2 is 523–803 mg/day; Q3 is 804–1174 mg/day; Q4 is ≥ 1175 mg/day.
As for serum calcium, Q1 is ≤ 2.30 mmol/L; Q2 is 2.31–2.35 mmol/L; Q3 is 2.36–2.40 mmol/L; Q4 is ≥ 2.41 mmol/L. Pearson correlations were estimated to test the relationship between dietary calcium and serum calcium.
We used logistic regression to investigate the linear relationship between HBV infection and dietary calcium or serum calcium. The association was assessed by the odds ratio (OR) with a 95% confidence interval (CI). Three models were established in this study: simple model (without any adjustment), minimum adjustment model (adjusting partial covariates including age, sex, race/ethnicity, education level, marital status, BMI, smoking, diabetes and hypertension), and complete adjustment model (adjusting fat, SFA, MUFA, PUFA, VB6, VB12, VC, VD, folate, caffeine and HDL, in addition to the covariates included in minimum adjustment model). It should be noted that the value of serum calcium after logarithmic conversion was too low, and the data of serum calcium was almost normal distribution through calculation, so we used the unconverted data for logistic regression analysis. Meanwhile, in order to determine whether the logistic regression model had a good fit with the relationship between study variables and dependent variables, we performed restrictive cubic spline (RCS) analysis with four degrees of freedom (knots at 10th, 50th, and 90th percentiles) by adjusting the covariates included in complete adjustment model.
A p value of less than 0.05 (two-sided) was considered statistically significant.
留言 (0)