
記住我

The model reflects a population of adults with DMO (62 years old, 60% men), 78% of which are anti-VEGF treatment-naïve, as per the intention to treat analysis of the pivotal YOSEMITE and RHINE randomised trials [12]. Base-case analyses compared faricimab treat and extend (T&E) with aflibercept pro re nata (PRN) and ranibizumab PRN. Given bevacizumab is not indicated in DMO but is occasionally used off-label, a comparison was performed as a scenario.
Evidence on the effectiveness of faricimab T&E compared wit relevant comparators was derived from a network meta-analysis (NMA). NMA enabled the effectiveness of faricimab T&E from YOSEMITE and RHINE to be pooled and facilitated indirect comparisons with aflibercept PRN, ranibizumab PRN and bevacizumab PRN.
The model incorporated data on effectiveness, mortality, adverse events, health related quality of life (HRQoL) and costs (direct and indirect) to perform a cost-utility analysis. The analysis took a societal perspective, with a healthcare perspective used in scenario analysis.
2.1 Intervention and ComparatorsThe modelled intervention and comparators and their respective regimens are summarised in Table 1. Faricimab is administered in a treat and extend regimen with a loading phase followed by flexible treatment intervals. This is likely to be standard of care rather than fixed dose, in line with the pivotal randomised trials. Aflibercept, ranibizumab and bevacizumab are administered every 4 weeks during an initial loading phase and then pro re nata thereafter, as required. These regimens reflect the recommended treatment approaches in the UK, including those from the UK expert panel on the use of aflibercept in the treatment of DMO (referred to as monitor and extend) [14]. An additional T&E ranibizumab comparator is included as a scenario, given that this alternative regimen is sometimes used in UK clinical practice and as data were available for this regimen to enable inclusion in the NMA. Data for high-dose (8 mg) aflibercept were not available at the time of analysis, and it is currently not licensed and not recommended by NICE for use in DMO in the UK.Footnote 1 Although brolucizumab has recently been recommended by NICE, it was not included in the analysis as it is not currently used in the routine treatment of people with DMO in the UK and its use is expected to be limited due to potential safety concerns [11].
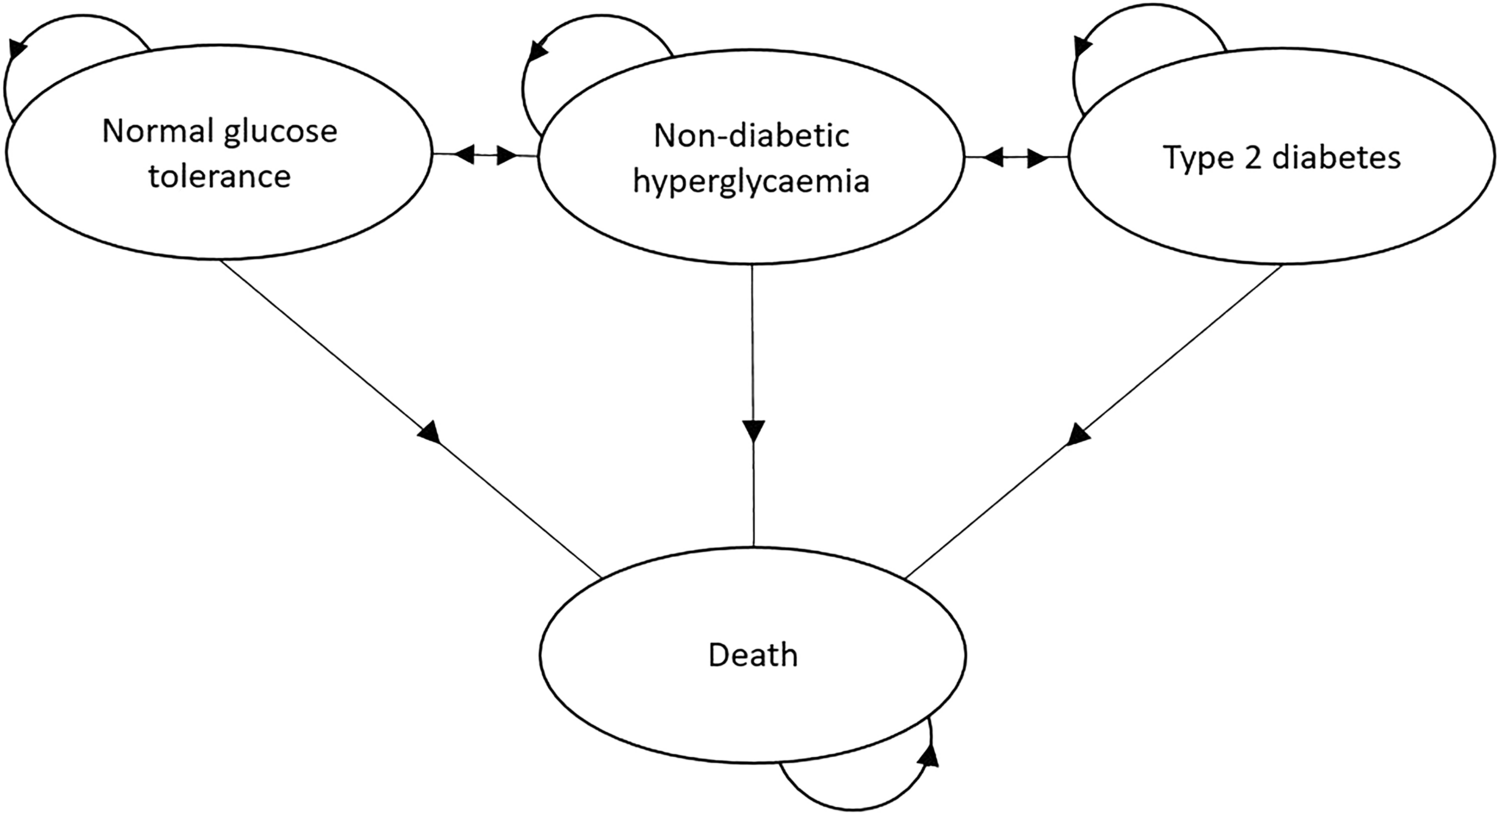
Table 1 Intervention and comparator regimen descriptions and list prices2.2 Model StructureThe model structure is depicted in Figs. 1, and 2 and is designed to describe the natural course of the disease and development of DMO. The DMO cohort state-transition model includes a partial relaxation of the Markov assumption, as the model contains time-dependent probabilities (mortality) and treatment-related tunnel states to segment the cohort according to time on/off treatment. State-transition models are well suited for modelling chronic and degenerative diseases, explicitly allowing for time and treatment pathways to appropriately account for differences in costs and quality of life [19]. There is also precedence for the use of similar conceptual model in age-related macular degeneration (AMD), from UK guidelines which included extensive review of the existing literature to inform the modelling approach [20].
Fig. 1
Model structure—visual acuity health state categories. VA, visual acuity
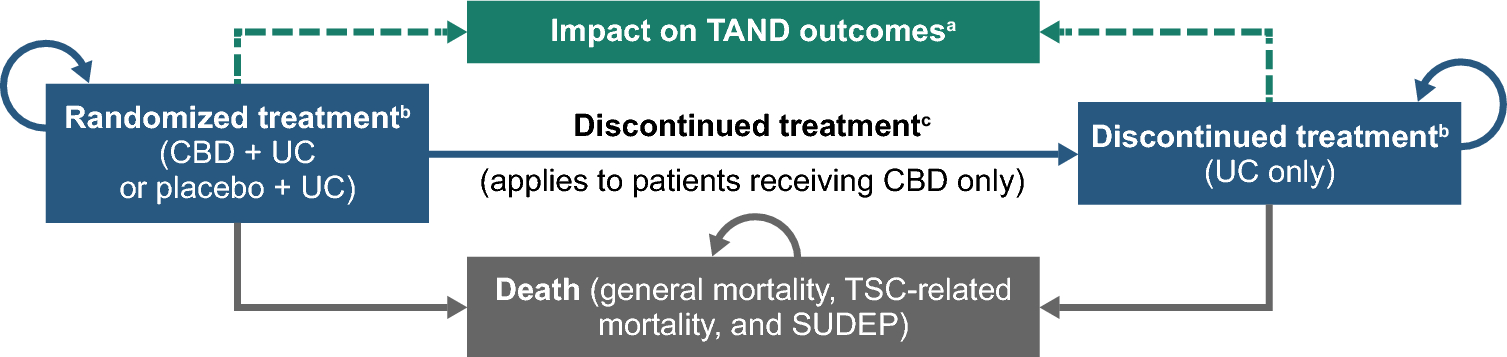
Fig. 2
Model structure – Treatment pathway health state categories. tx, treatment
The model consists of 6 categories of vision-related health states determined by visual acuity (VA) score (> 85, 85–71, 70–56, 55–41, 40–26 and ≤ 25), where a lower score indicates worse vision (see Fig. 1). The score corresponds to letters correctly identified in a visual acuity test.
The model cohort is distributed across these health states at baseline [see Supplementary Material (Online Resource) Table A1] on the basis of the proportion of patients included in the YOSEMITE and RHINE clinical trials [12]. Each eye is modelled independently, assuming that all patients in the cohort have at least one eye with DMO, and 46.5% have DMO in both eyes at baseline. This was based on previous NICE appraisals and validated in consultation with three UK experts who provided input for all expert clinical inputs [9, 21]. The model differentiates three periods following the clinical pattern typically observed for DMO:
Year 1: long loading phase where most vision improvements occur
Year 2: characterized by a stabilization of the disease and maintenance of vision gains previously achieved
Year 3 and beyond: reduced treatment intensity and long-term maintenance.
The condition of patients in the cohort can be stable, where they remain in the same visual acuity state, or they can transition between states (increased or decreased visual acuity). In Year 1 patients can move up two health states (e.g. VA 40–26 to VA 70–56) and down one health state (e.g. VA 70–56 to VA 55–41). In Year 2 patients can move up or down one health state and in Year 3 patients can move down up to two health states. This was based upon clinical patterns observed in clinical trials with long follow-up, including Protocol T [22], and reflects that patients are unlikely to regain vision in the long term. Non-treatment-related costs (i.e. determined by visual impairment) and utility values are assigned by VA health state category.
The visual acuity health states are combined with the treatment pathway states (see Fig. 2) to appropriately apply costs of treatment (acquisition, administration and monitoring), health state utilities and treatment related disutility values to the proportion of the cohort on/off treatment to reflect the impact of greater vision loss for those who discontinue treatment. The model assumed treatment duration of 5 years, with 15% of patients remaining on long-term treatment, which aligns with a retrospective cohort study [23] and was validated in consultation with UK clinical experts [21]. The dotted line indicates transitions that can only be made for patients with emerging involvement of the second eye.
2.3 Model Input ParametersThe model required estimation of key model input parameters including transition probabilities and treatment effectiveness, health state utility values, adverse events, direct costs and indirect costs.
2.3.1 EffectivenessTransition probabilities between visual acuity states in the faricimab T&E arm were derived from pooled data from the YOSEMITE and RHINE trials [12] by fitting a multistate model in R programming language (msm package). The best fitting model contained four states [see Supplementary Material, (Online Resource) Fig. A2], which were defined corresponding to a transition of one or two VA state increase, one VA state decrease or no transition: state 1, gain of at least 22.5 letters; state 2, gain of between 7.5 and 22.5 letters; state 3, between gain of 7.5 and loss of 7.5 letters (i.e. stable); and state 4, loss of 7.5 or more letters. In the first year, transitions depend on baseline visual acuity score given it is an important prognostic factor in treatment effectiveness. Thereafter, transitions are independent of baseline score.
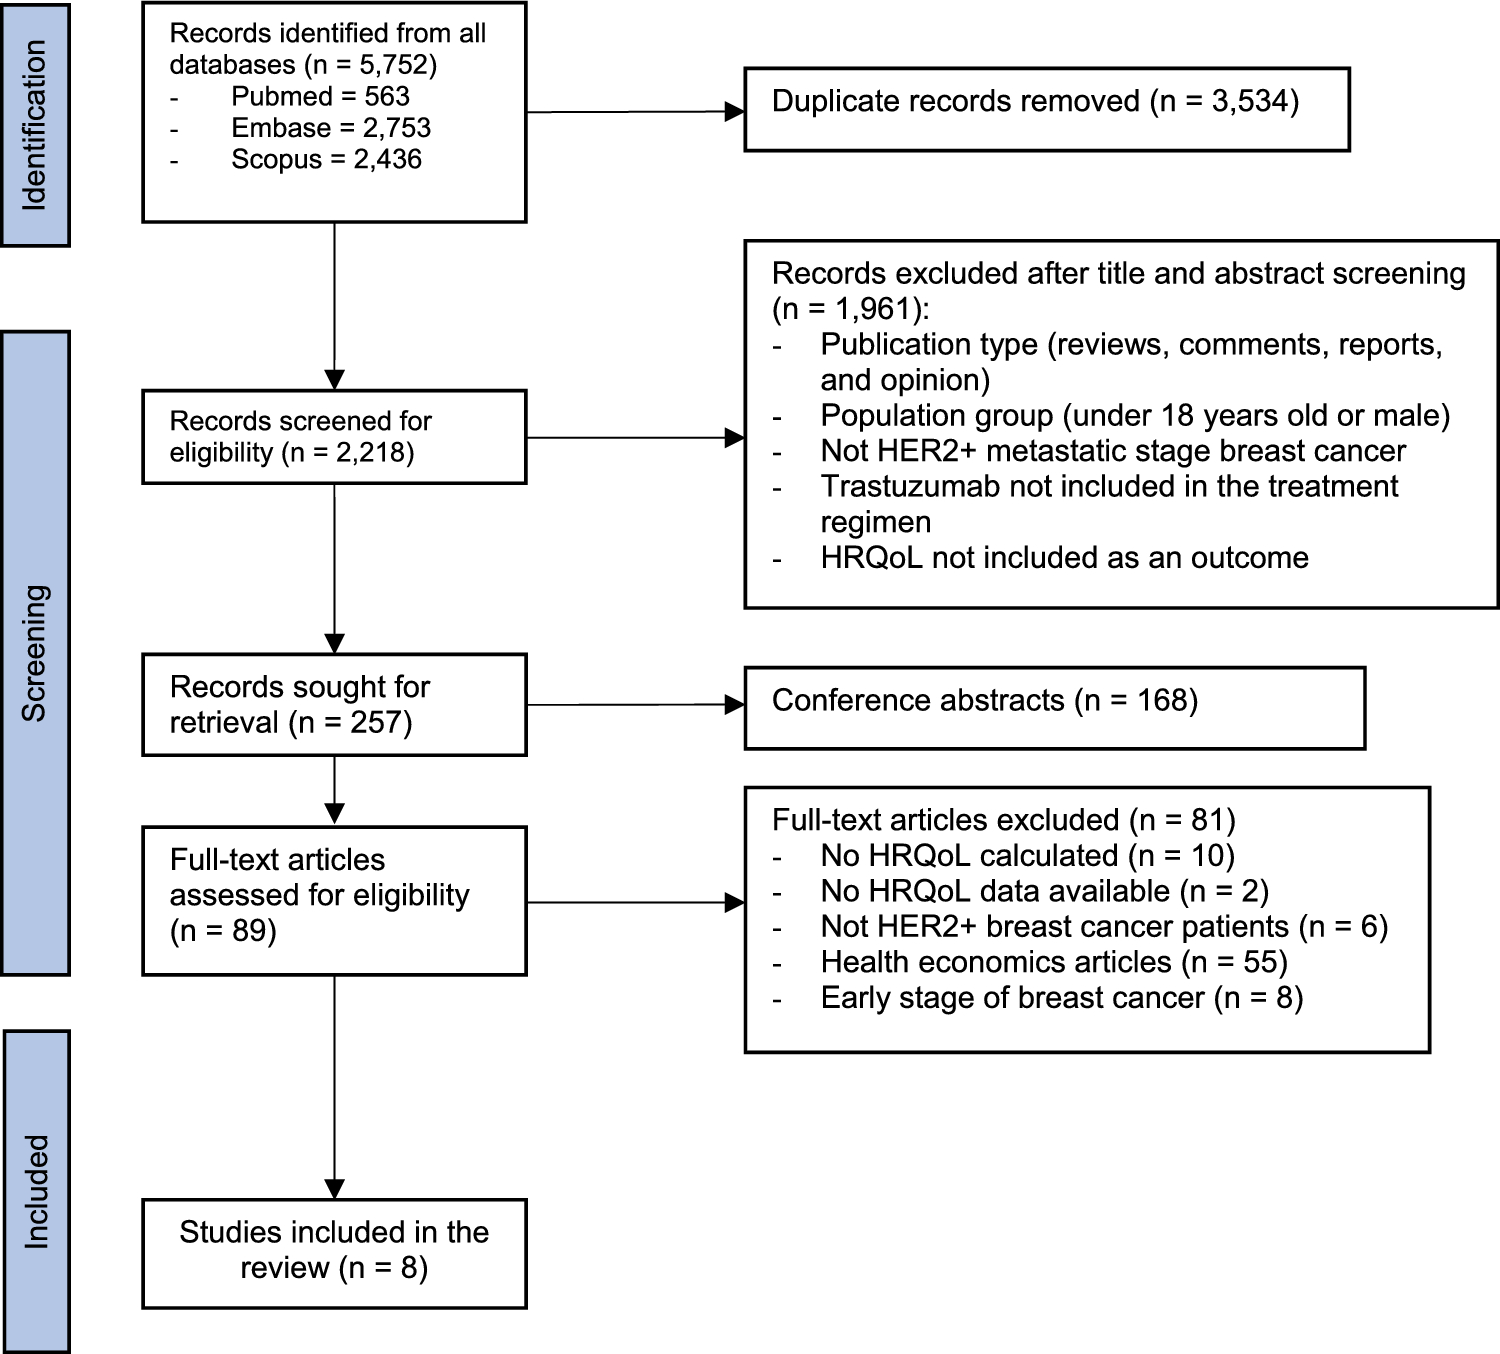
Effectiveness data for model comparators was informed by an NMA, described in full elsewhere [24]. In brief, a systematic literature review was performed to identify randomised controlled trials containing relevant comparators (including placebo/sham to form networks) in patients with DMO older than 18 years. Outcomes include changes in baseline visual acuity, change in retinal thickness, injection frequency and adverse events. The NMA showed that faricimab T&E demonstrated superior or comparable efficacy in terms of visual acuity outcomes compared with the relevant comparator anti-VEGF treatment regimens for DMO after 1 year [25]. Therefore, effectiveness for year 1 is based on YOSEMITE and RHINE for faricimab T&E and the NMA for all comparators. Beyond year 1, the second year treatment effect derived from YOSEMITE and RHINE for faricimab T&E is applied to all interventions during treatment [22].
Background mortality was informed by UK life tables, using data from Office for National Statistics for years 2017–2019, adjusted for increased mortality amongst a diabetic population and the impact of visual impairment [20, 26, 27].
2.3.2 Adverse EventsTreatment-related adverse event probabilities were informed by YOSEMITE and RHINE for faricimab T&E and applied for all interventions on the basis of the finding from the NMA of comparable adverse event results. Costs and disutility were taken from a UK guideline in nAMD [20] and are shown in Supplementary Material (Online Resource) Table A3.
2.3.3 CostsCosts were presented in 2019/2020 prices and were made up of both direct healthcare payer costs to the UK National Health Service (NHS) and Personal Social Services (PSS), including ongoing supportive care, as well as indirect costs of DMO treatment (productivity impacts and informal care costs). Travel costs were not included given their negligible impact. In the base-case these wider personal and societal costs were included given their importance in relation to the impact of DMO on patients and society. A 2018 UK study estimated indirect costs of sight loss due to AMD, cataract, diabetic retinopathy, glaucoma and under-corrected refractive error of £5.65 billion, which was nearly double the value of estimated direct healthcare costs [28]. A scenario analysis was also presented considering only NHS costs.
Acquisition costs (see Table 1) were taken from list prices available from the British National Formulary [15,16,17,18]. The proportion of patients receiving faricimab at 4, 8, 12 or 16 weekly doses after the loading phase in years 1 and 2 was informed by YOSEMITE and RHINE pooled data [12]. It was assumed that no additional monitoring is required between treatment visits during years 1 and 2 as per T&E regimen.
Frequency of administration for PRN regimens in year 1 was informed by the NMA [24], with the number of injections apportioned over the year. In year 2 and beyond, administration frequency and monitoring visits throughout treatment was informed by a randomised trial of the three comparator treatments and an extension cohort study (Protocol T) of the same group of patients. The same source was used to inform monitoring in the faricimab T&E arm after 2 years, where patients are likely to move to PRN regimen. To account only for additional monitoring costs, this was implemented in the model as the difference between number of visits and number of treatments. The resultant mean frequency of administration and monitoring visits are presented in Supplementary Material (Online Resource) Table A4, alongside the annual acquisition costs in year 1 to year 3 for each treatment.
Administration costs (see Table 2) were informed by a UK clinical guideline and a NICE technology appraisal in nAMD [20, 29]. Costs were composed of a consultant-led outpatient attendance, an optical coherence tomography (OCT) and a cost of the injection, where unit costs were informed by the National Schedule of NHS costs [30].
Table 2 Administration, monitoring and supportive care costs and sourcesSupportive care costs (Table 2) were sourced from a UK guideline and were composed of low vision and blindness resources which fall upon NHS and Personal Social Services (vision-related depression, low vision rehabilitation, hip replacement due to falls, residential and community care) and wider societal costs (housing and council tax benefit, social security and governmental tax allowances) [20]. Health states that encompass at least one eye with visual acuity of 55 letters or less incur costs associated with visual impairment. Cost associated with blindness are assigned to health states where both eyes have visual acuity of 25 letters or less. Costs were inflated to 2019/2020 costs using published inflation indices [31].
The costs of productivity losses/gains (see Table 3) were estimated using a human capital approach. Costs were computed on the basis of remaining productive working life years determined by the statutory state pension age (66 years), productivity for relative visual impairment and working years valued at the UK average market wages [34, 35].
Table 3 Productivity and informal care costs and sourcesInformal care costs for visual impairment were informed by data from a 2018 study in Portugal, which assessed informal care associated with vision loss [39]. Marques et al. reported a mean of 470 h per annum for the 39.6% of all interviewees who received some informal care. Therefore, informal care hours of 186 h per year (39.6% × 470) were valued at UK average market wages [35]. The costs of informal carers taking time off work for treatment and monitoring visits were assumed to be 4 h, valued in the same way.
2.3.4 UtilitiesUtility values (see Table 4) are based on a study by Czoski-Murray et al. conducted in the UK which estimated a regression model to relate visual acuity score and utility on the basis of time trade-off methods, including an age covariate [40]. A further adjustment was applied to account for better vision in one eye, partially compensating for worse vision in the other. Aligned with the approach in a guideline review conducted by NICE in nAMD [20], a scaling factor of 0.3 is used to estimate the impact of changes in the worse seeing eye on utility. A disutility for injections and adverse events was included in the model. It was assumed that 50% of patients experience a total loss of quality of life on treatment days, informed by the same UK guideline [20].
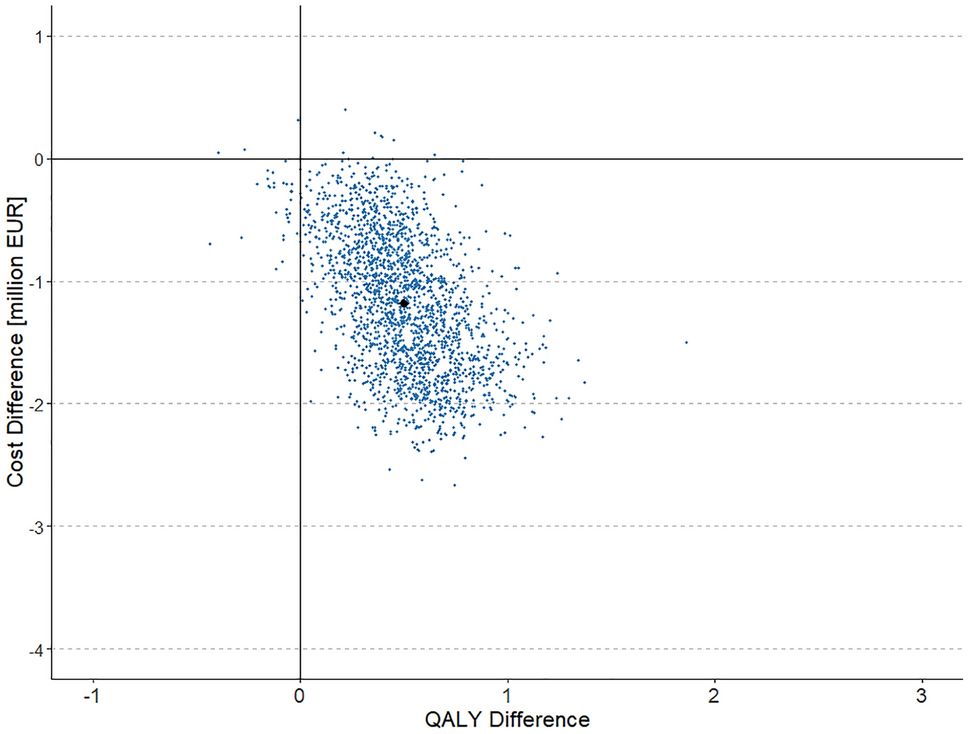
Table 4 Health state utility scores by visual acuity and first/second eye2.3.5 Cost-Effectiveness AnalysisThe state transition model and cost-utility analyses were operationalised in Microsoft Excel©. The model adopted a 4-week cycle length, which is typically the shortest treatment period observed in clinical practice. Given the short cycle length, the impact of event timings within this period were considered negligible and therefore no half-cycle correction was applied. A discount rate of 3.5% was applied to costs and utilities according to UK guidelines [41]. Analyses were run for cohort aged 62 years and with a time horizon of 25 years to ensure important differences in costs and effects were captured. Results were estimated for difference in quality adjusted life-years (QALYs), costs and net monetary benefit (NMB), with health benefits valued using the lower end of cost-effectiveness threshold adopted by NICE (£20,000 per QALY) [41]. Base-case results were based on a societal perspective and presented deterministically.
Deterministic and probabilistic sensitivity analysis (PSA, 1000 simulations) were conducted to characterise uncertainty and explore robustness of model results. Upper and lower bounds for deterministic sensitivity analysis (DSA) were informed by source material estimates of uncertainty, 95% confidence interval where available, or an arbitrary 20% of the mean value otherwise to reflect limited knowledge of uncertainty around mean values, and incremental NMB was used as the output. The distributions used in the PSA were based on parameter characteristics, and distributional shape was defined by observed data (i.e. alpha, beta, mean, standard error). The PSA inputs for visual acuity changes, treatment discontinuation and number of injections were implemented on the basis of sampling with replacement from the empirical distribution for trial-based data, or CODA outputs from the Bayesian NMA for comparators. Cost parameters used gamma distributions; proportions, probabilities and utility values used beta distributions. A normal distribution was used for all other parameters. A full table of model inputs not derived from NMA is given in Supplementary Material (Online Resource) Table A4, including characterisation of uncertainty. A healthcare payer perspective was presented in a scenario, as well as a comparison with bevacizumab and ranibizumab T&E. Alternative health state utilities from a study by Brown and colleagues were presented in scenario [see Supplementary Material (Online Resource) Table A6], which were similarly used as sensitivity analysis in a recent NICE guideline [20, 42].
留言 (0)