
記住我


To investigate the factors that modulate the progression of osteoarthritis, we examined human synovium from OA patients and normal controls (patients with femoral fracture) and observed enhanced expression of inducible nitric oxide synthase (iNOS) and reduced expression of CD206 in the OA synovium compared to controls (Fig. 2a). Immunohistochemistry showed that PGAM5 was mainly detected in the human OA synovium (Fig. 2a). To address the role of PGAM5 in OA macrophages, we further observed increased expression of PGAM5 in macrophages in human OA synovium compared to controls, as confirmed by double-positive immunostaining for PGAM5 and CD68, a marker of macrophages (Fig. 2b), indicating the potential role of PGAM5 in modulating macrophages in the OA synovium. In addition, we confirmed that the protein and RNA levels of PGAM5 increased in human OA synovium (Fig. 2c). Based on the results in human samples, we further performed destabilization of the medial meniscus (DMM) surgery in 8-week-old male wild - type (WT) mice. The knee joints of mice were collected and sectioned for histological examination 28 days after DMM surgery, and safranin O staining, immunohistochemistry of matrix metalloproteinase 13 (MMP13) and aggrecan (ACAN) in the knee joints indicated successful joint osteoarthritis induction in the DMM group (Fig. 2d). OARSI scores of safranin O staining were listed in the supplementary materials (Fig. S1). As expected, we also observed enhanced iNOS and reduced CD206 expression in the OA synovium of mice, and PGAM5 was upregulated in the murine synovium of DMM model compared to the sham group (Fig. 2d). We further investigated the database in NCBI and reanalyzed the single-cell RNA sequencing for murine synovium in an OA model induced by anterior cruciate ligament rupture13 and found that the expression of PGAM5 increased in the synovial cells of OA mice compared to the sham group, specifically in the macrophage cluster which showed enhanced expression of IL1b, IL6, and reduced expression of Pparg and IL10 in the surgical group (Fig. 2e, f), indicating that PGAM5 might be a potential regulatory factor of OA macrophages in the synovium.
Fig. 2
PGAM5 increased in OA macrophages in the synovium. a Representative immunohistochemistry images of iNOS, CD206, and PGAM5 (scale bars, 20 µm) in human normal and OA synovium. b Representative images of coimmunofluorescence of PGAM5 and CD68 in human normal and OA synovium. (scale bars, 20 µm). c WB and qPCR analysis of PGAM5 levels in human normal (n = 3) and OA synovium (n = 5). Relative protein levels with statistical analyses were listed in Fig. S4. d Representative images of safranin O staining, (scale bars, 50 µm), immunohistochemistry of ACAN, MMP13, PGAM5 (scale bars, 20 µm), CD206 (scale bars, 50 µm), and immunofluorescence of iNOS (scale bars, 10 µm) in knee joints 28 days after DMM surgery of WT mice (n = 6). e UMAP plot of murine synovial macrophages in sham group and 28 days after anterior cruciate ligament rupture-based model (ACLR) group and feature plots of PGAM5. f Expression of PGAM5, IL1b, IL6, Pparg, IL10 in clusters of murine synovial macrophages in sham group and 28 d ACLR group. Data are shown as the mean±s.d. *P < 0.05 between the indicated groups. P values were determined using Student’s t tests
PGAM5 regulated osteoarthritis in mice by modulating macrophage polarizationTo address the role of macrophage PGAM5 in osteoarthritis, we generated Pgam5fl/fl -lyz2-Cre (Pgam5 cKO) mice, by crossing Pgam5fl/fl mice with transgenic mice that carried lysozyme (Lyz2) proximal promoter - mediated Cre recombinase, which specifically ablates PGAM5 from macrophages. We then employed DMM surgery in 8-week-old male Pgam5fl/fl and Pgam5 cKO mice for 28 days. We found that Pgam5 cKO mice exhibited relieved OA symptoms compared to Pgam5fl/fl mice, indicated by enhanced safranin O staining, increased expression of ACAN, and decreased expression of MMP13 in cartilage (Fig. 3a). OARSI scores of safranin O staining were listed in the supplementary materials (Fig. S2). We further observed decreased M1 and increased M2 macrophages in the synovium of Pgam5 cKO mice compared to Pgam5fl/fl mice, as confirmed by immunofluorescence of iNOS and CD206 (Fig. 3a, b). RNA-seq of BMDMs from Pgam5 cKO mice and Pgam5fl/fl mice was performed to evaluate the modulatory role of PGAM5 deletion on macrophages at the transcriptome level. Kyoto Encyclopedia of Genes and Genomes pathway analysis showed that various macrophage polarization-associated pathways, including the Toll-like receptor signaling pathway, PI3K-Akt signaling pathway, MAPK signaling pathway, and arginine biosynthesis14 in BMDMs of Pgam5 cKO mice were significantly different from that in BMDMs of Pgam5fl/fl mice, suggesting that PGAM5 potentially modulated macrophage polarization (Fig. 3c). mRNA levels of M1 markers, iNOS and CD80, and M2 markers, arginase 1 (Arg1) and CD206, were detected in peritoneal macrophages of Pgam5 cKO and Pgam5fl/fl mice, which indicated that Pgam5 cKO mice showed fewer proinflammatory phenotypes than Pgam5fl/fl mice (Fig. 3d). These results were validated by flow cytometry of peritoneal macrophages, which indicated fewer CD86+ (M1) and more CD206+ (M2) cells in Pgam5 cKO macrophages (Fig. 3e). To further examine the potential function of PGAM5 in macrophage polarization, we examined whether the expression of PGAM5 changed during the induction of macrophage polarization. BMDMs of WT mice were collected and induced to the M1 polarized state by lipopolysaccharide (LPS) and interferon-γ (IFNγ) or induced to the M2 state by stimulation with IL4. M1 induction significantly reduced PGAM5 mRNA and protein levels within 24 h. However, M2 induction increased PGAM5 mRNA and protein levels in macrophages within 24 h (Fig. 3f, g). The results above indicated that PGAM5 might be involved in regulating macrophage polarization to modulate OA.
Fig. 3
PGAM5 deletion in macrophages relieved osteoarthritis in mice by modulating polarization. Osteoarthritis was induced in Pgam5 cKO mice and their respective control mice by DMM surgery. The knee joints of Pgam5 cKO mice and Pgam5fl/fl mice were analyzed 28 days after the surgery. a Representative images of Safranin O staining (scale bars, 50 µm), immunohistochemistry of ACAN and MMP13 (scale bars, 20 µm), and immunofluorescence of iNOS (red) (scale bars, 20 µm) and CD206 (green) (scale bars, 10 µm) in the knee joint 28 days after DMM surgery of Pgam5 cKO mice and Pgam5fl/fl mice (n = 9). b Quantification of immunofluorescence of iNOS (red) and CD206 (green) in the synovium of the knee joint of Pgam5 cKO mice and Pgam5fl/fl mice 28 days after DMM surgery. c KEGG analysis of BMDMs from Pgam5 cKO mice and Pgam5fl/fl mice 28 days after DMM surgery. d qPCR analysis of iNOS, CD80, Arg1, and CD206 mRNA levels in peritoneal macrophages of Pgam5 cKO mice and Pgam5fl/fl mice 28 days after DMM surgery. e Flow cytometry of peritoneal macrophages of Pgam5 cKO mice and Pgam5fl/fl mice 28 days after DMM surgery. f Western blots analysis of PGAM5, iNOS, and CD206 protein levels in BMDMs stimulated by LPS and IFNγ or IL4 for 0, 1, 3, 6, 12, and 24 h. Relative protein levels with statistical analyses were listed in Fig. S5 (n = 3). g qPCR analysis of PGAM5 mRNA level in BMDMs stimulated with LPS and IFNγ or IL4 for 0, 1, 3, 6, 12, and 24 h. One of the three independent experiments with identical results is shown. Data are shown as the mean±s.d. *P < 0.05, **P < 0.01, ***P < 0.001, ****P < 0.000 1 between the indicated groups. P values were determined using Student’s t tests
PGAM5 enhanced M1 polarization and inhibited M2 polarization of BMDMsTo further illustrate the role of PGAM5 in macrophage polarization, we isolated BMDMs from Pgam5 cKO and Pgam5fl/fl mice and induced them to an M1-polarized state by LPS plus IFNγ for 24 h in vitro. PGAM5 deletion in BMDMs significantly suppressed the mRNA levels of proinflammatory genes, including iNOS, IL1α, IL1β, IL6, and IL12, compared with that in Pgam5fl/fl macrophages (Fig. 4a). The number of CD86+ cells was significantly lower in Pgam5 cKO BMDMs than in Pgam5fl/fl BMDMs after M1 induction, as determined by flow cytometry (Fig. 4b). Enzyme-linked immunosorbent assay (ELISA) of the supernatant of BMDMs treated with LPS plus IFNγ also verified that PGAM5 deletion led to decreased secretion of proinflammatory cytokines in macrophages (Fig. 4c). In addition, the protein level of iNOS was significantly lower in Pgam5 cKO BMDMs than in Pgam5fl/fl macrophages after M1 induction (Fig. 4d). To clarify the influence of PGAM5-deficient macrophages on cartilage, BMDMs from Pgam5 cKO and Pgam5fl/fl mice were cocultured with chondrocytes after M1 induction in vitro. The protein levels of ACAN and MMP3 and the mRNA levels of COL2A1 and SOX9 in chondrocytes indicated that PGAM5 deletion in macrophages limited the proinflammatory phenotypes of chondrocytes (Fig. 4e, f).
Fig. 4
PGAM5 promoted M1 polarization, inhibits M2 polarization, and caused enhanced cartilage inflammation in vitro. Primary BMDMs of Pgam5 cKO mice and Pgam5fl/fl mice were freshly isolated and induced for examination. a BMDMs from Pgam5 cKO mice and Pgam5fl/fl mice were stimulated with LPS plus IFNγ for 24 h, and the mRNA levels of iNOS, IL1α, IL1β, IL6, and IL12 were determined by qPCR. b CD86 expression in Pgam5 cKO and Pgam5fl/fl macrophages stimulated by LPS plus IFNγ was determined by flow cytometry. c The concentrations of IL1β, IL6, and IL12p70 in the culture medium of Pgam5 cKO and Pgam5fl/fl BMDMs stimulated by LPS plus IFNγ for 24 h were detected by enzyme-linked immunosorbent assay. d Western blot analysis of iNOS protein level in BMDMs from Pgam5 cKO and Pgam5fl/fl mice produced by LPS plus IFNγ was determined by western blots. Relative protein levels with statistical analyses were listed in Fig. S6a (n = 3). e Freshly isolated BMDMs from Pgam5 cKO and Pgam5fl/fl mice were cultured and stimulated with LPS plus IFNγ for 24 h and cocultured with chondrocytes isolated from WT neonatal mice for 24 h. Protein expression of ACAN and MMP3 was determined by western blots. Relative protein levels with statistical analyses were listed in Fig. S6c, d (n = 3). f qPCR analysis of COL2A1 and SOX9 mRNA levels. g BMDMs from Pgam5 cKO and Pgam5fl/fl mice were stimulated with IL4 for 24 h, and the expression of Arg1, CD206, PPARγ, and IL10 was determined by qPCR. h CD206 expression in Pgam5 cKO and Pgam5fl/fl macrophages stimulated by IL4 was determined by flow cytometry. i Western blot analysis of CD206 protein level in BMDMs from Pgam5 cKO and Pgam5fl/fl mice produced by IL4 was determined by western blots. Relative protein levels with statistical analyses were listed in Fig. S6b (n = 3) Data are shown as the mean ± s.d. *P < 0.05, **P < 0.01, ***P < 0.001 compared with Pgam5fl/fl mice or between the indicated groups. P values were determined using Student’s t tests
Next, we aimed to investigate whether PGAM5 plays an essential role in M2 macrophage polarization. Pgam5 cKO and Pgam5fl/fl BMDMs were isolated and stimulated with IL4 for 24 h for M2 induction. After IL-4 stimulation, Pgam5 cKO BMDMs expressed enhanced mRNA levels of Arg1, CD206, PPARγ, and IL10, compared to Pgam5fl/fl BMDMs (Fig. 4g). The number of CD206+ cells was significantly higher in Pgam5 cKO BMDMs than in Pgam5fl/fl BMDMs after M2 induction, as determined by flow cytometry (Fig. 4h). The protein level of CD206 significantly increased in Pgam5-cKO BMDMs compared to Pgam5fl/fl macrophages after M2 induction (Fig. 4i). In conclusion, PGAM5 led to an increased M1 response and a decreased M2 response in macrophages in vitro.
PGAM5 induced M1 polarization via the AKT-mTOR/P38/ERK signaling pathway, whereas inhibited M2 polarization through STAT6-PPARγ signaling pathwayIn previous studies, a series of signaling pathways were activated by induction of M1 polarization, such as the AKT-mTOR and MAPK signaling pathways.12 We further examined whether PGAM5 promotes M1 polarization through these specific signals. Treated with LPS and IFNγ, BMDMs from Pgam5 cKO mice significantly showed lower protein levels of p-p38 and p-ERK than Pgam5fl/fl macrophages and nearly identical expression of total p38 and total ERK, indicating that PGAM5 activates the p38 and ERK signaling pathways to enhance M1 polarization since MAPK signaling has been proven to increase M1 polarization in previous studies15 (Fig. 5a). However, we did not find different expression pattern of p-JNK in Pgam5 cKO and Pgam5fl/fl BMDMs (Fig. 5a). p-AKT and p-mTOR significantly decreased in Pgam5 cKO macrophages compared with Pgam5fl/fl macrophages stimulated by LPS and IFNγ (Fig. 5a). To explore the possible role of AKT and mTOR in mediating the intensive role of PGAM5 in macrophage inflammation, we employed the specific mTOR activator MHY148516 to activate the mTOR pathway. Activating mTOR rescued the decreased levels of iNOS, IL1α, IL1β and IL-6 in PGAM5-deficient macrophages after LPS and IFNγ stimulation, as examined by qPCR (Fig. 5b), indicating that mTOR activity is involved in the regulation of M1 macrophage polarization by PGAM5. The protein level of iNOS was also enhanced in the presence of MHY1485 in Pgam5 cKO macrophages (Fig. 5c). The activation of mTOR, also presented by phosphorylation of mTOR, increased in BMDMs when treated with doses of 0, 1, 5, and 10 μmol/L of MHY1485 (Fig. 5d), and the mRNA levels of iNOS, IL1α, IL1β, and IL6 increased in Pgam5 cKO macrophages in a dose-dependent manner (Fig. 5e), indicating that PGAM5 promoted the M1 phenotype by activating the mTOR signaling pathway.
Fig. 5
PGAM5 improved M1 polarization via Akt-mTOR/P38/ERK signaling pathway and inhibited M2 polarization via the STAT6-PPARγ signaling pathway. a After stimulation with LPS and IFNγ for 24 h, the protein levels of p-p38, total p38, p-ERK, total ERK, p-JNK, p-AKT, total AKT, p-mTOR, and total mTOR were determined by western blots in BMDMs of Pgam5 cKO and Pgam5fl/fl mice. Relative protein levels with statistical analyses were listed in Fig. S7a (n = 3). b qPCR analysis of iNOS, IL1α, IL1β and IL-6 mRNA levels in Pgam5 cKO and Pgam5fl/fl macrophages after M1 induction with or without treatment of MHY1485 (10 μmol/L). c Western blot analysis of iNOS protein level of Pgam5 cKO and Pgam5fl/fl macrophages after M1 induction with or without treatment of MHY1485 (10 μM). Relative protein levels with statistical analyses were listed in Fig. S7b (n = 3). d Western blot analysis of p-mTOR, mTOR, and iNOS protein levels in BMDMs with increasing concentrations of MHY1485 stimulation. Relative protein levels with statistical analyses were listed in Fig. S7c (n = 3). e qPCR analysis of iNOS, IL1α, IL1β and IL-6 mRNA levels in Pgam5 cKO BMDMs treated with increasing concentrations of MHY1485 stimulation. f Western blot analysis of PPARγ and p-STAT6 protein levels in Pgam5fl/fl and Pgam5 cKO BMDMs after 24 h of stimulation with IL4. Relative protein levels with statistical analyses were listed in Fig. S7d (n = 3). g Western blot analysis of PPARγ and CD206 protein levels in Pgam5 cKO BMDMs with increasing concentrations of T0070907 stimulation. Relative protein levels with statistical analyses were listed in Fig. S7e (n = 3). h qPCR analysis of Arg1, Ym1, and CD206 mRNA levels in Pgam5 cKO macrophages after M2 induction with or without treatment of T0070907 (5 μmol/L). i Western blot analysis of CD206 protein level in Pgam5 cKO and Pgam5fl/fl macrophages after M2 induction with or without treatment of T0070907 (5 μmol/L). Relative protein levels with statistical analyses were listed in Fig. S7f (n = 3). j Western blot analysis of CD206 and PPARγ protein levels in Pgam5 cKO and Pgam5fl/fl macrophages after M2 induction with or without treatment of AS1517499 (10 μmol/L). Relative protein levels with statistical analyses were listed in Fig. S7g (n = 3). Data are shown as the mean±s.d. *P < 0.05, **P < 0.01, ***P < 0.001 between the indicated groups. P values were determined using Student’s t tests
To explore the mechanisms by which PGAM5 modulates M2 polarization, we focused on the STAT6-PPARγ signaling pathway, which regulates M2 polarization.17 After stimulation with IL4 for 24 h, the protein levels of PPARγ and p-STAT6 enhanced in Pgam5-cKO BMDMs compared to Pgam5fl/fl BMDMs (Fig. 5f), indicating that the STAT6-PPARγ signaling pathway might be involved in PGAM5-mediated M2 polarization. Next, inhibition of PPARγ by a specific inhibitor, T0070907,18 markedly reduced the protein level of CD206 in a dose-dependent manner (Fig. 5g). Furthermore, T0070907 decreased the M2 polarization response in Pgam5 cKO macrophages, as indicated by significantly decreased mRNA levels of Arg1, chitinase-like 3 (Ym1), and CD206 (Fig. 5h). Besides, the protein level of CD206 was also markedly reduced by treatment with T0070907 in Pgam5 cKO macrophages stimulated by IL4 (Fig. 5i), suggesting that M2 polarization was regulated by PGAM5 through the STAT6-PPARγ signaling pathway. To identify the role of STAT6 in the PGAM5 modulation of M2 polarization, specific inhibition of STAT6 by AS151749919 was added to Pgam5 cKO and Pgam5fl/fl macrophages at a dose of 10 μmol/L. As a result, the protein expression of PPARγ and CD206 significantly reduced, indicating that STAT6 functions as a regulator of PPARγ (Fig. 5j). In conclusion, PGAM5 regulates M2 polarization via the STAT6-PPARγ signaling pathway.
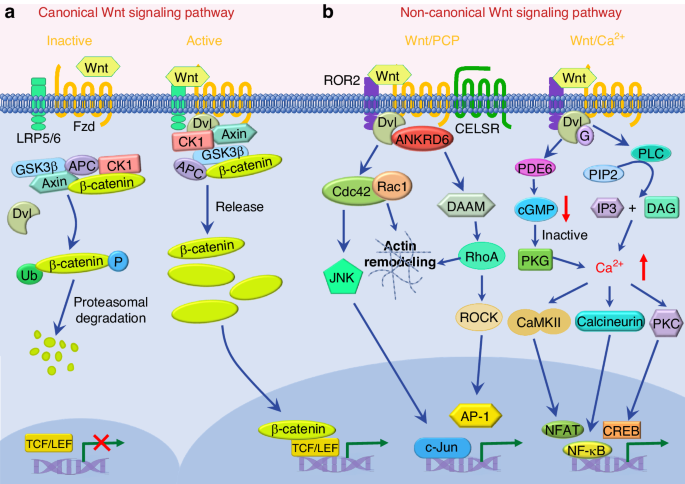
PGAM5 regulated macrophage polarization by targeting the β-catenin pathway via dephosphorylation of DVL2Although we have identified the related signaling pathways that regulate PGAM5-mediated macrophage polarization, the direct target of PGAM5 in regulating macrophage polarization has not been verified. PGAM5 was reported to inhibit the Wnt/β-catenin signaling pathway on the mitochondrial membrane in human cells and Xenopus embryogenesis.20 Moreover, the β-catenin signaling pathway is closely correlated with macrophage activation and polarization.21,22,23 Nevertheless, whether PGAM5 modulates β-catenin in synovial macrophage polarization and the related targets have not been reported.
Thus, we first examined the potential regulation of PGAM5 on β-catenin in macrophage polarization. Pgam5 cKO and Pgam5fl/fl BMDMs were isolated and stimulated to induce M1 or M2 polarization. After 24 h of stimulation, Pgam5 cKO BMDMs showed increased phosphorylation of β-catenin at Ser675 and decreased phosphorylation at Thr41/Ser45 in the M1- and M2-polarized states, and increased protein levels of β-catenin were detected in the M1-polarized state compared to Pgam5fl/fl BMDMs, indicating that PGAM5 triggered inhibition of β-catenin in both M1 and M2 polarization (Fig. 6a). To better confirm the target of PGAM5 on β-catenin in macrophage polarization, we focused on whether PGAM5 could dephosphorylate Dishevelled Segment Polarity Protein 2 (DVL2), which is a inhibitory regulator in the upstream of β-catenin signaling pathway. Interestingly, the phosphorylation sites of DVL2, S143 and T224, were both increased in Pgam5 cKO macrophages when induced to M1 and M2-polarized states compared to Pgam5fl/fl BMDMs (Fig. 6a), indicating potential interaction of PGAM5 and DVL2. Thus, we detected whether PGAM5 could directly bind to DVL2 and found that PGAM5 could be coimmunoprecipitated with DVL2 in both M1 and M2 macrophages (Fig. 6b), indicating PGAM5 directly dephosphorylated DVL2 via binding to it. We then focused on whether β-catenin was involved in PGAM5-modulated macrophage polarization. Specific inhibition of β-catenin by ICG-00124 increased the protein levels of p-p38, p-ERK and iNOS. ICG-001 also reduced the expression of p-STAT6, PPARγ, and CD206, indicating that β-catenin functions as a regulator of macrophage polarization (Fig. 6c, d). In addition, as predicted, the expression of β-catenin increased in the OA synovium of Pgam5 cKO mice compared to Pgam5fl/fl mice (Fig. 6e). Thus, these results indicated that PGAM5 modulated macrophage polarization by inhibiting the β-catenin pathway via directly targeting DVL2.
Fig. 6
PGAM5 modulated macrophage polarization by inhibiting the β-catenin signaling pathway via dephosphorylation of DVL2. a Western blot analysis of p-β-catenin on Ser675 and Thr41/Ser45, β-catenin and p-DVL2 on S143 and T224 protein levels in Pgam5fl/fl and Pgam5 cKO BMDMs after stimulation with LPS plus IFNγ or IL4. Relative protein levels with statistical analyses were listed in Fig. S8a (n = 3). b Coimmunoprecipitation of DVL2 and PGAM5 in M1 and M2 macrophages. c Western blot analysis of iNOS, p-p38, and p-ERK protein levels in Pgam5fl/fl and Pgam5 cKO macrophages stimulated with ICG-001 (10 μmol/L). Relative protein levels with statistical analyses were listed in Fig. S8b (n = 3). d Western blot analysis of CD206, p-STAT6, and PPARγ protein levels in Pgam5fl/fl and Pgam5 cKO macrophages stimulated with ICG-001 (10 μmol/L). Relative protein levels with statistical analyses were listed in Fig. S8c (n = 3). e Immunohistochemistry of β-catenin in the OA synovium of Pgam5fl/fl and Pgam5 cKO mice after DMM surgery. f Representative images of safranin O staining (scale bars, 50 µm), immunohistochemistry of ACAN, MMP13, immunofluorescence of iNOS (red) and CD206 (green) (scale bars, 20 µm) of DKO and Pgam5 cKO mice 28 days after DMM surgery (n = 6). g Quantification of iNOS (red) and CD206 (green) immunofluorescence in the synovium of the knee joint of DKO and Pgam5 cKO mice 28 days after DMM surgery. h qPCR analysis of iNOS, CD80, Arg1, and CD206 mRNA levels in peritoneal macrophages of DKO and Pgam5 cKO mice 28 days after DMM surgery. i Flow cytometry of peritoneal macrophages of DKO and Pgam5 cKO mice 28 days after DMM surgery. Data are shown as the mean±s.d. *P < 0.05, **P < 0.01, ***P < 0.001 between the indicated groups. P values were determined using Student’s t tests
To verify the role of β-catenin in PGAM5-mediated macrophage polarization in synovium, we generated mice in which both PGAM5 and β-catenin were ablated in macrophages, herein referred to as DKO mice, by crossing β-cateninfl/fl mice with Pgam5 cKO mice. Knee joints of DKO and Pgam5 cKO male mice were collected 28 days after DMM surgery for further investigations. DKO mice significantly exacerbated OA symptoms compared to Pgam5 cKO mice, as determined by safranin O staining (Fig. 6f). OARSI scores of safranin O staining were listed in the supplementary materials (Fig. S3). Expression of ACAN decreased while expression of MMP13 increased in the knee joint of DKO mice compared to Pgam5 cKO mice, indicating that the relieved OA symptom by PGAM5 deficiency in macrophages was partly mediated by the enhanced activity of β-catenin (Fig. 6f). In addition, iNOS-positive cells were significantly increased and CD206+ cells were significantly decreased in the synovium of DKO mice compared to Pgam5 cKO mice (Fig. 6f, g), suggesting that PGAM5 regulates synovial macrophage polarization by inhibiting the β-catenin signaling pathway, further aggravating the progression of OA. Peritoneal macrophages in DKO mice showed increased mRNA levels of iNOS and CD80 and decreased mRNA levels of CD206 (Fig. 6h). In addition, flow cytometry of peritoneal macrophages also indicated that DKO mice showed more proinflammatory phenotypes than Pgam5 cKO mice (Fig. 6i). In conclusion, PGAM5 regulates macrophage polarization by inhibiting the β-catenin signaling pathway, and inhibition of β-catenin extensively reversed the alleviation of OA symptoms in Pgam5 cKO mice.
Targeted knockdown of PGAM5 in synovial macrophages by MFP9-2/siPGAM5 relieved OA symptomsBased on the mechanisms of PGAM5 in regulating macrophage polarization, we aimed to establish targeted deletion of PGAM5 in synovial macrophages to treat OA in early stage. RNA interference (RNAi) is a powerful technique to treat various diseases via specific gene silence.25 However, targeted delivery of siRNA into synovial macrophages is challenging owing to the complicated synovial fluid composition and extracellular matrix in the joint microenvironment.26 Here, we developed a series of mannose modified fluoropolymers for macrophage-targeted siRNA delivery to treat OA via inhibition of PGAM5. ε-PLL was conjugated with fluoroalkanes (F7-F17, Fig. 7a) via amine-epoxide reactions, and different feeding ratios were chosen to get PLL modified with average numbers of about 10 and 15 fluoroalkanes, respectively. The obtained fluoropolymers were further grafted with mannose via an amine-isocyanate reaction, and an average number of 1 mannose was conjugated on each polymer calculated by 1H NMR. Take F7 for example, the mannose grafted polymer conjugated with 10 F7 ligands and 15 F7 ligands were termed MFP7-1 and MFP7-2, respectively. The siRNA delivery efficacy of the synthesized nanoparticles (NPs) was first screened on Raw264.7 cells. MFP9-2/siPGAM5 complexes exhibited the highest gene knockdown efficiency, which was higher than that of the Lipofectamine 2000 (Lipo)/siPGAM5 complexes (Fig. 7b). The MFP9-2 transported the FAM-labeled siRNA into the CD68+ synovial macrophages rather than chondrocytes efficiently after intraarticular injection (Fig. 7c), which is beneficial for achieving macrophage-targeted RNAi. To validate the therapeutic efficacy of the MFP9-2 based siRNA delivery system, MFP9-2/siPGAM5 complex was injected into the joint of WT mice twice weekly in early stage of OA established by DMM surgery and the joints were collected 28 days after DMM surgery. Sham group, DMM group with no injection and DMM group with injection of MFP9-2 combined with siNC (MFP9-2/siNC) were established as controls (Fig. 7d). Intraarticular injection of MFP9-2/siPGAM5 greatly relieved the OA symptoms compared to DMM group and DMM with injection of MFP9-2/siNC group, indicated by increased safranin O staining area, decreased expression of MMP13 and enhanced level of ACAN in cartilage (Fig. 7d). Besides, the amount of iNOS positive cells in synovium treated with MFP9-2/siPGAM5 greatly decreased, while CD206 positive cells increased compared to DMM group and DMM with injection of MFP9-2/siNC group (Fig. 7e, g), indicating the availability of macrophage modulation in OA synovium by MFP9-2/siPGAM5. To further confirm the modulatory function of MFP9-2/siPGAM5, we detected whether the relief of OA symptoms was the result of PGAM5 inhibition in synovial macrophage by MFP9-2/siPGAM5. We found that injection of MFP9-2/siPGAM5 greatly decreased the level of PGAM5 in CD68 positive macrophages in synovium compared to injection of MFP9-2/siNC with FAM (Fig. 7f, g), indicating successful targeting and inhibiting of PGAM5 in synovial macrophages, which could further achieve better OA outcomes.
Fig. 7
Intraarticular injection of macrophage-targeted siPGAM5 delivery system to relieve OA symptoms. a Preparation of macrophage-targeted nanoparticles (NPs). b qPCR analysis of PGAM5 mRNA level in Raw264.7 cells after transfected with the polymer/siRNA complexes for 24 h. The concentrations of siRNA and the polymers were 8 µg/mL and 16 µg/mL, respectively. c Communofluorescence of CD68 (red), FAM (green), and DAPI (blue) in the cartilage and synovium of mice 28 days after DMM surgery with injection of MFP9-2/siPGAM5 (scale bars, 50 µm). d Schematic diagram of intervention of OA by articular injection of MFP9-2/siPGAM5 twice weekly after DMM surgery. e Representative images of safranin O staining (scale bars, 100 µm), immunohistochemistry of MMP13, and ACAN (scale bars, 20 µm), and immunofluorescence of iNOS (red)and CD206 (green) (scale bars, 50 µm) in knee joints 28 days after DMM surgery (n = 6). Sham group, DMM group with no injection and DMM group with injection of MFP9-2/siNC were established as controls. f Coimmunofluorescence of CD68 (yellow), FAM (green), and PGAM5 (red) in the synovium of mice 28 days after DMM surgery with injection of MFP9-2/siNC or MFP9-2/siPGAM5 (scale bars, 50 µm). g OARSI scores, the percentage of MMP13 positive cells, ACAN positive cells and the amounts of iNOS positive cells and CD206 positive cells were quantified in each group. Ratio of FAM positive cells and CD68 positive cells, and the mean IF intensity of PGAM5 were quantified. Data are shown as the mean±s.d. *P < 0.05, **P < 0.01, ***P < 0.001, ****P < 0.000 1 between the indicated groups. P values were determined using Student’s t tests
To conclude, PGAM5 serves as a novel factor of regulating macrophage polarization in osteoarthritis via dephosphorylating DVL2, resulting in increased activity of GSK3β and degradation of β-catenin,27 which disables the translocation of β-catenin into nucleus to bind to promotors for downstream signaling pathways, further contributes to increased M1 and decreased M2 phenotypes via specific signals. To better treat OA via early intervention of macrophage PGAM5, specifically inhibition of PGAM5 in macrophages was achieved by intraarticular injection of MFP9-2/siPGAM5, which could significantly target synovial macrophages and reduce the expression of PGAM5 in macrophages, resulting in the relief of OA symptoms. Together, we have clarified the modulatory role of PGAM5 in OA macrophage and designed a functional macrophage-targeted therapy, which might contribute to early and precise immunological interventions in OA in clinic.
留言 (0)