Cell culture
The cell lines were cultured in an incubator set at 37 °C with either 5% or 10% CO2. INS-1E and αTC1 clone 9 cells were purchased from Sigma Aldrich (Saint Louis, MO, USA) and ATCC (Manassas, VA, USA), respectively. Unless otherwise mentioned, all medium components were purchased from Sigma-Aldrich (Saint Louis, MO, USA).
The INS-1E (Sigma Aldrich, SCC491) cells were cultured using Roswell Park Memorial Institute (RPMI) 1640 medium (Corning, New York, USA), supplemented with 2 g/l NaHCO3, glutamine, 1% antibiotic–antimycotic, 1% sodium pyruvate, 1% 4-(2-hydroxyethyl)-1-piperazineethanesulfonic acid (HEPES), and 0.1% β-mercaptoethanol, along with 10% fetal calf serum. The culture medium was replaced twice a week. For experimental purposes, the medium’s composition remained the same as the culture medium, except that 10% fetal calf serum was replaced with 0.2% bovine serum albumin, which was free from free fatty acids. For experiments with variable glucose, RPMI 1640 medium without glucose was used and glucose was supplemented to 2 mM, 6 mM, and 16 mM values.
αTC1 cells clone 9 (ATCC, CRL-2350) were cultured using Dulbecco’s modified Eagle’s medium (DMEM) low glucose medium (Corning, NY, USA). The medium was supplemented with 15 mM HEPES, 0.1 mM nonessential amino acids, 10% fetal calf serum, 0.02% bovine serum albumin that was free from free fatty acids, and 1% antibiotic–antimycotic. The culture medium was replaced twice a week. For the experimental conditions, the medium’s composition remained the same as the culture medium but without the addition of 10% fetal calf serum. For experiments with variable glucose, DMEM medium without glucose was used and glucose was supplemented to 2 mM, 6 mM, and 16 mM values.
Experimental treatment of cells with MOTS-c
In each experiment, the cells were incubated with varying concentrations of MOTS-c (1, 10, and 100 nM) in the experimental medium. Additionally, there was a control group where cells were not exposed to MOTS-c. The MOTS-c peptide used in the experiments was purchased from Novazym (Poznan, Poland). For the αTC-1 cells, the amino acid sequence of the mouse MOTS-c was MKWEEMGYIFL. On the other hand, for the INS-1E cells, the amino acid sequence of the rat MOTS-c was MKRKEMGYIFFSQRTLRNPL.
Immunofluorescence
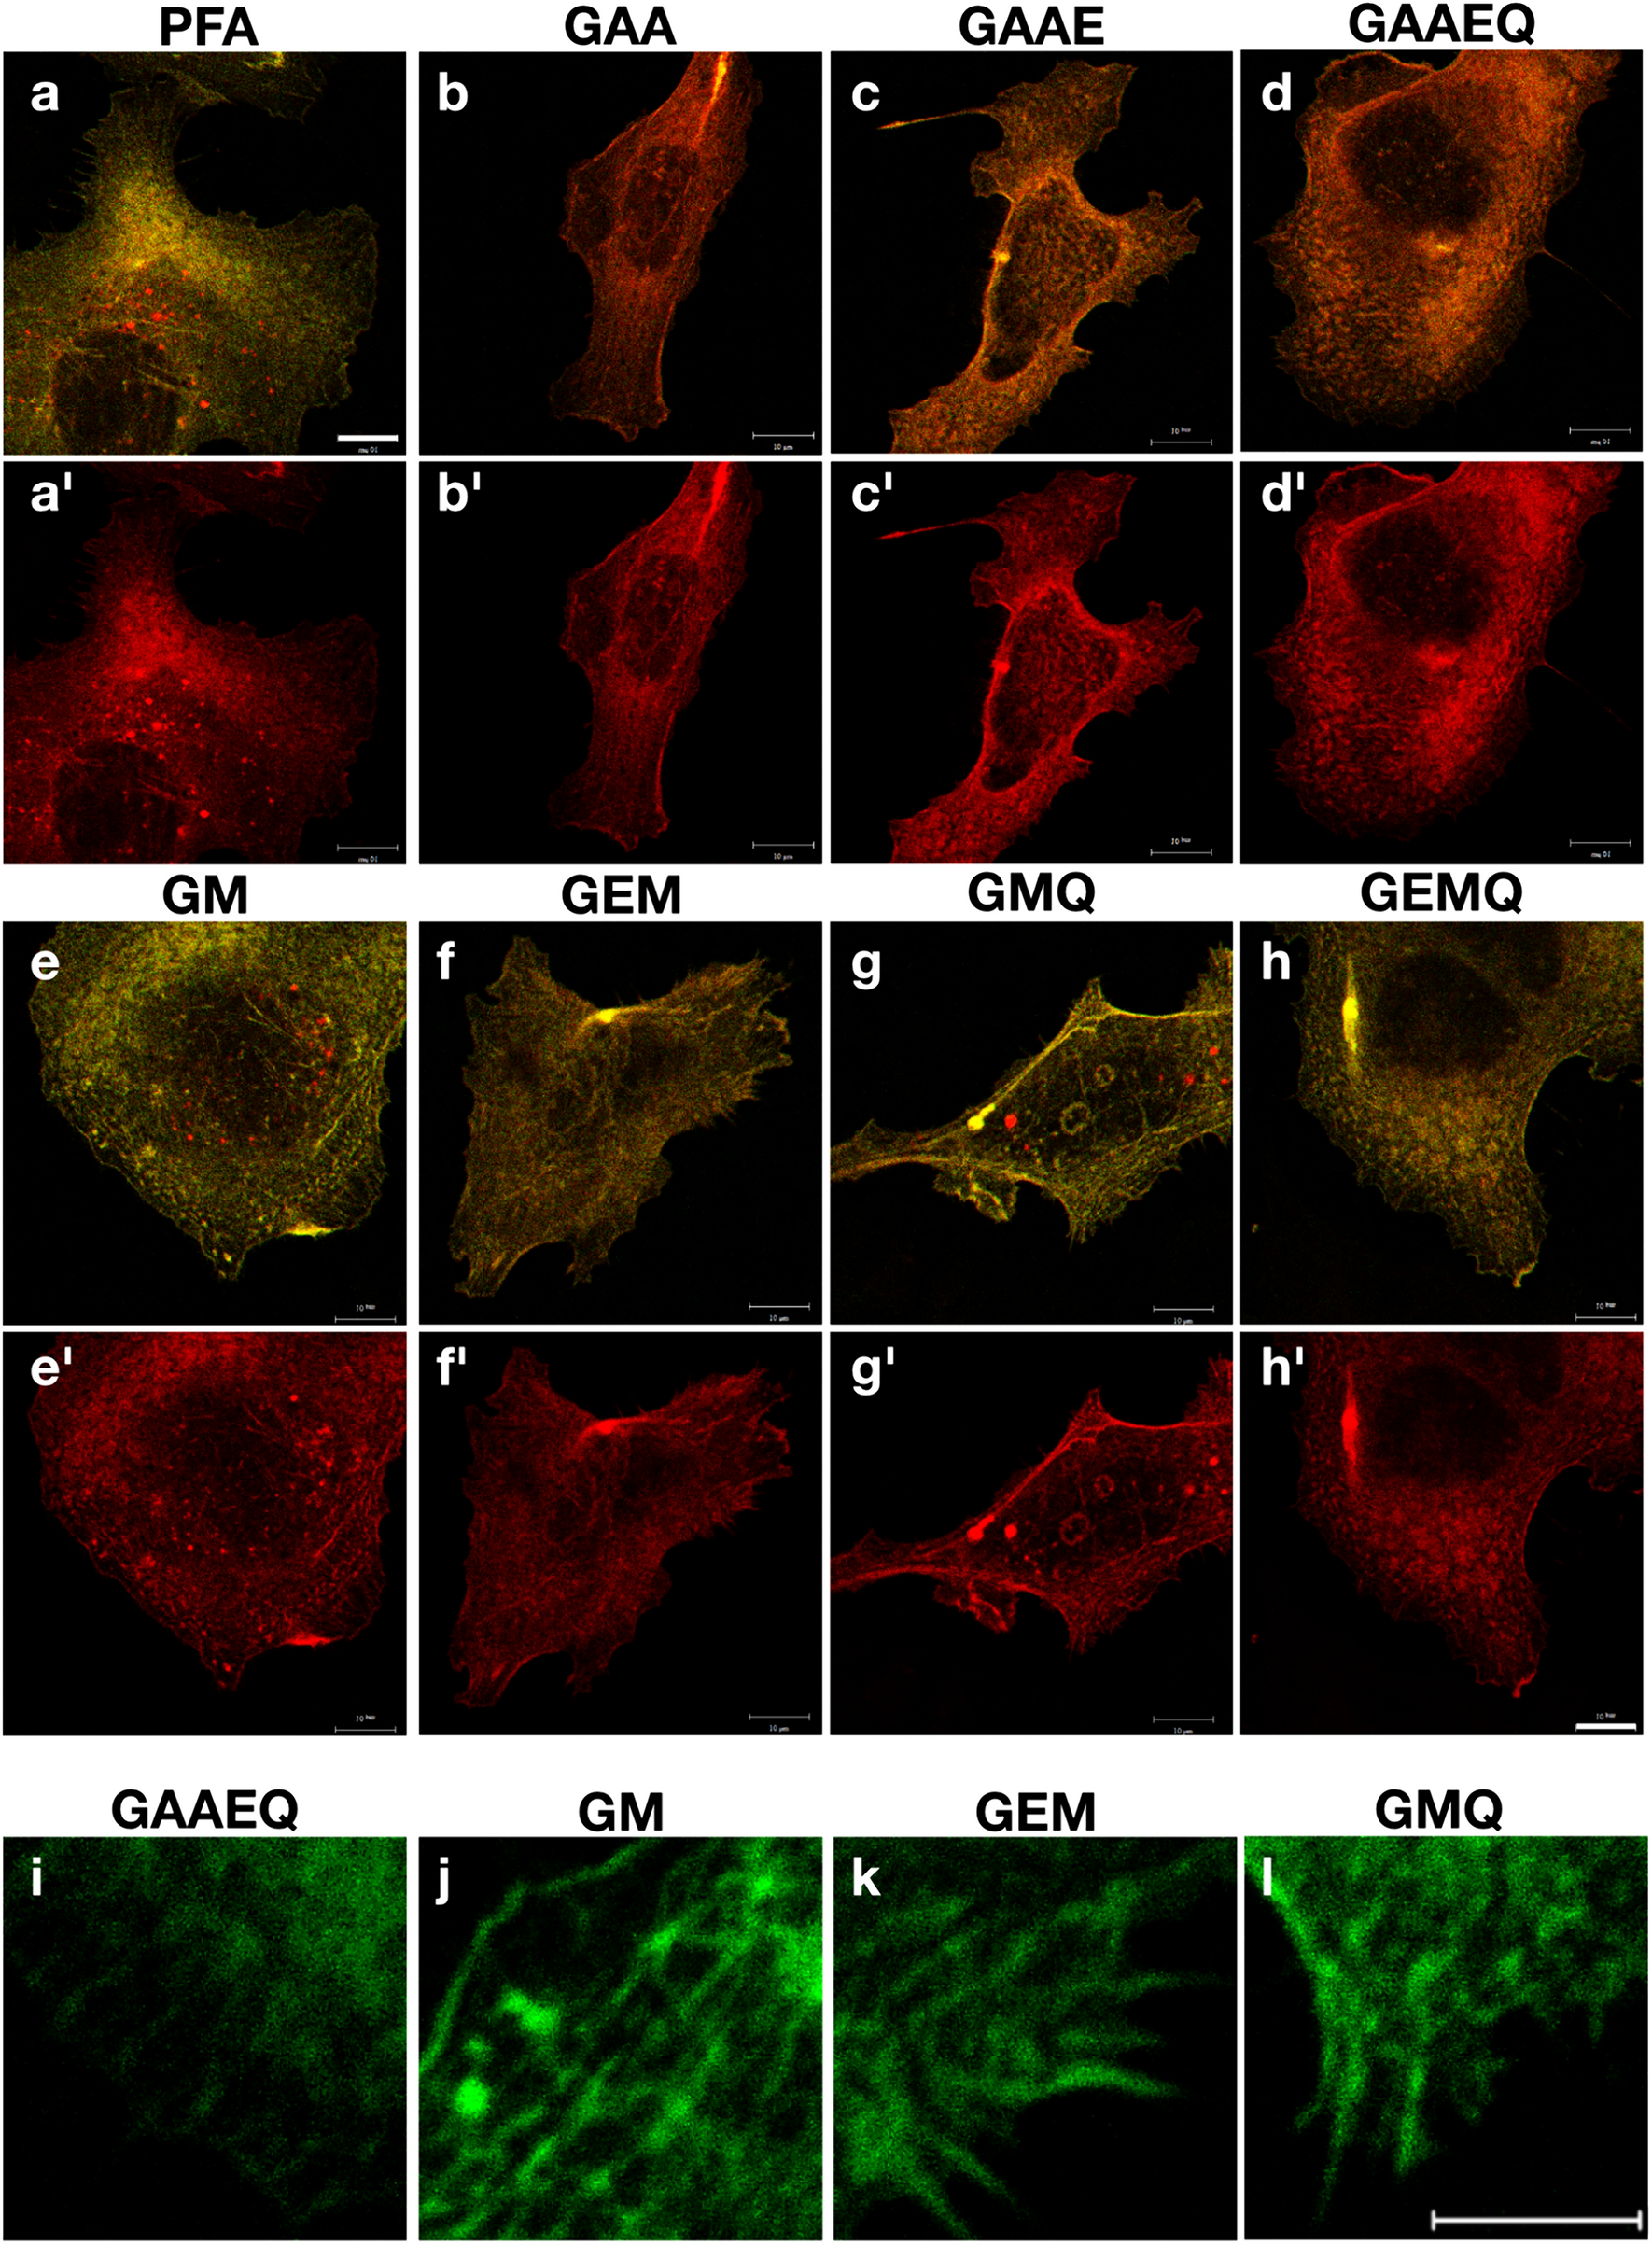
The cells underwent a series of treatments to prepare them for staining. Firstly, they were treated with 4% paraformaldehyde for 10 min and then washed three times with phosphate-buffered saline (PBS). Next, the cells were permeabilized with 1% Triton X-100 in PBS for 15 min and then washed three times with PBS. Subsequently, autofluorescence was blocked using 0.1% glycine in PBS for 15 min, and after removal, the cells were blocked with 2% bovine serum albumin (BSA) in PBS for 45 min.
For staining, the primary antibodies used were antiMOTS-c, antiMOTS-c with blocking peptide, and synthetic MOTS-c; antiinsulin (in the case of INS-1E cells); and antiglucagon (in the case of αTC1 cells). The blocking peptide (cat. no. MBS543991; MyBioSource, San Diego, CA, USA) recommended for this antiMOTS-c antibody was used, and additionally the MOTS-c peptide obtained from Novazym was added to block the MOTS-c positive signals. Antibody and blocking peptides were incubated 48 h before the use. The primary antibodies were allowed to incubate for 1 h at a concentration of 1:400 in PBS buffer with 0.2% gelatin. Following this, the cells were washed three times with PBS, and then the secondary antibody was added for 15 min also in a concentration of 1:400 in PBS buffer with 0.2% gelatin. Then, the nuclei of cells were stained with 4′,6-diamidino-2-phenylindole (DAPI) for 1 min, and photographs were taken using LSM 510 Meta, Axiovert 200 M, AxioCamHR, LD Plan Neofluar 63x/0.75 Korr Ph2 (Zeiss, Oberkochen, Germany).
The antibodies used for staining were as follows: antiinsulin, polyclonal guinea pig, cat. no. A0564 (Agilent, Santa Clara, CA, USA); antiglucagon, polyclonal guinea pig, cat. no. 4031-01F (Merck Millipore, Burlington, MA, USA); antiMOTS-c, rabbit polyclonal, cat. no. MBS542112 (MyBioSource, San Diego, CA, USA).
The following secondary antibodies were used: Alexa Fluor 488 Goat antiguinea pig IgG, cat. no. A11073 (Life Technologies, Carlsbad, CA, USA) and Cy3 Goat antirabbit IgG, cat. no. A10520 (Life Technologies, Carlsbad, CA, USA).
MOTS-c secretion
Both types of cells were incubated in a 96-well plate and exposed to an experimental medium with the addition of (a) oleic, stearic, and palmitic acid at a concentration of 200 µM and without any fatty acid (control group), (b) 2, 6, and 16 mM of glucose. Additionally, αTC-1 cells were incubated with an experimental medium with 1, 10, and 100 nM of glucagon and the control without glucagon, and INS-1E cells were incubated with an experimental medium with 1, 10, and 100 nM of insulin, and the control group without insulin. Incubations lasted 1.5 h.
To determine the MOTS-c levels in the medium, the Rat MOTS-c kit (Sunred, Shanghai, China) and Mouse MOTS-c kit (Sunred, Shanghai, China) were measured following the instructions provided in the attached manual. To normalize the results, 3-(4,5-dimethylthiazol-2-yl)-2,5-diphenyltetrazolium bromide (MTT) assays were conducted after each incubation, and the secretion results were normalized by comparing them with the MTT results.
Secretion of hormones
The INS-1E cells were cultured in a 96-well plate and incubated with MOTS-c for 1.5 h. Following the incubation period, the insulin levels in the medium were measured using the RI-13 K (kit from Merck Millipore, Burlington, MA, USA), according to the instructions provided in the attached manual.
Similarly, the αTC-1 cells were also cultured in a 96-well plate and incubated with MOTS-c for 1.5 h. After the incubation, the glucagon levels in the medium were measured using the GL-32 K (kit from Merck Millipore, Burlington, MA, USA), according to the instructions provided in the attached manual.
Cell culture medium with free fatty acids
Before administering the medium to the cells, free warm fatty acids were added to the medium to achieve a concentration of 200 µM. Subsequently, the cells were incubated at 37 °C for 1.5 h to facilitate the coupling of the fatty acids to bovine serum albumin in the medium.
MTT
The cells were incubated for a 24-h incubation period with MOTS-c. Afterward, a 96-well plate containing the cells was used for the MTT assay. A 0.05% working solution of MTT from Merck (Darmstadt, Germany) was added to the medium in each well, and the plate was placed in an incubator for 25 min. Following the incubation, the medium was carefully removed, and the cells were dissolved in 100 µl of dimethylsulfoxide. The plate was then placed on a thermomixer at 37 °C and gently shaken for 5 min. Subsequently, the absorbance of the cells was measured at 570 nm wavelength, and background measurements were taken at 650 nm wavelength on Synergy 2 (Agilent, Santa Clara, CA, USA).
BrdU
The cells were cultured in a 96-well plate and incubated with MOTS-c for a duration of 24 h. After this incubation period, a 5-bromo-2′-deoxyuridin (BrdU) assay was performed using the Cell Proliferation ELISA, BrdU (colorimetric) kit, according to the instructions provided in the attached manual.
Cell death
The cells were incubated with MOTS-c for 24 h in a 96-well plate. To measure the level of cell death, a Cell Death Detection ELISA Plus test was conducted according to the instructions provided in the attached manual.
RNA extraction
The cells were incubated with MOTS-c for 24 h in a 12-well plate. Following the incubation, RNA was extracted from the cells using Extrazol reagent purchased from BLIRT (Gdansk, Poland), and the RNA extraction protocol provided in the attached manual was followed.
Reverse transcription
Reverse transcription was performed using the High Output cDNA Reverse Transcription Kit (Applied Biosystems, Waltham, MA, USA), as per the instructions provided in the manual.
PCR
The reagent used for the reaction was HOT FIREPol EvaGreen qPCR Mix Plus (Solis BioDyne OÜ, Tartu, Estonia). The reaction was carried out using the QuantStudio™ 12 K Flex System (Thermo Fisher Scientific, Waltham, MA, USA).
The primer sequences utilized (5′–3′) were: Rat insulin F: CCAGTTGGTAGAGGGAGCAG, R: AGACCATCAGCAAGCAAGCGGTC. Rat insulin receptor F: CAGAAAAACCTCTTCAGGCAAT, R: TTCAAGGGATCTTCGCTTTC. Mouse glucagon F: TACACCTGTTCGCAGCTCAG, R: TTGCACCAGCATTATAAGCAA. Mouse glucagon receptor F: GATCCGAGTACGCTCGAGGA, R: GTTGTGGTGGCATTGGTCAC. GAPDH rat F: CTGCACCACCAACTGCTTAG, R: TGATGGCATGGACTGTGG. GAPDH mouse F: ATGGTGAAGGTCGGTGTGA, R: AATCTCCACTTTGCCACTGC. The PCR reaction was conducted in a 10 µl volume, containing 5 µl of HOT FIREPol EvaGreen qPCR Mix Plus, 2 µl of the primer set (at a dilution of 2.5 µM), and 3 µl of cDNA. The PCR conditions were as follows: an initial denaturation step at 95 °C for 10 min followed by 40 cycles of denaturation at 95 °C for 15 s, annealing at 60 °C for 1 min, and extension at 72 °C for 20 s. Subsequently, a melt curve analysis was carried out with the following steps: 95 °C for 15 s, 60 °C for 60 s, and 95 °C for 15 s.
Protein isolation
Cells were incubated with MOTS-s for 24 h on a six-well plate. Following this, they were collected using radioimmunoprecipitation assay (RIPA) buffer supplemented with protease inhibitors. The cell lysate was then vortexed and centrifuged twice and put in a thermomixer at 4 °C and shaken at 900 rpm for 10 min. After that, the lysate was centrifuged at 13,000 × g for 10 min. The resulting supernatant containing protein was transferred to new tubes, and protein concentration was measured with Pierce BCA Protein Assay (Thermo Fisher Scientific, Waltham, MA, USA).
Western blot
An equal amount of protein with the addition of Laemmli and β-mercaptoethanol was separated through sodium dodecyl sulfate polyacrylamide gel electrophoresis (SDS-PAGE) 12% gel electrophoresis and then transferred onto a polyvinylidene fluoride (PVDF) Western Blotting Membrane (Roche, Basel, Switzerland). To prevent nonspecific binding, the membrane was blocked using 3% bovine serum albumin. Subsequently, the membrane was incubated overnight at 4 °C with primary antibodies (antiMOTS-c, anti-insulin receptor, and anti-glucagon receptor) at a dilution of 1:1000.
Following the primary antibody incubation, the membrane was washed with TBST buffer and then exposed to a secondary antibody (antirabbit) at a dilution of 1:5000 for 1.5 h. After another round of washing with TBST, the signal was visualized using Super Signal™ West Pico PLUS (Thermo Fisher Scientific, Waltham, MA, USA). Next, the membrane was incubated with an anti-β-actin antibody overnight at 4 °C, followed by washing with TBST and incubation with a secondary antibody (antimouse) for 1 h. The signal was visualized using Clarity Western ECL Substrate (Bio-Rad, Hercules, CA, USA). The visualization process was performed using the ChemiDoc MP Imaging system (Bio-Rad, Hercules, CA, USA).
The antibodies used in WB were as follows: antiMOTS-c, rabbit polyclonal, cat. no. MBS542112 (MyBioSource, San Diego, CA, USA); antiinsulin receptor middle region, rabbit polyclonal, cat. no. MBS3205807 (MyBioSource, San Diego, CA, USA); antiglucagon receptor antibody, rabbit polyclonal. cat. no. OAAF04902 (Aviva Systems Biology, San Diego, CA, USA).
The secondary antibodies used were as follows: antirabbit IgG, cat. no. 7074P2 (Cell Signaling, Danvers, MA, USA); antimouse IgG, cat. no. A2304 (Sigma Aldrich, Saint Louis, MO, USA).


留言 (0)