
記住我


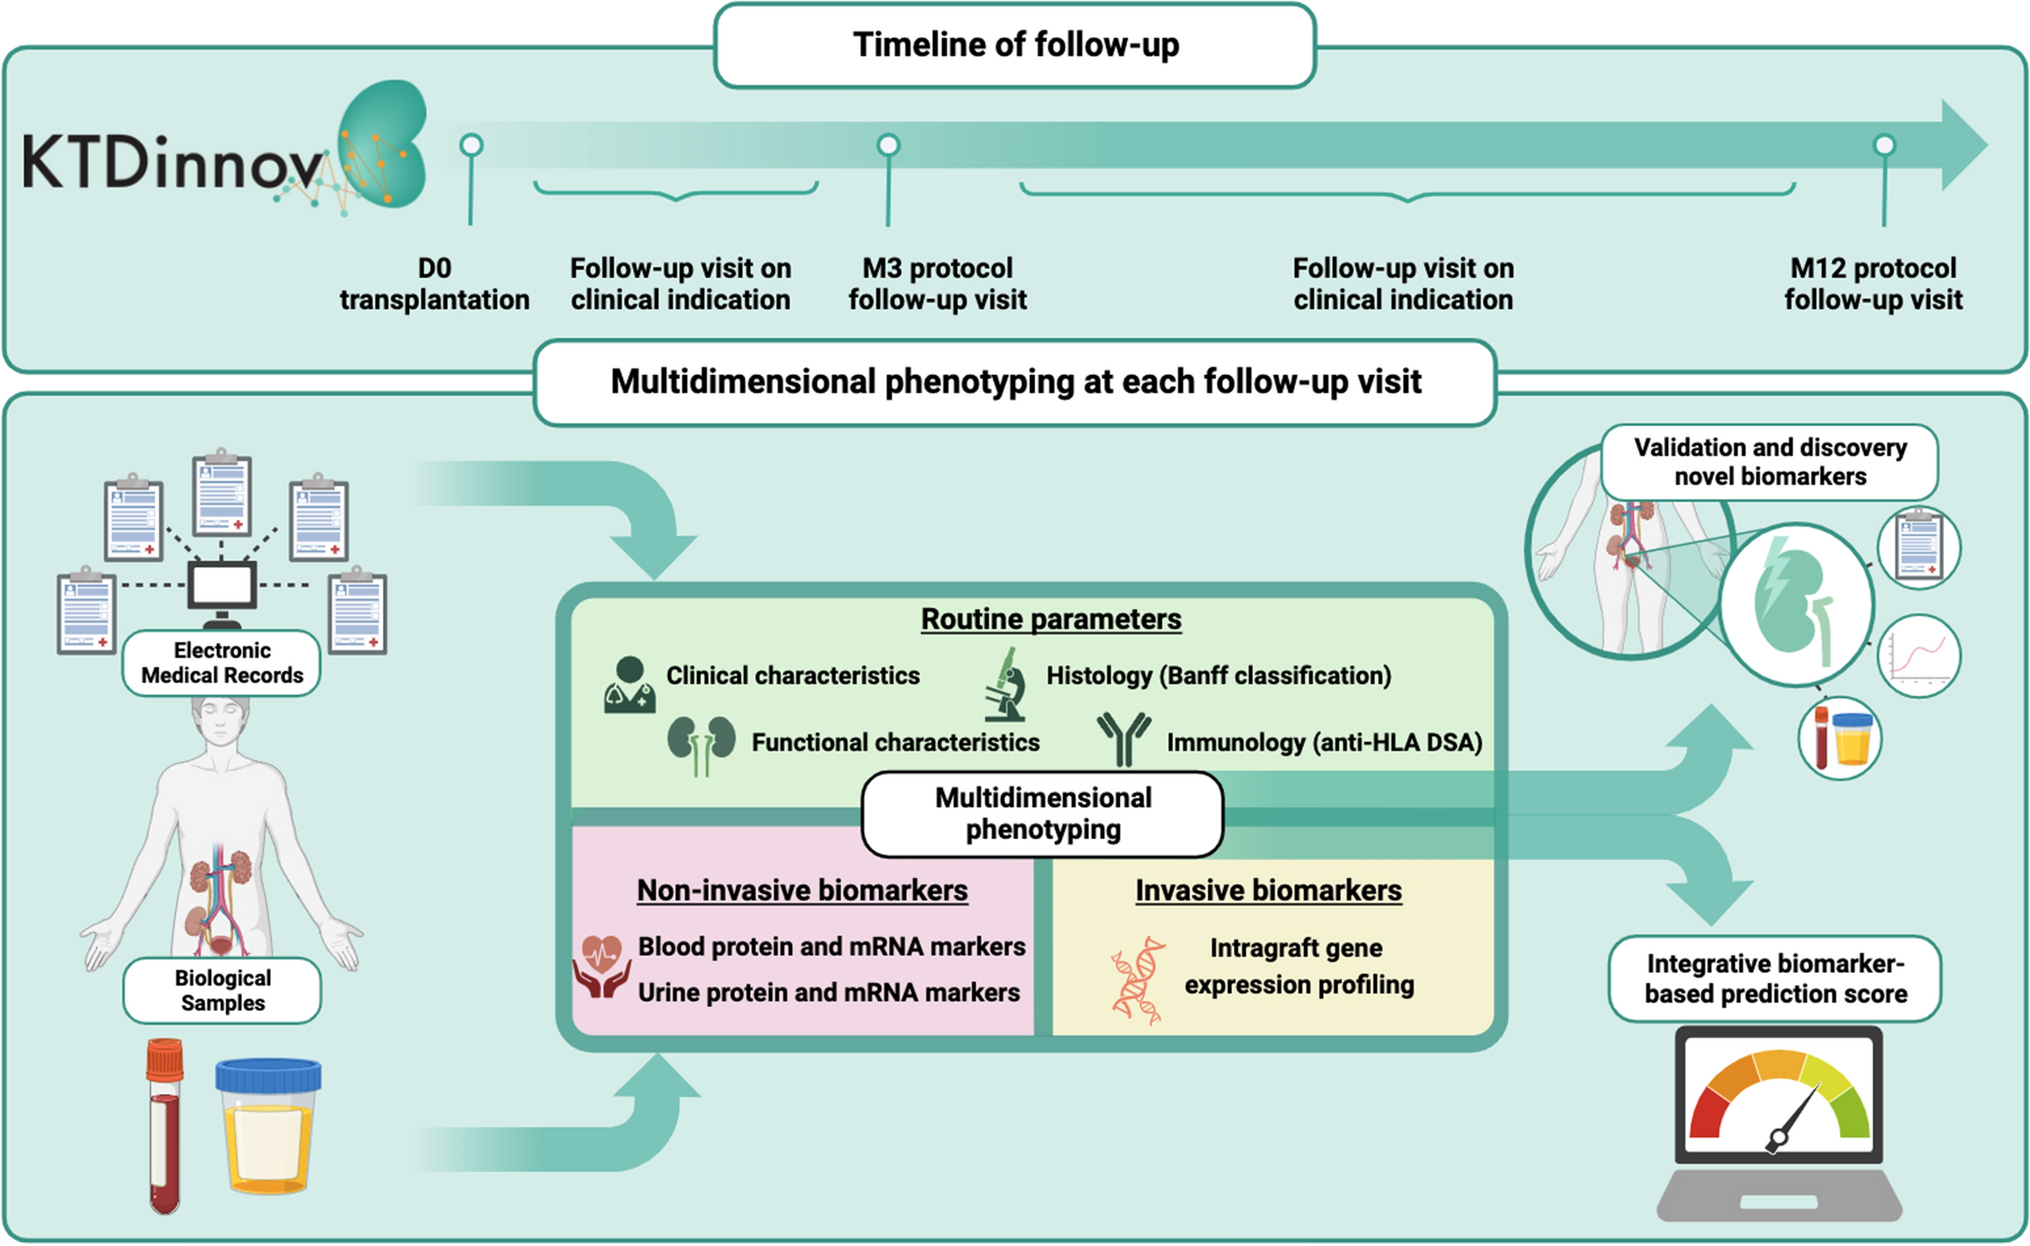


This study was based on several publicly available databases, which are summarized in the Supplementary File 1a, where we used the summary statistics without accessing any personal information. The study design is demonstrated in Fig. 1, which is also described below. We used two-sample MR to estimate the association between target gene expression (the exposure, say x) and BC risk (the outcome, say y) with effect size βxy. The basic principle of MR is that, if a modifiable exposure alters outcome then the instrumental variable (here genetic variants, say g) that modifies the level of that exposure, should also be related to the outcome [16]. Expression quantitative trait loci (eQTL) data were used to assess the association between genetic instruments and level of target gene expressions (βgx). The associations between genetic instruments and BC risk were estimated with genome wide association study (GWAS) summary statistics (βgy). In a MR analysis, βxy (defined as βxy = βgy/βgx) is interpreted as the effect of x on y free of non-genetic confounders. For a genetic instrument to be considered valid three basic assumptions must have held: (1) The genetic variants are associated with the exposure (relevance assumption); (2) There are no unmeasured confounders of the associations between genetic variants and outcome (independence assumption); (3) The genetic variants affect the outcome only through their effect on the exposure (exclusion restriction) [10]. We further performed sensitivity analyses to confirm the discovered MR associations such as assessment of pleiotropy, colocalization, and multiple tissue enrichment analyses.
Fig. 1
The flowchart of the study. x represents gene expression (exposure). y represents breast cancer risk (outcome). g represents genetic variants (instrumental variable). βgx is the effect size of the association between genetic variants and target gene expression (the exposure). βgy is the effect size of the association between genetic variants and breast cancer risk (outcome). βxy is the effect size of the association between target gene expression and breast cancer risk, estimated with βgx/ βgy using SMR. SNP single-nucleotide polymorphism, MR Mendelian randomization, GWAS genome wide association study, SMR summary-based MR, eQTL expression quantitative trait loci
Identification of drug target genesThe commonly prescribed antihypertensive medications, including ACEis, ARBs, beta-blockers (BB), calcium channel blockers (CCB), diuretics and other antihypertensive agents, were included for analysis [14]. We identified the genes targeted by these different classes of anti-hypertensive medication through DrugBank [17].
Discovery of genetic instruments for target gene expressionTo identify common single-nucleotide polymorphism (SNPs, population minor allele frequency > 1%) associated with the target gene expression of antihypertensive drug in whole blood, we extracted publicly available eQTL data (both genders) from eQTLGen (https://www.eqtlgen.org/). The consortium incorporates 37 datasets, with a total of 31,684 individuals of both genders and reports on 16,987 genes expressed in whole blood. The whole blood was used as the tissue for the main analysis because it is an easily accessed tissue. The eQTL SNPs for this analysis were from cis-regulated regions (1 MB on either side of a gene) with default p-value 5.0e–8. We used F statistic to assess the strength of the instrumental SNPs.
Validation of genetic instrument with systolic blood pressure GWASIn order to have valid instruments for the medication of interest (blood pressure-lowering medication), we performed a two-sample MR analysis with target gene expression in blood (using the eQTL data) as exposure and systolic blood pressure (SBP) as the outcome. SBP was chosen as it is relatively more important in the management of hypertension compared to diastolic blood pressure [18]. The summary statistics for SBP was a GWAS of SBP in 757 601 individuals of European ancestry (male and female) drawn from UK Biobank and the International Consortium of Blood Pressure Genome Wide Association Studies (ICBP) [19]. The summary-based MR (SMR) method (version 1.02) was used to perform the two-sample MR analysis [20]. For SNPs that passed the significance threshold for the SMR test (i.e., p < 0.05). Additionally, we performed the HEIDI (heterogeneity in dependent instruments) test to distinguish pleiotropy from linkage with p-value threshold of 0.01, in which up to top 20 SNPs by default were used for heterogeneity test with linkage disequilibrium (LD) pruning (0.05–0.9) [20].
Accumulation of genetic summary statistics for breast cancer riskWe obtained publicly available GWAS summary statistics for BC risk among women from the Breast Cancer Association Consortium (BCAC) [21]. The analysis for the overall BC risk included 118,474 cases and 96,201 controls of European ancestry participating in 82 studies. For analyses of BC molecular subtypes, 7325 participants were included for luminal A-like cases, 1779 for luminal B/HER2-negative-like cases, 1,682 for luminal B-like cases, 718 for HER2-enriched-like, 2006 for triple-negative cases and 20,815 for controls [21]. We also obtained the GWAS summary statistics for estrogen receptor-positive (ER+) and −negative (ER−) BC from BCAC, which contained 69,501 ER+BC cases, 21,468 ER-BC cases and 105,974 controls [22].
MR analysis between target gene expression in blood and breast cancer riskWe performed SMR analysis to estimate the association between target gene expression change (using whole blood eQTL) and BC risk (using GWAS). As the SMR results were based on the association of the top SNP, we additionally performed multiple SNPs-based SMR (SMR-multi) by including numerous associated SNPs at an eQTL locus in the SMR analysis, which may increase the power of the test [23]. The default value, 0.1 for LD r2 threshold was used to prune SNPs (eQTLs) in the SMR-multi test. The HEIDI test was also performed with SMR by default. Bonferroni correction was used to identify significant associations due to multiple testing. For the association that reached corrected significant level, we generated SMR locus plot using the method presented on SMR webpage (https://yanglab.westlake.edu.cn/software/smr/#Overview).
Sensitivity analysesColocalization analysisThis analysis was to assess if two independent association signals at the same locus, typically generated by two GWAS studies, are consistent with a shared causal variant. In the context of our study, we examined if the drug target gene expression and occurrence of BC shared a common causal variant in a given region by applying a Bayesian localization approach [24]. As a convention, a posterior probability larger than 0.80 was considered supportive for a common causal variant. The R package ‘coloc’ (v3.1, https://cran.r-project.org/web/packages/coloc/) was used to perform the test [24]. Given ‘coloc’ assumes a single causal variant, we also performed ‘coloc.SuSiE’ considering the existence of multiple causal variants. However, no credible sets were found for BC possibly due to the relatively high p value in BC GWAS [25]. Thus, we only presented the results based on single causal variant according to the recommendation provided by the author of ‘coloc.SuSiE’ [25].
Assessment of horizontal pleiotropyHorizontal pleiotropy occurs when any effects of the genetic variant on the outcome are through pathways other than via the exposure of interest (here target gene expression). It can distort MR tests, leading to inaccurate causal estimates, loss of statistical power and potential false-positive causal relationships. We tested horizontal pleiotropy by extracting available associations with all other nearby genes (within a 2 MB window) for each genetic instrument. Only cis-genes were considered for the analyses due to the proximity to the gene of interest and biological relevance conferred owing to gene expression. For the nearby genes showing significant association with the genetic instrument, we performed SMR analysis to test if the expression of these genes was associated with BC risk. For those genes with significant SMR associations, colocalization analysis was performed to estimate the probability that two association signals shared the same causal variant.
Multiple tissue sensitivityWe then evaluated the impact of the actionable targets in several different tissues along with whole blood and breast epithelium. Gene set enrichment analysis was performed with the assorted drug target genes to quantify all biological pathways prone to be affected by the drugs. RNA seq data on different tissues (except prostate and testis) were utilized for this purpose and analyzed with the R package ‘TissueEnrich’ [26]. The enrichment analysis queried expression modulation with fold changes across different human tissue types. A significant departure was defined at an adjusted fold change in expression of value 2 and the fold change was also tested for statistical significance. For tissues that showed significant fold changes, further MR association between tissue-specific gene expression and BC risk were assessed using GTEx (V8) cis-eQTL summary statistics (https://yanglab.westlake.edu.cn/data/SMR/GTEx_V8_cis_eqtl_summary.html). The cut-off used to identify eQTLs in GTEx was the same as the one for blood. We listed breast epithelium separate from other tissue because it is the most relevant for breast cancer.
Differential gene expression in expression atlasTo further analyze potential biological implications of the causal variants, we retrieved transcriptomic data of the significant genes for tumor tissue (or other tissue from BC patients) and normal tissue (or other tissue from healthy controls) on Expression Atlas (https://www.ebi.ac.uk/gxa/home). Differential gene expressions between tissues were evaluated as fold change using normal tissue (or other tissue from healthy controls) as reference.
Phenotypes associated with the top SNPs of significant genes in PhenoScannerWe identified the traits and diseases that were associated with the causal variants in PhenoScanner (v2) for the significant genes and checked the relevance of these phenotypes with breast cancer risk from literature. The traits were retrieved based on p value less than 5.0e–8, and r2 > 0.8 with European ancestry.
MR analysis to estimate the association of SBP with breast cancerTo determine whether the association between drug target gene expression and BC risk was likely to be mediated via changes in blood pressure or whether the association may be driven independently, we estimated the effect size for the association between genetically estimated SBP and BC using the generalized summary data-based MR (GSMR) method [27]. The GSMR (implemented in Genome-wide Complex Trait Analysis, version 1.91.7) is an extension of SMR that uses multiple genetic variants associated with the exposure to test for potential causality. The above-mentioned GWAS summary statistics on SBP (exposure) and overall BC risk (outcome) in European individuals were used for the analysis. As usual, a HEIDI p < 0.01 was used to detect outlying variants. In addition, we performed two-sample MR analysis using the R package Two-Sample MR to check the consistency of the signals from the two different methods. Two-sample MR were performed with consideration of LD of the instrumental SNPs.
留言 (0)