
記住我


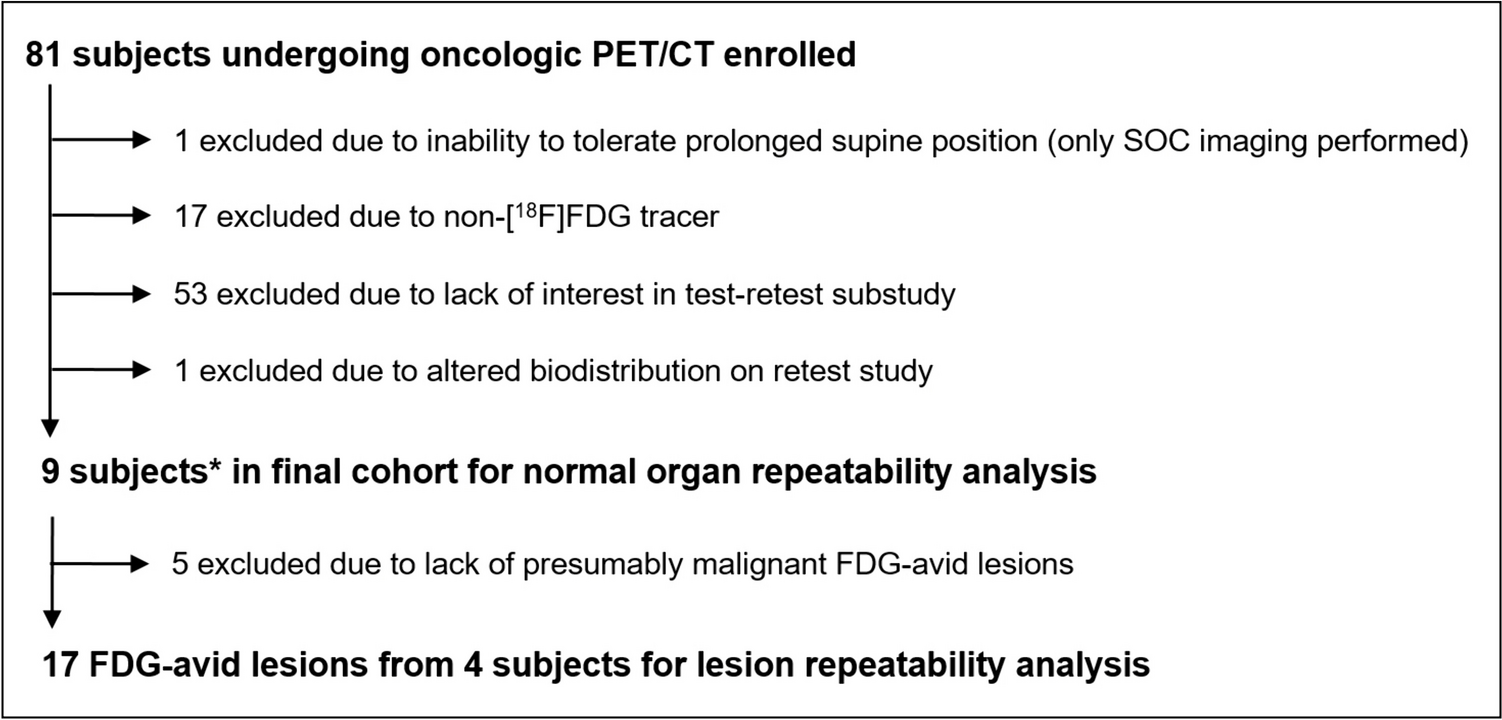
In this retrospective single-centre study, we identified 81 patients who received treatment with [177Lu]Lu-PSMA-I&T between October 2018 and January 2023. Eligible patients had mCRPC, underwent [68Ga]Ga-PSMA-11 PET/CT before treatment, and had serum PSA levels available at baseline and after each cycle of treatment. We excluded patients who discontinued treatment due to major adverse events such as renal failure or had a second malignancy. Finally, 60 patients were included (Fig. 1). Prior to PSMA radioligand therapy (RLT), all patients underwent standard second-line androgen deprivation therapy (ADT) with enzalutamide or abiraterone and third-line chemotherapy. Local radiotherapy and systemic [223Ra]Ra-dichloride RLT have been performed in 41 (68%) and 2 (3%) patients, respectively. Blood testing was carried out upon patient admission for every RLT session.
Fig. 1
Patient selection flowchart
PSMA Preparation and PET/CT AcquisitionThe [68Ga]Ga-PSMA-11 was prepared using a commercially available cold kit (Telix Pharmaceuticals, Inc. Australia) and a commercial 68Ge/68Ga generator (Galli Ad®) manufactured in compliance with good manufacturing practices (GMP). Quality check was performed by thin-layer chromatography (TLC) to ensure radiochemical purity > 95%. The imaging was conducted systematically following standard procedure guidelines [19], which included scanning from the base of the skull to the proximal femur using two PET/CT scanners (Philips Ingenuity TF, Amsterdam/the Netherlands, and Siemens Biograph mCT, Erlangen/Germany). The [68Ga]Ga-PSMA-11 PET acquisition time was 2.5 min. per bed-position with a mean interval of 60 min (SD ± 14.4 min) between tracer administration and the start of the imaging. The mean injected activity per kg/body weight was 2.15 MBq. For attenuation correction and localization, a non-contrast-enhanced low-dose CT scan was performed (Siemens: Care Dose 4D, Care kV, slice thickness 1.2 mm and pitch 1.5; Philips: 100 kV, 33 mAs, slice thickness 1.5 mm and pitch 0.8). The reconstructed slice thickness was 3 mm, using iDose mode level 3 (Philips Ingenuity TF), respectively, SAFIRE level 3 (Siemens Biograph). Both PET/CT scanners are EARL/EANM accredited, and thus their performance is assumed to be similar.
PET/CT Analysis and InterpretationQuantitative analysis was performed using Syngo.via platform (Siemens Healthineers, Erlangen, Germany). The visual evaluation was conducted by two experienced nuclear medicine physicians, who reached diagnostic decisions through consensus. The readers were blind to the clinical information of patients, including serum PSA levels, and were only aware of PCa diagnosis. Structures with physiologic PSMA uptake (e.g. salivary glands) or known PSMA false-positive findings (e.g. celiac ganglia) were excluded. Lesions with visually higher uptake than the lumbar vertebral body were rated as PSMA-positive, indicating metastases [20]. Measurements of SUVmax, SULmax, SUVpeak, and SULpeak of the most-avid lesion, as well as SUVmean values for the parotid gland (P-SUVmean) and healthy liver tissue (L-SUVmean) as backgrounds, were taken using a standard volume region of interest (VOI).
Volumes of interests (VOIs) were delineated using isocontours set at two different thresholds: 45% of the maximum uptake [20] and a fixed SUVmax of 3 [21, 22]. These contours were drawn for all PSMA-positive lesions, and the contoured volumes were summed up for each patient. Subsequently, the PSMA tumour volume (PSMA-TV) and total lesion PSMA (TL-PSMA; calculated as PSMA-TV multiplied by SUVmean) were determined and reported at the aforementioned thresholds separately (generating PSMA-TV-45% and PSMA-TV-3, as well as TL-PSMA-45% and TL-PSMA-3). The number of metastatic lesions and prominent sites of the disease (prostate, lymph nodes, bone, and viscera) was also recorded.
[177Lu]Lu-PSMA Therapy[177Lu]Lu-PSMA-I&T was administered based on the recommendations of the multidisciplinary team, including board-certified nuclear medicine physicians, urologists, oncologists, radiologists, and pathologists. All patients received at least one cycle of [177Lu]Lu-PSMA-I&T RLT, with a mean interval of 6–8 weeks between consecutive cycles. The standard therapy protocol included 4–6 cycles of [177Lu]Lu-PSMA-I&T RLT unless patients revealed a major adverse event or showed a significant progression which resulted in therapy termination based on the multidisciplinary team consensus.
In each cycle, 7.4 GBq of [177Lu]Lu-PSMA I&T was administered, with a reduction of approximately 20% in activity if an individual exhibited decreased renal or haematological function. Prior to treatment infusion, each patient received intravenous hydration (500 mL 0.9% NaCl) and cooling of the salivary glands, starting 30 min before treatment infusion. The [177Lu]Lu-PSMA-I&T solution was administered intravenously by a perfusion system within 20 min.
Response AssessmentAll patients had serum PSA measurements after each cycle within 6–8 weeks. In the interpretation of treatment response, we interpreted the PSA values based on the prostate cancer working group 3 (PCWG3). Blindly to these interpretations and patients’ serum PSA levels, we evaluated [68Ga]Ga-PSMA-11 PET/CT findings based on RECIP (version 1.0). Finally, we synthesized these findings based on a novel framework for response evaluation criteria (PSA + RECIP) for those patients who underwent follow-up PET/CT imaging [18]. The final interpretation of patients’ response to therapy was made based on clear-cut definitions for each response group (partial response, PSA decline ≥ 50% or RECIP-PR; progressive disease, PSA increase ≥ 25% or RECIP-PD; stable disease, being stable in both evaluations). Detailed definitions are provided in Table 1. Then, we dichotomised the results into progressive versus controlled disease (stable disease or partial response), according to the patient’s outcome [16, 17].
Table 1 Response to treatment frameworkPatient Follow-upThe follow-up period was determined starting from the date of the first RLT cycle. Typically, patients underwent monthly laboratory testing during this period. In cases where patients passed away during their treatment, the date of their death was recorded.
Statistical AnalysisAll parameters were analyzed at the patient level. Continuous and categorical variables were presented as mean ± standard deviation (SD) and frequency (%), respectively. The differences in the clinical and PET/CT parameters between response groups were evaluated using the chi-square test or Student’s t-test for the categorical or continuous variables, respectively. Next, we evaluated the association of the serum PSA and pre-treatment [68Ga]Ga-PSMA-11 PET/CT semi-quantitative parameters with the response to treatment using logistic regression. We tried to find a cut-off for SULmax based on the Youden index (maximization of the summation of sensitivity and specificity using receiver operating characteristic curves). The dichotomized variables entered the multivariate analysis to find the most significant predictor.
In the prognostic evaluation, the continuous variables that were significantly associated with the response were converted to categorical variables. Again, the Youden index was used for this conversion. Regarding OS, univariate analysis was performed using the Kaplan–Meier method. The significance of the difference was investigated using the univariate Mantel-Cox log-rank test. Significant parameters in the univariate analysis entered the multiple Cox regression and were provided with their hazard ratio. All data were gathered and analyzed using SPSS software (IBM, ver. 22). The statistical significance level was set at a two-sided p-value less than 0.05.
留言 (0)