
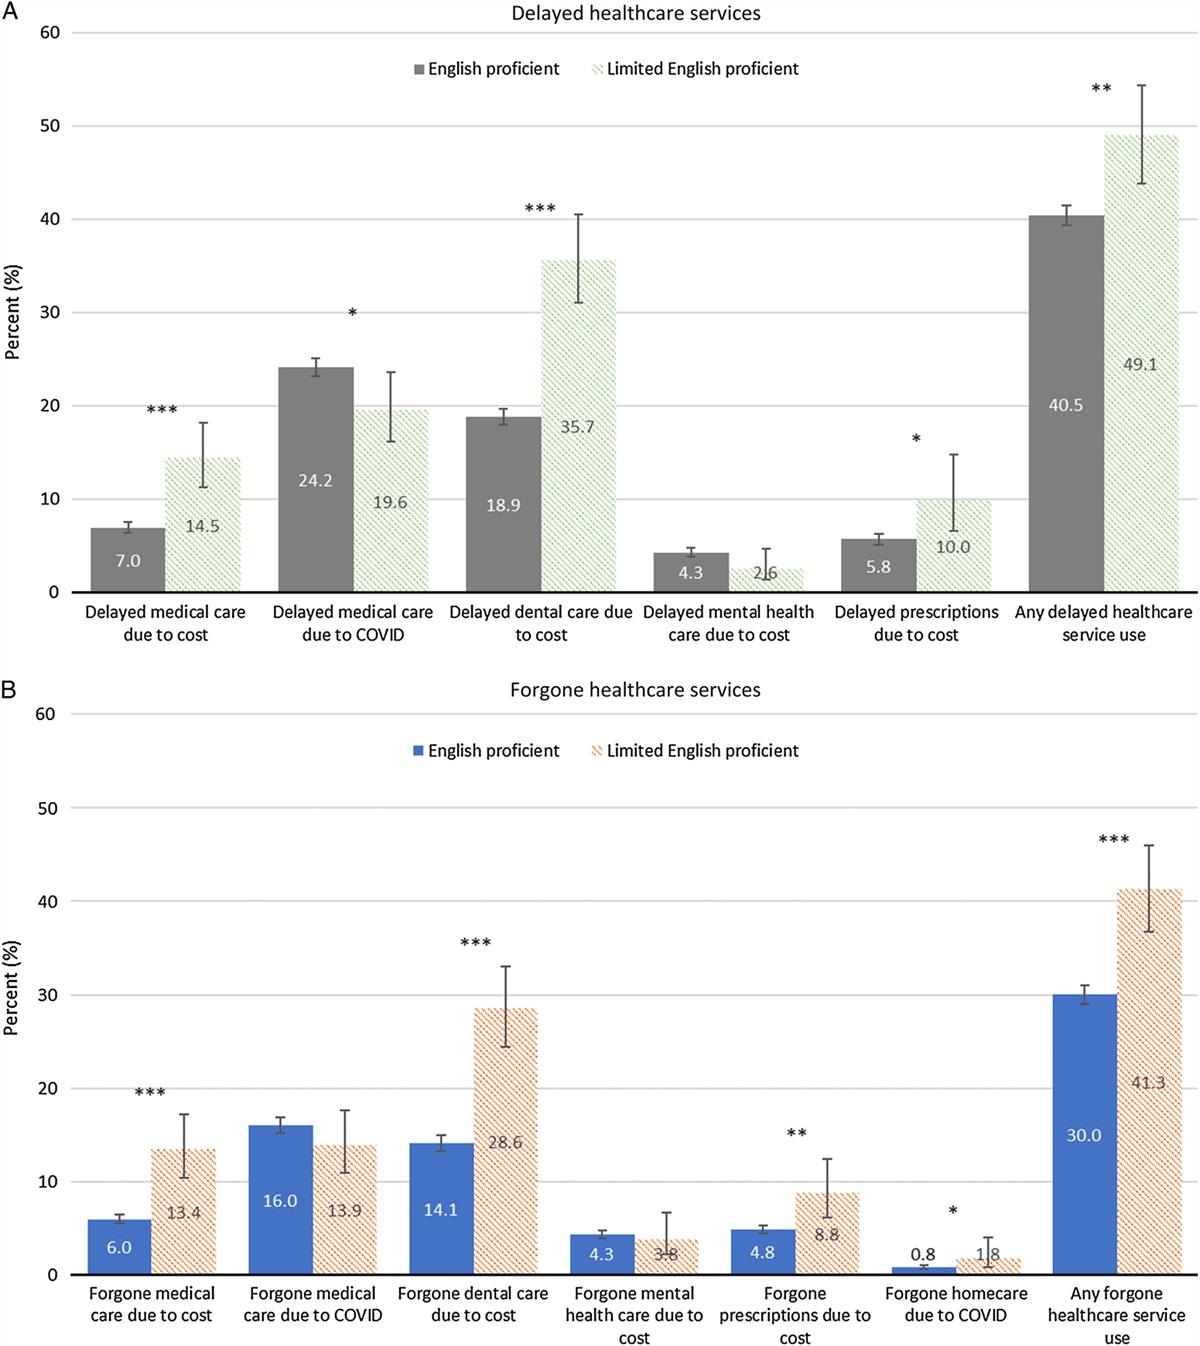
記住我
Of the 38 Medicaid programs that risk adjust payments to Medicaid managed care organizations (MCOs), 33 of them use the Chronic Illness and Disability Payment System (CDPS) or a related model (Table 1). Risk-adjustment models typically use diagnosis or pharmaceutical codes from claims or encounter data to measure illness burden among groups of beneficiaries enrolled in managed care plans. The resulting risk scores are then used to adjust capitation payments received by the plans to account for differences in the severity of illness in their enrolled populations. The CDPS model maps International Classification of Disease (ICD) codes to CDPS categories.1 Medicaid Rx is a pharmacy-based system that uses National Drug Classification (NDC) data from claims and encounters to develop profiles based on types of pharmacotherapy.2 CDPS+Rx is a combination of the CDPS and Medicaid Rx (MRX) models.
TABLE 1 - Risk-Adjustment Efforts by State Population Year Classification State Covered Implemented System Arizona SSI + TANF + EXP 2020 CDPS+Rx California SSI + TANF + EXP 2009 Medicaid Rx Colorado SSI + TANF 1997 CDPS Delaware SSI + TANF + EXP 2000 CDPS+Rx District of Columbia SSI + TANF 2014 CDPS+Rx Florida SSI + TANF 2006 CDPS+Rx Georgia TANF 2017 CDPS+Rx Hawaii SSI + TANF + EXP 2014 CDPS+Rx Illinois SSI + TANF + EXP 2011 CDPS+Rx Indiana SSI + TANF + EXP 2015 CDPS+Rx Iowa SSI + TANF + EXP 2016 CDPS+Rx Kansas SSI + TANF + CHIP 2018 CDPS+Rx Kentucky SSI + TANF + EXP 2019 CDPS+Rx Louisiana SSI + TANF + EXP 2012 ACG Maryland SSI + TANF 1997 ACG Massachusetts SSI + TANF 2009 DxCG Michigan SSI + TANF + EXP 2000 CDPS+Rx Minnesota TANF + EXP + BHP + SSI 2000 CDPS+Rx Mississippi SSI + TANF 2017 CDPS+Rx Missouri TANF 2012 CDPS+Rx Nebraska SSI + TANF 2018 CDPS+Rx Nevada TANF + EXP * CDPS+Rx New Hampshire SSI+ TANF + EXP 2014 CDPS+Rx New Jersey SSI + TANF + EXP 2000 CDPS+Rx New Mexico SSI + TANF + EXP 2021 CDPS+Rx New York SSI + TANF 2008 CRG North Carolina SSI + TANF 2021 CDPS+Rx Ohio SSI + TANF 2006 CDPS+Rx Oregon SSI + TANF + EXP 1998 CDPS+Rx Pennsylvania SSI + TANF + EXP 2003 CDPS+Rx South Carolina SSI + TANF 2009 CDPS+Rx Tennessee SSI + TANF 2000 ACG Texas SSI + TANF + CHIP 2007 CDPS+Rx Utah SSI 1998 CDPS Virginia SSI + TANF + EXP 2003 CDPS Washington SSI + TANF + CHIP + EXP 2003 CDPS+Rx Wisconsin SSI + TANF 2011 CDPS+Rx Puerto Rico SSI + TANF + EXP 2018 CDPS+Rx*Unknown.
ACG indicates Ambulatory Care Groups; CDPS, Chronic Illness and Disability Payment System; CHIP, Children's Health Insurance Program; CRG, Clinical Risk Groups; DxCG, Diagnostic Cost Groups; EXP, Medicaid expansion population; SSI, disabled Medicaid beneficiaries; TANF, Medicaid eligibility under temporary aid to needy families or other family categories.
The CDPS model focuses on conditions more common among Medicaid beneficiaries including persons with disabilities. In this way, CDPS differs from other risk-adjustment models such as the Centers for Medicare & Medicaid Services-Hierarchical Coexisting Conditions (CMS-HCC) model that was developed for Medicare using Medicare data3 or the HHS-HCC model developed for the state health exchanges using commercial claims and encounter data.4 CDPS was originally designed to be predictive of spending while being resistant to gaming and over coding. Thus, the original CDPS model included 58 categories within 19 hierarchies compared with 76 categories used in the V22 version of the CMS-HCC model and 127 HHS-HCCs.
The CDPS was initially developed in 2000 using data from 7 fee-for-service (FFS) state Medicaid programs. The model received major updates in 2009, using national FFS Medicaid data from 2002 to 2005, and in 2014, using national FFS Medicaid data from 2011. In 2016, ICD-10 codes were incorporated into CDPS using the CMS General Equivalence Mappings. CDPS has received regular annual updates to include the most recent ICD and NDC codes.
This paper describes an update to the CDPS models. We used data from 3 national Medicaid MCOs to update the mapping of diagnoses to CDPS categories, taking advantage of the revised ICD coding system and reflecting changes in health care practice over time as well as any differences in practice in MCOs. To the extent that new treatments and technology have changed how patients are treated, the relative weights estimated with 2011 data may not accurately reflect the relative cost in 2019. In 2020, 72% of Medicaid beneficiaries were enrolled in managed care plans.5 To the extent that treatment patterns differ across managed care and FFS, the relative weights estimated in earlier versions of CDPS may not accurately reflect the treatment patterns in MCOs.
Further, we test whether spending on Medicaid beneficiaries living in economically and socially deprived communities is greater than spending on similar beneficiaries in less deprived communities. This work contributes to the growing literature exploring whether and how risk adjustment can be used to address the disparities in health and health outcomes experienced by patients with greater social needs.6–9
METHODS Data and SettingHealth care eligibility and claims records were provided by 3 national Medicaid MCOs. The data covered 3 years, 2017–2019, and 8 states: Florida, Illinois, Kansas, Kentucky, Louisiana, Michigan, New Jersey, and Washington. The data were limited to Medicaid beneficiaries with full benefits and without dual eligibility under Medicare. The data included disabled beneficiaries and nondisabled child (age below 19) and adult (age 19 years or above) beneficiaries, including those covered under Medicaid expansions. Eligibility data included demographics (age and sex), aid category, and months enrolled during the year. Claims data included the year of service, procedure, ICD and NDC codes, and the amounts paid by the organizations to providers for their services. The resulting data include just over 17M person-year observations: 1.4M disabled beneficiaries, 9.2M children, and 6.4M adults.
CDPS Analysis MethodsThe 2000 CDPS model was developed using an iterative process that combined clinical and economic expertise. ICD codes were initially ordered within major categories corresponding to body systems or types of disease. These codes were then combined, typically at the 3-digit level, into stage 1 groups. Linear regression of stage 1 group indicators on health expenditures was used to generate estimated coefficients for these stage 1 groups. Linear regression was chosen in favor of alternatives, including nonlinear regression, multipart, or machine-learning models. Linear regression has traditionally been used in risk adjustment, and introducing a new modeling approach would add complexity to the interpretation of the coefficients and application of the models to adjust payment. In addition, the CDPS algorithm was developed using linear regression, and it is not clear if the linear function form of CDPS could be accurately applied using nonlinear models.
Two specifications of expenditures are used in the CDPS model. Concurrent expenditures are those that occur within the year that the diagnoses are assigned to CDPS categories. Prospective expenditures are those that occur within the following year. In the concurrent model, at least 6 months of enrollment is required to establish stable CDPS profiles. The prospective model additionally requires at least 1 month of enrollment in the following year. The dependent variable is the ratio of monthly health care expenditures to average expenditures by category of enrollment. Beneficiaries without any expenditures in the year are included in the analysis with a ratio of zero. Regressions are weighted by months of enrollment. Separate models are estimated for the disabled, children, and adults.
Multiple iterations of these regressions were reviewed by a team of clinical experts and health service researchers. The results were used to combine stage 1 groups into CDPS categories and to create hierarchies within major categories. Combining the stage 1 groups into CDPS categories and categories into hierarchies helps to reduce the potential overfitting of the model to the data and reduces the incentive and ability for upcoding and gaming the algorithm to maximize reimbursement. Diagnoses were excluded if they are not associated with costs or if they were clinically not well defined. Diagnoses from laboratory or radiology claims were excluded since they are sometimes listed as “rule-out” diagnoses. The 2000 model had 58 CDPS categories within 19 major categories. Categories higher in the hierarchy had greater coefficients and generally lower numbers of beneficiaries than categories lower in the hierarchy.
A similar approach was used in the 2022 revision. An initial run of the 2000 model using newer data from 3 national Medicaid MCOs showed that some of the hierarchies were not maintained. Stage 1 groups were recreated using ICD-10 codes for each of the affected major categories. Linear regression analyses were conducted by each major category after replacing the respective CDPS categories with stage 1 groups. These regression results were reviewed to determine which stage 1 groups should be reordered to improve the hierarchy while maintaining clinical accuracy. The updated CDPS model was re-estimated after each reordering. If the hierarchy still appeared insufficient, then the stage 1 groups were revisited and reordered. Iterations of this process were continued until each major category had an acceptable hierarchy.
In developing the 2000 model, to avoid overfitting the data, we used a split-sample design, whereby we developed the model on a 75% sample of the data and compared the result when applying the resulting algorithm to the remaining 25% of the data. In this revision, we decided against using a split-sample approach for the reason that this revision did not involve as much adding diagnoses as it did reordering diagnoses. Thus, we were less concerned with overfitting than we were with having an adequate sample size to revise and re-estimate the model.
MRX Analysis MethodsAn initial run of the MRX model showed that the model was relatively stable over time. However, some MRX categories had very low or negative coefficients. Some of these categories were dropped from the model. Others were restricted to classes of medications appropriate for the most serious manifestations of disease in that category. Several MRX categories related to infectious diseases were incorporated into a hierarchy. Finally, a new category was created for Rare Diseases. This category includes medications that are used in patients with a disease state prevalence of fewer than 20,000 in the United States and in which the drug cost is $150,000 or more for the average weight and dosing.
CDPS+Rx Analysis MethodsThe CDPS+Rx model includes all CDPS categories and a subset of 15 restricted MRX categories that we consider to be the least affected by variations in physician prescribing patterns. An initial run of the model included each of these categories along with CDPS. The resulting coefficients were examined to determine where the MRX categories would be most appropriately included in the CDPS hierarchies. An algorithm was developed to integrate the 15 MRX categories into CDPS.
Social Deprivation IndexIndicators based on the Social Deprivation Index (SDI) were used to examine whether spending on Medicaid beneficiaries living in economically and socially deprived communities is greater than spending on similar beneficiaries in less deprived communities.10 The SDI is a composite measure of disparity that uses place-based data on education, employment, income, density, car and home ownership, and family structure to assign an index value to a geographic area. We used the zip code of residence to assign each beneficiary an SDI value and included these values as a set of categorical indicators (rounded up to the tens place) into the CDPS regression analysis. We considered using information on beneficiary race and ethnicity and using Z-codes to identify unhoused beneficiaries, but concerns from our MCO partners, which we shared, about incomplete and inconsistent coding caused us to use area characteristics as a measure of disadvantage. This approach follows the recommendations of a committee report from the National Academy of Medicine.3
RESULTSThe revised CDPS+Rx model is shown in Table 2. The revised model has 52 CDPS categories within 19 major categories. Six CDPS major categories were revised: psychiatric, pulmonary, renal, cancer, infectious disease, and hematological. Table 3 provides counts for the 15 restricted MRX categories and shows where they were integrated into the CDPS model. The 15 restricted MRX indicators were included in 8 major CDPS categories and at every level of severity from extra high to extra low. The MRX category for Rare Diseases did not fit naturally within any of the CDPS major categories and thus remained as an independent category with relatively few individuals but very high-estimated coefficients. More detail on changes made in updating the models is available on the CDPS website: https://hwsph.ucsd.edu/research/programs-groups/cdps.html.
TABLE 2 - Concurrent CDPS Model CDPS CDPS description SSI TANF child TANF adult SSI N TANF child N TANF adult N Baseline Intercept 0.018 0.159 0.066 1,438,330 9,246,704 6,417,719 CARVH Cardiovascular, very high 2.535 94.17 7.210 12,841 1476 7599 CARM Cardiovascular, medium 0.580 8.486 1.469 138,967 38,222 192,901 CARL Cardiovascular, low 0.159 2.963 0.512 152,303 134,182 323,763 CAREL Cardiovascular, extra low 0.068 0.583 0.120 338,525 48,853 1,127,054 PSYH Psychiatric, high 0.776 5.839 2.033 73,896 2763 35,375 PSYM Psychiatric, medium 0.545 2.721 1.087 26,082 30,946 52,120 PSYL Psychiatric, low 0.269 1.206 0.363 547,021 903,702 1,310,917 SKCM Skeletal, medium 0.706 1.776 2.336 78,613 178,683 115,682 SKCL Skeletal, low 0.182 0.714 0.509 178,464 354,555 442,149 SKCVL Skeletal, very low 0.041 0.167 0.226 103,037 48,727 280,369 CNSH CNS, high 1.924 15.12 8.246 16,393 2875 9055 CNSM CNS, medium 0.273 2.270 1.312 47,191 13,570 38,667 CNSL CNS, low 0.273 2.209 0.637 250,565 134,202 345,727 PULVH Pulmonary, very high 2.398 64.31 7.490 28,426 7078 15,563 PULH Pulmonary, high 1.596 6.583 2.647 5960 20,423 4971 PULM Pulmonary, medium 0.754 4.487 1.645 87,675 68,431 133,525 PULL Pulmonary, low 0.089 0.488 0.256 283,555 818,127 572,755 GIH Gastro, high 1.508 27.979 4.131 25,576 9663 18,043 GIM Gastro, medium 0.341 4.612 0.980 71,167 19,189 162,910 GIL Gastro, low 0.121 0.602 0.346 252,498 369,009 651,483 DIA1 Diabetes, type 1 0.796 5.951 1.928 27,790 14,176 50,078 DIA2 Diabetes, type 2 0.247 0.428 0.463 226,426 9320 493,269 SKNH Skin, high 1.281 21.289 5.443 11,773 1007 6580 SKNL Skin, low 0.416 4.418 1.342 18,496 1952 22,267 SKNVL Skin, very low 0.132 0.410 0.257 110,561 333,866 364,461 RENEH Renal, extra high 2.585 154.3 7.521 9241 278 4207 RENM Renal, medium 0.170 3.227 0.918 66,143 6921 72,275 RENL Renal, low 0.170 0.583 0.453 87,216 86,449 124,946 SUBL Substance abuse, low 0.283 5.584 0.964 85,008 13,602 269,156 SUBVL Substance abuse, very low 0.000 1.393 0.291 31,655 4102 84,225 CANVH Cancer, very high 3.641 32.19 11.00 12,893 441 10,908 CANH Cancer, high 1.352 9.926 4.557 20,321 4792 22,871 CANM Cancer, medium 0.400 4.995 1.151 16,238 4608 27,357 CANL Cancer, low 0.000 0.933 0.377 19,285 1793 38,289 DDM DD, medium 0.287 3.711 4.807 6053 367 191 DDL DD, low 0.075 3.661 0.957 53,914 21,540 6558 GENEL Genital, extra low 0.059 0.932 0.273 66,038 74,100 331,776 METH Metabolic, high 0.936 5.278 1.189 36,738 44,356 61,586 METM Metabolic, medium 0.446 4.950 0.832 96,893 25,325 190,138 PRGCMP Pregnancy, complete 0.338 2.327 1.180 14,030 17,714 488,479 PRGINC Pregnancy, incomplete 0.023 0.709 0.178 4538 8285 119,729 EYEL Eye, low 0.333 2.624 0.559 10,859 5809 23,365 EYEVL Eye, very low 0.055 0.421 0.282 77,661 41,208 121,812 CERM Cerebrovascular, medium 0.413 7.697 2.576 21,265 1334 13,690 INFVH Infectious, very high 4.717 29.05 7.281 1,915 938 2195 INFH Infectious, high 2.305 13.72 4.871 18,223 2966 37,666 INFM Infectious, medium 1.100 1.473 2.437 52,775 101,033 95,030 INFL Infectious, low 0.000 0.426 0.213 42,274 6291 100,388 HEMEH Hematological, extra high 13.16 40.34 19.87 582 1115 762 HEMVH Hematological, very high 2.292 40.34 5.894 8,190 1716 7315 HEMM Hematological, medium 0.836 2.416 1.224 17,557 28,484 25,937 HEML Hematological, low 0.638 2.416 1.224 28,573 28,219 58,004 MRX13 Rare diseases 26.57 145.5 70.6 429 302 224 R-squared — 0.26 0.11 0.39 — —
留言 (0)