Background:
Between 2004 and 2019, the US hospital industry reversed the 21-year decline in its share of national health spending.
Objective:
To measure and explain changes in hospital utilization, cost, charges, and inpatient case mix.
Data Sources:
Principal sources were the American Hospital Association annual survey, the National Inpatient Sample, and the Healthcare Cost Reporting Information System. The study included all US community hospitals (n=5141 in 2019).
Analytic Approach:
We used factor decomposition to separate the impacts of population, utilization, unit cost, and charge markups on the growth in cost and charges for inpatient and outpatient care nationwide and for each state. For unit cost, we separated the impacts of input price inflation and treatment intensity. To measure the inpatient case mix, we applied an all-patient diagnosis-related groups algorithm.
Results:
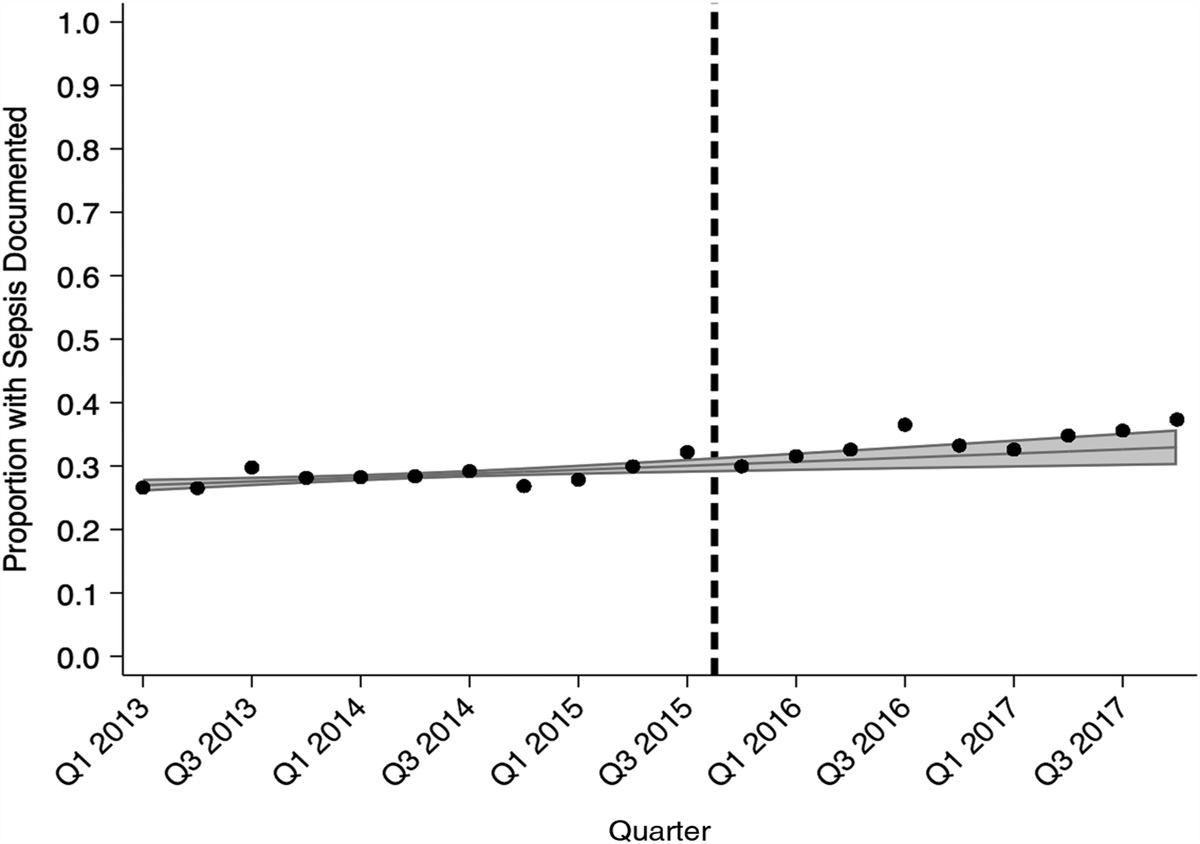
Between 2004 and 2019, charges more than tripled to $4.11 trillion. The cost more than doubled to $911 billion. For inpatient care, discharges fell 5%, discharges per person fell 15%, cost per discharge increased 88%, and charge markups rose 43%. For outpatient care, visits rose 36%, visits per person rose 21%, cost per visit rose 119%, and charge markups rose 52%. Treatment intensity increased by 33% per discharge and 55% per visit. Nationwide, the inpatient case mix increased by 34%, reflecting sicker patients and better clinical documentation.
Conclusions:
We quantified 3 important trends: rapid growth in outpatient visits, increased treatment intensity, and sustained increases in markups. Increased treatment intensity was the largest factor behind $491 billion in hospital cost growth between 2004 and 2019.


留言 (0)