
記住我


Sepsis, which is defined as life-threatening organ dysfunction caused by a dysregulated host response to infection, remains an ongoing threat to human health worldwide. Septic shock is the most severe subset of sepsis, and it involves greater cell, circulation, and metabolism abnormalities (1). Despite an overall improvement in management of sepsis patients, there is a global estimate of almost 31.5 million sepsis cases and potentially 5.3 million deaths annually (2). Indeed, the number of cases is rising, leading to more expenses and contributing to one-third to half of deaths among hospitalized patients (3).
Similar to other illnesses, sepsis is a time-dependent disease, and a rapid and accurate diagnosis will significantly shorten the disease course and improve prognosis. For each 1-h increase in door-to-antimicrobial time, the death rate increases in sepsis patients by 20% (4). However, because of the lack of a criterion standard, most diagnoses rely on medical history, empirical diagnosis, and blood culture results. Wu and colleagues (5) retrospectively analyzed the blood culture results of critically ill adult patients in the intensive care unit (ICU), and the total positive rate was exclusively 15.38%. Empirical antibiotic therapy in turn can significantly reduce the sensitivity of blood cultures drawn shortly after treatment initiation (6), which causes diagnosis to become more difficult. The physician tends to use antibiotics indiscriminately in most of conditions in a preventive way to avoid the death of septic shock patients (7). Other meaningful test results, such as procalcitonin and C-reactive protein, are biomarkers widely used for diagnosis of sepsis and septic shock (8), as they sensitively reflect the inflammatory condition in vivo; they are, however, susceptible to other factors (9).
Alterations in gene expression have specific diagnostic value as a subjective host response to pathogens. An important direction for future research is to screen specific genes with diagnostic value by macroscopically considering gene expression profiles and interaction patterns through bioinformatics. Nevertheless, previous bioinformatics studies have focused on common differentially expressed genes (DEGs) in apparently similar diseases to investigate potential common regulatory pathways. In the clinic, severity, mortality and primary treatment modality and even physiological processes, such as septic shock and nonseptic shock, are usually rather diverse. Thus, unique differential genes for the target disease are usually of high diagnostic value as part of its characterization. The identification of these gene expressions enables early detection of sepsis, offering guidance for clinical diagnosis. Timely interventions and enhanced patient management play a crucial role in improving survival rates.
There are many factors that influence gene expression, including age, sex, disease course, and medical history. In recent decades, bioinformatics results have shown unsatisfactory value for diagnosis because they are not applicable in real medical settings. We propose a method named Condition Control based on Real-life Medical Scenarios (CCRMS), which involves screening genes by limiting the variables that affect gene expression as much as possible, and confirmed its diagnostic value in a real-world medical setting by loosening the restrictions at each level.
In this study, three data sets were selected for gene screening and validation using the CCRMS method. The first two data sets were from the Gene Expression Omnibus (GEO) database, and the third involved patients who were admitted to the ICU at West China Hospital of Sichuan University from 2020 to 2021.
MATERIALS AND METHODS Data selection using CCRMSWe divided factors that may affect gene expression into four aspects: medical history, disease course, treatment modality, and control group (Table 1). The first scenario controlled for all four variables, with each patient experiencing postoperative shock, classified as septic or nonseptic shock according to blood culture results. Samples were collected within 24 h of diagnosis and matched to healthy volunteers based on age. This scenario limited the variables as much as possible for the screening of characteristic genes associated with septic shock. Then, the restrictions at each level were released in the latter scenarios to validate the diagnostic value. The second scenario controlled for medical history, disease course, and some characteristics of the control group, with patients empirically diagnosed with septic shock in the emergency department. Samples were collected at the time of admission, and no age-matched healthy volunteers were included.
TABLE 1 - Data selection using CCRMS Scenario 1 Scenario 2 Scenario 3 Medical histories Patients after surgery Various Various Disease course Shock process Various Various Treatment Resuscitation Resuscitation or minor treatment Various Control Age-matched healthy volunteers No age-matched healthy volunteers No age-matched healthy volunteers and common infection patients Application Variables control, unique gene extraction Validation Validation,The third scenario was liberalized to control for all respects and was representative of the real medical setting. Information from patients with different medical histories and disease courses who underwent complex medical procedures, including records from different hospitals, were sent to the ICU because of worsened or new infections that have led or may likely have led to sepsis. All samples were collected after sepsis diagnosis according sepsis 3.0. In addition to no age-matched healthy volunteers, concurrently hospitalized patients with common infections were used as a control group. Total RNA was extracted from blood samples for whole-genome sequencing and no participation in any medical treatment. Aggregately, 26 septic shock patients, 25 sepsis patients, 24 healthy volunteers, and 29 common infection patients were included in the scenario 3.
Eventually, three data sets were selected: the first two data sets were from the GEO database; the third data set comprised patients who were admitted to the ICU at West China Hospital of Sichuan University from 2020 to 2021.
Identification of unique DEGsIn accordance with the first scenario, a gene expression data set (GSE131761) was downloaded from the GEO database, aggregately including 33 nonseptic shock patients, 81 septic shock patients after surgery, and 15 healthy volunteers matched by age. The original expression matrix was processed by R software (version 4.2.2, Vienna, Austria), and DEGs were screened out by the Limma package with adjusted P value <0.05 and |Log fold-change| > 1.5 as thresholds separately in the septic shock group and nonseptic shock group compared with the control group. The respective DEGs were used to obtain unique DEGs for the septic shock group using a Venn diagram.
Protein-protein interaction network constructionA protein-protein interaction (PPI) network of unique DEGs was constructed using the Search Tool for the Retrieval of Interacting Genes. The high confidence (0.700) of the minimum required interaction score was chosen as the cutoff point. Subsequently, Cytoscape software (version 3.9.1, National Institute of General Medical Sciences (NIGMS), Bethesda, US) was used to rebuild and visualize molecular interaction networks. After removing noninteracting genes, the remaining genes were sorted according to the betweenness value using the cytoNCA plugin.
WGCNA network construction and identification of hub genesWeight correlation network analysis (WGCNA) is a systems biology method used for performing various aspects of weighted correlation network analysis to find and summarize clusters of highly correlating genes and for relating modules to one another and to external sample traits. Via scale independence and mean connectivity, a suitable soft threshold was selected for network topology analysis. Then, adjacencies were converted into a topological overlap matrix (TOM) to cluster genes and analyze the correlation of clinical information. Gene modules with high correlation were selected and intersected with the PPI network to screen hub genes; changes were plotted with a volcano map via the ggscatter package of R software.
Cibersort analysis and gene enrichment analysisThe proportion of immune cells in the septic shock group was analyzed using the Cibersort package (Stanford University, Palo Alto, the US), and the correlation between hub genes and immune cells was calculated with the corrplot package (Massachusetts Institute of Technology, Cambridge, US). Based on the Gene Ontology (GO) database, initial and final hub genes were analyzed for gene enrichment in terms of biological process (BP), cellular component (CC), and molecular function (MF); properties of gene expression were classified using the ClusterProfiler software package (Southern Medical University, Guangzhou, China).
Receiver operating characteristic curve validation using CCRMSA gene expression data set (GSE95233) was downloaded in accordance with the second scenario from the GEO database, including 51 septic shock patients and 22 non–age-matched healthy volunteers. Samples were obtained from septic shock patients twice, at admission and a second time at D2 or D3. Hub gene expression at admission was extracted for receiver operating characteristic (ROC) testing to validate each gene diagnosis.
Random forest model using CCRMSIn accordance with the third scenario, hub gene expression profiles of patients admitted to the ICU at West China Hospital of Sichuan University from 2020 to 2021 were retrieved, consisting of 27 septic shock patients, 24 sepsis patients, 30 concurrently hospitalized patients with common infection, and 24 non–age-matched healthy volunteers. They were divided into two groups, one included patients with sepsis, patients with common infection, and healthy volunteers, and the other included patients with septic shock, patients with general infection, and healthy individuals, as labeled by disease status, to develop the random forest model separately. We set 500 random forest trees and divided the data into training (70%) and test (30%) data sets to evaluate the performance of the model for assessing three diseases simultaneously. Separate ROC tests were performed for genes with high importance to validate their value using online mapping tools.
Correlation analysis of hub genes with apoptosis-related genes and checkpointsBax, BID, BAK1, BAD, BCL2L11, BCL2L1, BCL2, Bcl-xL, BCL2L2, MCL1, CASP1, CASP3, CASP4, CASP9, MYC, TP53, FAS, FASLG, CASP3, and EBNA1BP2 were selected as apoptosis-related genes. PDCD1, CTLA4, VSIR, HAVCR2, LAG3, TIGIT, SIRPA, BTLA, SIGLEC7, LILRB1, LILRB2, LILRB3, and LILRB4 were selected as checkpoints. We calculated the correlation by Spearman correlation of the hub genes in the third scenario with them separately and visualized them with online tools.
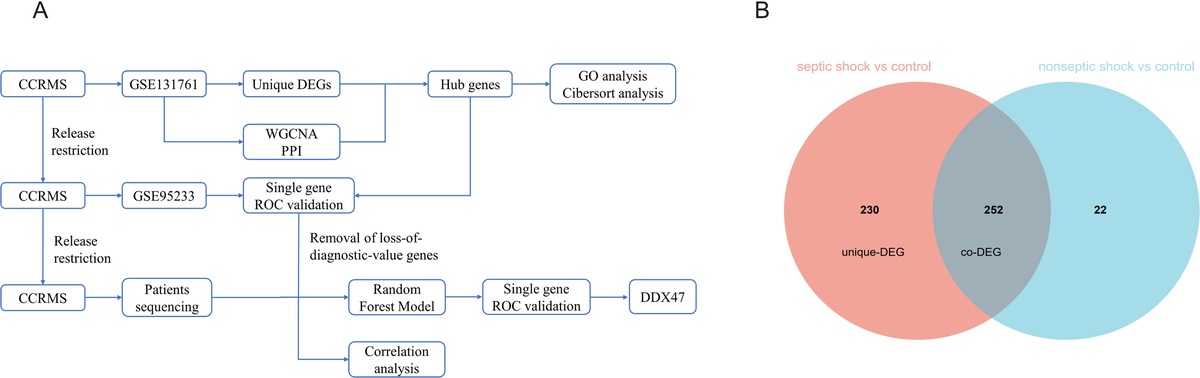
RESULTS Identification of unique DEGs and PPI network constructionGene expression differences between the two shock groups and healthy volunteers were calculated. Compared with healthy volunteers, 482 DEGs were found in the septic shock group, 274 DEGs were found in the nonseptic shock group, and 252 coexpressed DEGs and 230 unique DEGs were found in the septic shock group (Fig. 1). The two shock groups had similar gene expression patterns, but there was more disorder in the septic shock group, suggesting that pathological changes may occur via different signaling pathways. Of these unique DEGs, 129 were revised downward, and 101 were revised upward. Using the online tool STRING for PPI network construction, after removing the noninteracting genes, a total of 71 genes entered the reconstruction. According to the betweenness value of the cytoNCA plugin, the genes were sorted to visualize the gene interaction network (Fig. 2).
 Fig. 1:
 A, Flowchart of the study. B, Differential analysis of sepsis was performed separately in the septic shock group and nonseptic shock group compared with the control group. Venn figure for screening unique DEG. DEG, differentially expressed gene.
 Fig. 2:
 A, PPI network. The 71 DEGs in PPI network constructed by the STRING database and sorted according to the BC value. B, Volcano graph of the control group and septic shock group in differential analysis. The blue dots represent low expression, whereas the red dots represent high expression. Hub genes were separately labeled. BC value, betweenness value; DEG, differentially expressed gene; PPI, protein-protein interaction.
WGCNA network construction and identification of hub genesGene expression in the septic shock group and control group was extracted from raw data. Two abnormal samples were deleted to ensure reliable results using hierarchical clustering graphs. Finally, a total of 21,753 gene expression values of 94 observations and corresponding clinical information, including gender and diagnosis, were used to construct a weighted correlation network. Through scale independence and mean connectivity, we chose 4 as the suitable soft threshold and 100 as the minimal module size to analyze the correlation between gene cluster and clinical information using the 1-TOM matrix. The results showed that the four gene modules, turquoise (−0.9), blue (−0.71), cyan (0.62), and midnightblue (0.59), had a high correlation with the diagnostic results (Fig. 3). Gene screening was performed with a threshold of 0.8 for module membership and 0.8 for gene significance in the negatively related gene modules and 0.8 for module membership and 0.6 for gene significance in the positively related gene module as the initial hub genes (Fig. 3). By intersecting with PPI network genes, NCL, CD40LG, KAT2A, RPL23A, GATA3, ITK, DDX47, PRPF19, MAP2K6, and LDHA were selected as hub genes, eight of which were revised downward and two revised upward (Fig. 2).
 Fig. 3:
 Construction and module analysis of WGCNA. A, Clustering dendrogram of genes with different similarities based on topological overlap and the assigned module color. B, Network topology analysis under various soft-threshold powers. Left: The x axis represents the soft-threshold power. The y axis represents the fit index of the scale-free topology model. Right: The x axis represents the soft-threshold power. The y axis reflects the average connectivity (degree). C, Module-trait association. Each row corresponds to a module, and each column corresponds to a feature. Each cell contains the corresponding correlation and P value. This table is color coded according to the relevance of the color legend. D, The relevance of members in the turquoise, blue, cyan, and midnightblue module and septic shock. WGCNA, weighted gene co-expression network analysis.
Gene enrichment analysisWe further performed enrichment analyses for both the initial hub genes in WGCNA and final hub genes to explore underlying biological roles. Multiple GO-BP terms of initial hub genes were associated with alpha-beta T-cell activation and differentiation, T-cell differentiation, leukocyte cell-cell adhesion, mononuclear cell differentiation, and CD4-positive alpha-beta T-cell activation. GO-CC terms were mainly enriched in specific granules, tertiary granules, secretory granule lumens, and cytoplasmic vesicle lumens. The aforementioned above results confirm activation of innate immunity and adaptive immunity in the septic shock group. Conversely, gene enrichment of the final hub gene was quite different, mostly related to gene expression and cell cycle, except for enrichment in monocyte differentiation. Essential roles in GO-MF were DNA-binding transcription factor and protein serine/threonine kinase activator activity (Fig. 4).
 Fig. 4:
 A, GO functional enrichment analysis for initial hub genes. B, GO functional enrichment analysis for hub genes. C, Barplot shows the proportion of 19 types of immune cells in septic shock samples. The column of the figure is listed as a sample. D, The correlation of 19 kinds of infiltrated immune cells. Blue means negative correlation, and red means positive correlation. Each cell contains the corresponding correlation. GO, Gene Ontology.
Cibersort analysisThe Cibersort results showed that the proportion of immune cells in septic shock patients was significantly different from that in healthy volunteers: the content of CD8+ T cells was markedly decreased, whereas monocytes were increased. Further analysis of the correlation between hub genes and immune cells showed that all hub genes correlated strongly with CD8+ T cells, gamma delta T cells, and plasma cells; eight correlated positively and two negatively (Fig. 4).
ROC curve validation using CCRMSThe other gene expression data set (GSE95233) was examined in accordance with the second scenario. Hub gene expression of septic shock patients at admission and healthy volunteers was extracted to validate the diagnostic value for liberalizing the restriction control for medical history and disease course. ROC curve analysis indicated that all hub genes had high diagnostic value, with nine of them having area under the curve (AUC) values greater than 0.9 (Fig. 5).
 Fig. 5:
 A, ROC curve analysis of hub gene expression in second scenario to distinguish the healthy volunteers and septic shock group. B, ROC curve analysis of hub gene expression in the third scenario to distinguish healthy volunteers and septic shock group or common infection and septic shock group. C, ROC curve analysis of hub gene expression in the third scenario to distinguish healthy volunteers and sepsis group or common infection and sepsis group. D, Variable importance of 10 hub genes in RandomForest Analysis, D1 in the sepsis model, D2 in the septic shock model.
Random forest model using CCRMSBased on disease status, all patients in data set 3 were divided into two groups: one containing patients with sepsis or common infection and healthy volunteers and another containing patients with septic shock or common infection and healthy volunteers. A random forest model was built with all 10 hub genes for diagnosis, and classification model performance was evaluated using area under the ROC curve, accuracy, sensitivity, and specificity, among others. For the random forest model in septic shock, the multiclass AUC was 0.9477, and accuracy was 0.8261 (0.6122–0.9505). Notably, its specificity was high for diagnosing both common infections and septic shock, which also meets the demands of clinical work (Table 2). To our surprise, the diagnostic value of the random forest model in sepsis was not inferior, with a multiclass AUC of 0.96, accuracy of 0.8182 (0.5972–0.9481), and specificity of 1.0000 in sepsis diagnosis (Table 3). The respective gene importance rankings of the two models are shown in Figure 5. Although the performance of the two models was similar, the importance weights of each gene were slightly different.
TABLE 2 - Classification performance of random forest model in a group containing patients with septic shock, patients with common infection, and healthy volunteers Healthy volunteers Common infection Septic shock Sensitivity 0.8571 0.8750 0.7500 Specificity 0.8125 0.9333 1.0000 Pos pred value 0.6667 0.8750 1.0000 Neg pred value 0.9286 0.9333 0.8824 Prevalence 0.3043 0.3478 0.3478 Detection rate 0.2609 0.3043 0.2609 Detection prevalence 0.3913 0.3478 0.2609 Balanced accuracy 0.8348 0.9042 0.8750 Accuracy 0.8261 95% CI 0.6122–0.9505 No information rate 0.3478 P value (ACC > NIR) 3.45e − 6 κ 0.7401 Multiclass area under the curve 0.9477ACC, Accuracy; CI, confidence interval; Neg pred, negative predictive; NIR, No Information Rate; Pos pred, positive predictive.
ACC, Accuracy; CI, confidence interval; Neg pred, negative predictive; NIR, No Information Rate; Pos pred, positive predictive.
Next, the diagnostic value of each gene was determined using ROC curve analysis. We found that most genes had the ability to diagnose separately, but their diagnostic value changed within the context of different disease groups. It is worth noting that DEAD-box helicases 47 (DDX47) showed a high diagnostic value in all situations.
Correlation analysis of hub genes with apoptosis-related genes and checkpointsConsidering that genes with diagnostic value usually represent the characteristic changes of a disease and that patients with septic shock often have immunosuppression, we further analyzed the correlation between hub genes and apoptosis-related genes and immune checkpoints. Interestingly, almost all hub genes showed a high correlation with different apoptosis-related genes and immune checkpoints, despite the complexity of their expression, and no diagnostic results could be derived from their expression alone. We speculate that each gene collectively regulates immune cell function, number, and differentiation through interaction of different apoptosis genes and immune checkpoints. DDX47, as the most diagnostic gene, also had a significant negative correlation with CASP9 (−0.75), SIRPA (−0.8), and VISR (−0.74) (Fig. 6).
 Fig. 6:
 Correlation analysis. Blue means negative correlation, and red means positive correlation. A, Seventeen common apoptosis-related genes with hub genes. B, Nine common checkpoints with hub genes.
DISCUSSIONThe diagnosis of sepsis involves the identification of a dysregulated systemic inflammatory host response to infection in the presence of organ dysfunction and high risk of mortality (10). With the gradual standardization of management of septicemia patients, outcomes have improved, but because no specific antisepsis treatments exist, early recognition allowing for correct therapeutic measures to be started rapidly becomes the most effective way to improve prognosis (11). Substantial individual and pathogen variation in response to infection is a major contributing factor in the diagnosis dilemma (12). Many studies have been conducted to screen for effective biomarkers to facilitate targeted diagnosis by bioinformatics, but the results have been less satisfactory when applied to real medical settings. This is partly because genes that do have diagnostic value in a specific setting tend to have reduced value when taken out of their specific context. Hence, the pursuit of genes exhibiting steadfast expression and diagnostic significance across diverse clinical scenarios, varying therapeutic modalities, and heterogeneous levels of medical care assumes paramount importance.
We propose a method named CCRMS. In this study, factors affecting gene expression were categorized into four clusters: medical history, disease course, control group, treatment modality, and analysis in suitable medical scenarios. Through stringent restrictions on four aspects that influence gene expression, unique genes are selected. Then, these restrictions are gradually loosened to simulate a more realistic medical diagnosis and treatment environment to ascertain the continued diagnostic value of these genes.
Uniquely expressed genes often represent a specific disease process. Consistent with our knowledge of septic shock, most of these genes are involved in various immunological processes, including immunocyte differentiation, positive regulation of IL-4, and cytokine production. An adequate balance between Th1, Th17, and T regulatory cells is critical for generating protective immune responses while minimizing autoimmunity inflammation-caused tissue damage (13). CD40–CD40L is required for induction of Th1 and Th17 responses and driving release of corresponding inflammatory factors to eliminate pathogens (14). Absence of the CD40–CD40L interaction leads to impairment of CD4+ T-cell priming by dendritic cells, CD4+ T-cell helping of B cells and classic macrophage activation by CD4+ T cells (15,16). ITK (IL2-inducible T-cell kinase), a component of T-cell receptor signaling pathways, also participates in molecular pathway driving T helper cell differentiation and cytokine production (17,18). The absence of ITK leads to T helper cell dysfunction, exacerbation of LPS-induced septic hypothermia, and neutrophil influx (19). As a characteristic transcription factor of Th2 cells (20), GATA3 levels were also decreased, which reflect the suppression of anti-inflammatory processes and consist of the research by Pachot and colleagues (21). All of the aforementioned findings suggest there is an abnormal balance between T helper cells. Macrophages, which polarize into two types of cells, serve as the first line of defense against infection and are an essential component of innate immunity, which is also regulated by T helper cells (22). The Th1 cytokine interferon-γ and LPS can induce M1 macrophages to release inflammatory mediators such as IL-1 to promote the inflammatory response (23). The Th2 cytokine IL-4 is proven to elicit M2 activation as a fundamental mechanism to limit inflammation-caused tissue damage (24,25). The increased number of M2 macrophages shown in the Cibersort results was in accordance with positive regulation of IL-4. In addition to T helper cells, NCL participates in the endocytosis of lactoferrin and interactions with viruses, bacteria, and toxins (26,27). During adaptive immunity, the number of CD8+ T cells, which are the backbone of the inflammatory response, is drastically reduced. All of the aforementioned findings are consistent with findings that both proinflammatory anti-inflammatory responses and immunosuppression occur early and simultaneously during sepsis (28,29). Hub genes are involved in the regulation of the immune system through a variety of aspects. Furthermore, we performed a correlation analysis between hub genes and immune cells, and the results showed that all hub genes correlated strongly with CD8+ T cells, gamma delta T cells, and plasma cells. To some extent, these results indicate a possible synergistic effect of hub genes in regulating immune cell function and number.
More interestingly, most of these genes are associated with gene expression and the cell cycle. NCL inhibits Fas ligand binding and prevents Fas-induced apoptosis (30), and MAP2K6 promotes cellular senescence and apoptosis, which elicit sustained p38α activation to trigger massive autophagosome formation (31). DDX47, a member of the helicase family, plays a pivotal role in various cellular processes such as translation initiation, nuclear and mitochondrial splicing, ribosome, and spliceosome assembly. In addition, it is involved in maintaining the stability of R-loops. Depletion of DDX47 disrupts the normal functioning of RNAPII, leading to the accumulation of unscheduled R-loops and causing transcription-replication conflicts within the cell (32). Of particular interest is the significant diagnostic value of DDX47, as it exhibits close associations with other hub genes. DDX47 and PRPF19 are intertwined in RNA metabolism and shearing processes (33,34). Localized in the nucleolus, DDX47 seems to interact with the NCL protein, and its depletion correlates with a decrease in NCL expression, indicating aberrant nucleolus function (32). Furthermore, as members of the DDX family, intracellular nucleic acid recognition proteins, DDX47 is involved in innate immune responses and regulates interferon production (35). The characteristic transcription factor of Th2 cells, GATA3, reflects the state of Th2 cells within the body. The reduced expression of both DDX47 and GATA3 suggests significant immune suppression in patients with septic shock, consistent with the findings of the study by Li et al. (36). Importantly, DDX47 not only demonstrates the ability to differentiate between healthy individuals and patients with common infections, sepsis, and septic shock in realistic clinical scenarios but also exhibits exceptional diagnostic potential as a single gene marker. Despite the heterogeneity of sepsis based on the site of infection, DDX47 expression remains consistent throughout the progression of sepsis, enabling its clinical utility for the identification of sepsis and septic shock.
Apoptosis and immune checkpoints play a central role in immunosuppression by affecting the immune response at various levels (37). We speculate that the hub genes are involved in the immune process by regulating gene expression, cellular senescence, or apoptosis. Therefore, we performed a correlation analysis of the levels of apoptotic genes and immune checkpoints with hub genes in third scenario. The results showed that the vast majority of genes exhibited a high correlation with apoptosis genes and immune checkpoints. The correlation between PRPF19 and TP53 reached 0.87, which was consistent with a study showing that PRPF19 regulates p53-dependent cellular senescence (38). Both SIRP and VISR are immunosuppressive receptors, and DDX47 may interact with them to participate in immunosuppression in septic shock. Their relevance has not been explored, and we provide new approaches for subsequent studies.
Our study has several limitations. First, as a retrospective study, the results need to be confirmed through prospective clinical trials. Second, because of the progressive nature of sepsis and septic shock, it was challenging to determine the true course of the disease during sample selection. Therefore, obtaining reliable diagnostic results was difficult, as indicated by the ROC curve showing some diagnostic value in both sepsis and septic shock patients. Third, the unavailability of patients' treatment histories and severity of disease in the database introduced the potential for bias as different treatment modalities can have varying effects on gene expression. Fourth, we did not investigate patient prognosis as numerous uncontrollable factors in real-world clinical practice can significantly impact patient outcomes, resulting in substantial data bias and a high degree of data loss. In addition, in this study, we only assessed the correlation between cell apoptosis and immune checkpoint, examining the diagnostic value of hub genes in different scenarios, whereas further exploration is needed to understand their underlying mechanisms and cellular localization change in sepsis (39).
REFERENCES 1. Singer M, Deutschman CS, Seymour CW, et al. The Third International Consensus Definitions for Sepsis and Septic Shock (Sepsis-3). JAMA. 2016;315(8):801–810. 2. Reinhart K, Daniels R, Kissoon N, et al. Recognizing sepsis as a global health priority—a WHO resolution. N Engl J Med. 2017;377(5):414–417. 3. Liu V, Escobar GJ, Greene JD, et al. Hospital deaths in patients with sepsis from 2 independent cohorts. JAMA. 2014;312(1):90. 4. Peltan ID, Mitchell KH, Rudd KE, et al. Physician variation in time to antimicrobial treatment for septic patients presenting to the emergency department. Crit Care Med. 2017;45(6):1011–1018. 5. Wu AP, Liu D, Chen J, et al. Multivariate analysis of blood culture positive rate of ICU patients. Zhonghua Yi Xue Za Zhi. 2016;96(27):2161–2164. 6. Cheng MP, Stenstrom R, Paquette K, et al. Blood culture results before and after antimicrobial administration in patients with severe manifestations of sepsis: a diagnostic study. Ann Intern Med. 2019;171(8):547–554. 7. Martínez-Paz P, Aragón-Camino M, Gómez-Sánchez E, et al. Distinguishing septic shock from non-septic shock in postsurgical patients using gene expression. J Infect. 2021;83(2):147–155. 8. Tsangaris I, Antonakos N, Fantoni M, et al. Biomarkers: can they really guide our daily practice? Shock. 2023;59(3S):16–20. 9. Pierrakos C, Vincent JL. Sepsis biomarkers: a review. Crit Care. 2010;14(1):R15. 10. Vincent JL, Opal SM, Marshall JC, et al. Sepsis definitions: time for change. Lancet. 2013;381(9868):774–775. 11. Cohen J, Vincent JL, Adhikari NKJ, et al. Sepsis: a roadmap for future research. Lancet Infect Dis. 2015;15(5):581–614. 12. Davenport EE, Burnham KL, Radhakrishnan J, et al. Genomic landscape of the individual host response and outcomes in sepsis: a prospective cohort study. Lancet Respir Med. 2016;4(4):259–271. 13. Lohr J, Knoechel B, Caretto D, et al. Balance of Th1 and Th17 effector and peripheral regulatory T cells. Microbes Infect. 2009;11(5):589–593. 14. Perona-Wright G, Jenkins SJ, O'Connor RA, et al. A pivotal role for CD40-mediated IL-6 production by dendritic cells during IL-17 induction in vivo. J Immunol. 2009;182(5):2808–2815. 15. Díaz Á, González-Alayón I, Pérez-Torrado V, et al. CD40–CD154: a perspective from type 2 immunity. Semin Immunol. 2021;53:101528. 16. Elgueta R, Benson MJ, de Vries VC, et al. Molecular mechanism and function of CD40/CD40L engagement in the immune system. Immunol Rev. 2009;229(1):152–172. 17. Gomez-Rodriguez J, Wohlfert EA, Handon R, et al. Itk-mediated integration of T cell receptor and cytokine signaling regulates the balance between Th17 and regulatory T cells. J Exp Med. 2014;211(3):529–543. 18. Kosaka Y, Felices M, Berg LJ. Itk and Th2 responses: action but no reaction. Trends Immunol. 2006;27(10):453–460. 19. Huang W, Morales JL, Gazivoda VP, et al. Nonreceptor tyrosine kinases ITK and BTK negatively regulate mast cell proinflammatory responses to lipopolysaccharide. J Allergy Clin Immunol. 2016;137(4):1197–1205. 20. Nakayama T, Hirahara K, Onodera A, et al. Th2 cells in health and disease. Annu Rev Immunol. 2017;35(1):53–84. 21. Pachot A, Monneret G, Voirin N, et al. Longitudinal study of cytokine and immune transcription factor mRNA expression in septic shock. Clin Immunol. 2005;114(1):61–69. 22. Locati M, Curtale G, Mantovani A. Diversity, mechanisms, and significance of macrophage plasticity. Annu Rev Pathol. 2020;15(1):123–147. 23. Orecchioni M, Ghosheh Y, Pramod AB, et al. Macrophage polarization: different gene signatures in M1(LPS+) vs. classically and M2(LPS–) vs. alternatively activated macrophages. Front Immunol. 2019;10:1084. 24. Biswas SK, Mantovani A. Macrophage plasticity and interaction with lymphocyte subsets: cancer as a paradigm. Nat Immunol. 2010;11(10):889–896. 25. Medzhitov R, Schneider DS, Soares MP. Disease tolerance as a defense strategy. Science. 2012;335(6071):936–941. 26. Legrand D, Vigie K, Said EA, et al. Surface nucleolin participates in both the binding and endocytosis of lactoferrin in target cells. Eur J Biochem. 2004;271(2):303–317. 27. Jia W, Yao Z, Zhao J, et al. New perspectives of physiological and pathological functions of nucleolin (NCL). Life Sci. 2017;186:1–
留言 (0)