
記住我


Following the further purification of Series C from the acetone crude extract of M. griffoniana, using Sephadex LH-20, as well as the flash chromatography of the chloroform extract, yielded 7 compounds. The isolated compounds were labelled as numbers 1–7 as indicated in Table 1 below:
Table 1 The pure compounds isolated from M. griffonianaThe durmillone, odorantine and MTF 51 are compounds which had already undergone 2D NMR and structural elucidation for other studies (conducted by Jordan Tonga Lembe, University of Johannesburg Department of Chemistry, and Tagatsing Fotsing Maurice and Yankep Emmanuel, University of Yaoundé) and the compounds identified with the name griffoniana have not and hence been given a number to indicate which fraction they were found in the elution series. The purity of the compounds was checked using proton NMR. Structural elucidation using 2D NMR was only done for the compounds chosen for further studies.
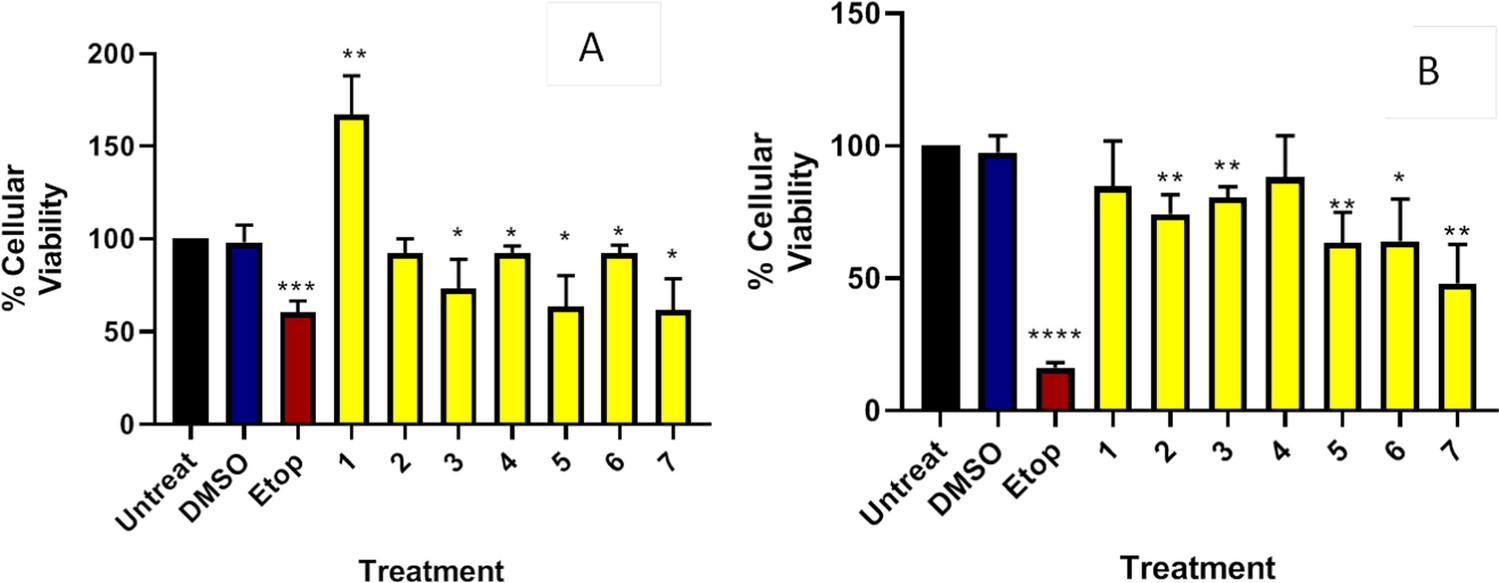
Compounds 1–7 were tested against each other at a constant concentration of 100 µg/ml for two different treatment times on the MIA PaCa 2 cell line with a positive control set as 100 µM etoposide and a negative control set as 0.1% DMSO. Based on the resulting % viabilities and the calculated % cytotoxicities from Fig. 1A and B, compounds 5 (durmillone) and 7(griffoniana 55) were picked for further studies.
Fig. 1
The average percentage cellular viability readings for the 24 h (A) and 48 h (B) treatment of MIA PaCa 2 showing the untreated cells, the cells treated by 0.1% DMSO, 100 µM etoposide, and the compounds extracted from M. griffoniana (100 µg/ml). The asterisk (*) represents (*P < 0.05, **P < 0.01 ***P < 0.001, ****P < 0.0001) as calculated by a T-test between untreated and treated samples
NMR and structural elucidation of compounds chosen for further studiesNMR was used to obtain the structure and identity of griffoniana 55 (as durmillone had been identified previously and a structure was obtained). Griffoniana 55 was identified as Isojamaicin (3ʹ-Methoxy-4ʹ, 5ʹ-methylenedioxy-6ʺ, 6ʺdimethylpyrano [2ʺ,3ʺ:7,8] isoflavone) a white amorphous powder that was soluble in chloroform. Its molecular formula was established to be C22H18O6 from HREIMS, displaying a molecular ion at m/z = 378.1204 which was done in a study conducted by Ngamga et al. ( (Ngamga et al. 2005)). Durmillone and isojamaicin share the same molecular formulae and the same structure (Fig. 2A and B). Tables 1 and 2 show a comparison between the positions of peaks in the 1H and 13C spectra for durmillone and isojamaicin. The only difference between durmillone and isojamaicin is the presence of the methoxy group in isojamaicin present on C3̍ and 4̍ of ring B (as shown in Fig. 2A) (Table 3).
Fig. 2
Structures of Isojamaicin (A) and durmillone (B)
Table 2 13C NMR of Isojamaicin and Durmillone (126 MHz, CDCl3)Table 3 1H NMR of Isojamaicin and Durmillone (500 MHz, CDCl3)Cytotoxicity test on chosen compounds of interest isolated from M. griffoniana using AlamarBlue cellular viability assayFollowing the identification of durmillone and isojamaicin, both compounds were subject to a concentration-series-based AlamarBlue assay on MIA PaCa 2, HT 29 and HEK 293, to examine the potency of their activity and generate an IC50 for further studies. For the MIA PaCa 2 cell line (Fig. 3A) durmillone was observed to show a concentration-dependent effect with an IC50 of 104.69 µg/ml. For the MIA PaCa 2 cells treated with isojamaicin (Fig. 3B), isojamaicin is shown to display a concentration dependant form of cytotoxic activity, with an IC50 of 26.45 µg/ml.
Fig. 3
The average percentage cellular viability readings for the 24 h treatment with the compounds of interest (treated at 100, 50, 25, 12.5, 6.25 and 3.125 µg/ml). The MIA PaCa 2 cell line is shown as A (durmillone treated) and B (isojamaicin treated), the HT 29 cell line is shown as C (durmillone treated) and D (isojamaicin treated) and the HEK 293 cell line is shown as E (durmillone treated) and F (isojamaicin treated). The asterisk (*) represents (*P < 0.05, **P < 0.01 ***P < 0.001, ****P < 0.0001) as calculated by a T-test between untreated and treated samples
When tested on the HT 29 cell line (Fig. 3C), durmillone, once, again, showed a concentration-based pattern of cytotoxic activity. The IC50 of 79.22 µg/ml for the HT 29 cells line is significantly lower than the IC50 on the MIA PaCa 2 cell line suggesting that the cytotoxic effects of durmillone are potentially influenced by the cell line it is used on. the cytotoxic effects of the HT 29 cell line seem to be less prominent than the effect seen of the MIA PaCa 2 cell line when treated with isojamaicin (Fig. 3D). This can also be seen by the difference in IC50 values which was calculated as 372.6 µg/ml for the HT 29 cell line.
For the durmillone treated HEK 293 cells, (Fig. 3E), mild cytotoxicity is found at 100, 50 and 6.25 µg/ml and the IC50 for durmillone was calculated as 1065.4 µg/ml, which is significantly greater than the tested concentrations. For isojamaicin, (Fig. 3F), mild levels of cytotoxicity are seen in the 100, 50 12.5 and 6.25 µg/ml treatments and the IC50 was calculated as 2521.8 µg/ml, of which, much like the durmillone, is significantly greater than the tested concentrations.
xCELLigence real-time cellular viability analysisFollowing the 24 h cell proliferation time period, the cells were treated with the same controls and concentrations of durmillone and isojamaicin (in a serially diluted concentration series from 100 to 12.5 µg/ml based on how many wells were available). Figure 4A shows the durmillone treated MIA PaCa 2 cells. A lowering of the cell index readings indicated cell death. The highest cell index reading is shown for the untreated, DMSO treated and 12.5–25 µg/ml durmillone treated cells and the 50–100 µg/ml durmillone treatments showed lower cell index readings compared to the 12.5–25 µg/ml. Figure 4B depicts the isojamaicin treated MIA PaCa 2 cells The lowest cell index readings can be seen in the etoposide and 100 µg/ml isojamaicin treated cells. The pattern of cytotoxic activity shows signs of concentration dependence where the cell index increased slightly as the concentration of isojamaicin decreased, however, a comparison is not as distinct as the durmillone treatments.
Fig. 4
xCELLigence real-time cellular viability analysis of durmillone and isojamaicin treated cells showing the cell index given every 15 min for a time period of 72 h (24 h cell proliferation and 48 h treatment monitoring) the graph depicts the media (red), the untreated cells (light green), 0.1% DMSO (dark blue) and 100 µM Etoposide (pink) and the durmillone or isojamaicin treatment as 100 µg/ml (light blue), 50 µg/ml (purple), 25 µg/ml (brown) and 12.5 µg/ml (dark green). The MIA PaCa 2 cell line is shown as A (durmillone treated) and B (isojamaicin treated), the HT 29 cell line is shown as C (durmillone treated) and D (isojamaicin treated) and the HEK 293 cell line is shown as E (durmillone treated) and F (isojamaicin treated)
With regards to the HT 29 cell line, Fig. 4C shows the durmillone treated HT 29 cells with the lowest cell index readings were shown by the etoposide and 100 µg/ml durmillone treated cells, indicating a higher level of cell death (which much like what was seen in the MIA PaCa 2 cell line in Fig. 4A and D depicts the isojamaicin treatment on the HT 29 cell line. The lowest cell index readings were shown by the isojamaicin treated cells, indicating a higher level of cell death and the lowest cell index readings were shown by the untreated and DMSO treated cells, indicating lower levels of cell death.
In the same manner and conditions as the AlamarBlue assay, durmillone and isojamaicin were tested on HEK 293 to determine their relative cytotoxic activity on non-cancerous human cell lines. Figure 4E depicts the HEK 293 cell line, following the treatment with durmillone, which was shown to have low and insignificant levels of cytotoxicity in a relatively concentration-dependent manner. Mild levels of cytotoxic activity are seen in Fig. 4E as indicated by lower cell index readings (when compared to the untreated cells), however, the decrease in cell index readings was little and the readings eventually began to increase and cluster with the readings for the DMSO treated and the untreated cells. A sign of concentration-based cytotoxicity is evident as the 100 and 50 µg/ml durmillone treatments generally had lower cell index readings compared to the 25 and 12.5 µg/ml treatments. Figure 4F shows the isojamaicin treated HEK 293 cells of which a higher level of cytotoxic activity brought about by isojamaicin is seen by the lower recorded cell index readings given by the isojamaicin treated cells, however, there are indications of the extent of the cytotoxic activity not being as prominent, meaning the compound is not significantly toxic on HEK 293. When compared to etoposide, etoposide is the only treatment that showed a significant decrease in cell index readings. The isojamaicin treated cells also showed the same pattern of changes in cell index readings as the untreated cells. The cell index readings for the isojamaicin treated cells are also fairly similar to that of the DMSO treated cells (where minimal or no cytotoxic activity is expected), indicating lower levels of cytotoxic activity brought about by the isojamaicin treatment.
The IC50s generated by the xCELLigence RTCA programme were 32.9 µg/ml durmillone and 55.46 µg/ml isojamaicin for the PACA 2 cell line and 25.33 µg/ml durmillone and 39.53 µg/ml isojamaicin for the HT 29 cell line respectively. This differs in comparison to the IC50s generated from the AlamarBlue assays. the IC50s generated by the xCELLigence programme differed at each time point and an appropriate calculated IC50 was chosen based on, firstly, which periods of time showed optimum activity (which was not necessarily 24 h after treatment like what was done for AlamarBlue) and secondly, where the regression squared value was the highest (closest to 1).
Durmillone displayed low levels of cytotoxic activity on HEK 293 and thus presented an IC50 of 2710 µg/ml which is significantly higher than the tested concentration range. An IC50 of 85.08 µg/ml was calculated using the RTCA programme for isojamaicin on the HEK 293 cells. These IC50s are significantly higher than the IC50s calculated for the MIA PaCa 2 and HT 29 cells, showing less cytotoxic activity on the HEK 293 cell line.
Caspase 3 and 7 activity detectionThe caspase assay on the MIA PaCa 2 cell line shows evident increase in caspase activity following their treatment with the IC50s of durmillone and isojamaicin (Fig. 5A). The durmillone treated cells showed a 185.37% increase in caspase activity, from 790.3RLU for the untreated cells to 1465RLU for the durmillone treated cells. The isojamaicin treated cells showed an increase of 137.8% (to 1089.3RLU). The caspase assay on the HT 29 cell line was also shown to display an evident increase in caspase activity following their treatment with the IC50s of durmillone and isojamaicin (Fig. 5B). The durmillone treated cells showed a 336.84% increase in caspase activity, from 1647.3RLU for the untreated cells to 5548.7RLU for the durmillone treated cells. The isojamaicin treated cells showed an increase of 263.60% (to 4342.3RLU).
Fig. 5
The average luminescence readings (in relative light units) for the 24 h treatment of the cancer cell lines with the compounds of interest and showing the luminescence readings for the untreated cells, the cells treated with 0.1% DMSO, 100 µM etoposide and the IC50s of durmillone (D) and isojamaicin (I) The MIA PaCa 2 cell line is depicted in A with the IC50s for durmillone as 32.9 µg/ml and isojamaicin as 55.46 µg/ml. the HT 29 cell line is depicted in B with the IC50s for durmillone as 25.33 µg/ml and isojamaicin as 39.53 µg/ml. The asterisk (*) represents (*P < 0.05, **P < 0.01 ***P < 0.001, ****P < 0.0001) as calculated by a T-test between untreated and treated samples
Real-time PCRThe down-regulation of the anti-apoptotic gene BCL-2 and the up- regulation of the pro-apoptotic gene, BAX were depicted in Fig. 6. This is seen in both cell lines, for both durmillone and isojamaicin treatments. Durmillone and isojamaicin displayed varying levels of BAX and BCL-2 expression, which ties in with their varying levels of cytotoxic activity depicted in Figs. 3 and 4. Figure 6 depicts the down-regulation of p53 in both the MIA PaCa 2 and HT 29 cell lines after being treated with durmillone and isojamaicin.
Fig. 6
The fold expression 2^-ΔΔCt (A and C) and log2(2^-ΔΔCt) (B and D) of apoptosis genes BAX, BCL-2 and p53 against the GAPDH housekeeping gene on the MIA PaCa 2 (A and B) and HT 29 cell line (C and D) shown for untreated cells and the IC50 treated cells for durmillone and isojamaicin for each respective cell line
留言 (0)