2.1 Model Design
We developed a natural history model to evaluate the potential impact of bulevirtide versus best supportive care (BSC) for adults with chronic HDV infection with compensated liver disease through the stages of disease progression. The model simulates the natural history of chronic HDV infection while evaluating the long-term impact of HDV treatment on disease progression. The model estimates the long-term consequences of managing patients with HDV over a lifetime time horizon (up to 100 years of age). Model inputs and the model structure were reviewed and validated with four international clinical and modeling experts. In line with measurements of the primary endpoint in clinicial trials [18], the model uses a 24-week cycle length with a half-cycle correction.
2.2 Model Structure
The model was developed in Microsoft Excel® (Microsoft Corporation, Redmond, WA, USA) as a decision tree followed by a Markov model, with state transitions and health state definitions stratified by responder status, similar to other viral hepatitis models [19, 20].
In the decision tree portion of the model, patients in the HDV treatment arm are considered to meet responder criteria as defined by the combined response endpoint of achievement of HDV-RNA undetectability/≥2-log10 decline and alanine aminotransferase (ALT) normalization [21], as recommended by the US Food and Drug Administration (FDA) [22] and is in line with guideline recommendations in Europe [23]. Prior work has shown a ≥2-log10 decrease in HDV RNA to be associated with histological (and by extrapolation, clinical benefit [21, 24]), which is considered in the on-treatment combined response endpoint. This is based on the assumption that persistent HDV virus replication drives the necro-inflammatory and fibrosis response, and hence disease progression, and that a ≥2-log10 reduction in HDV RNA and normalization of ALT contribute to slowing disease progression. Reduced disease progression in the model reflects reductions in HDV-related morbidity and mortality, and reduced risk of further disease progression.
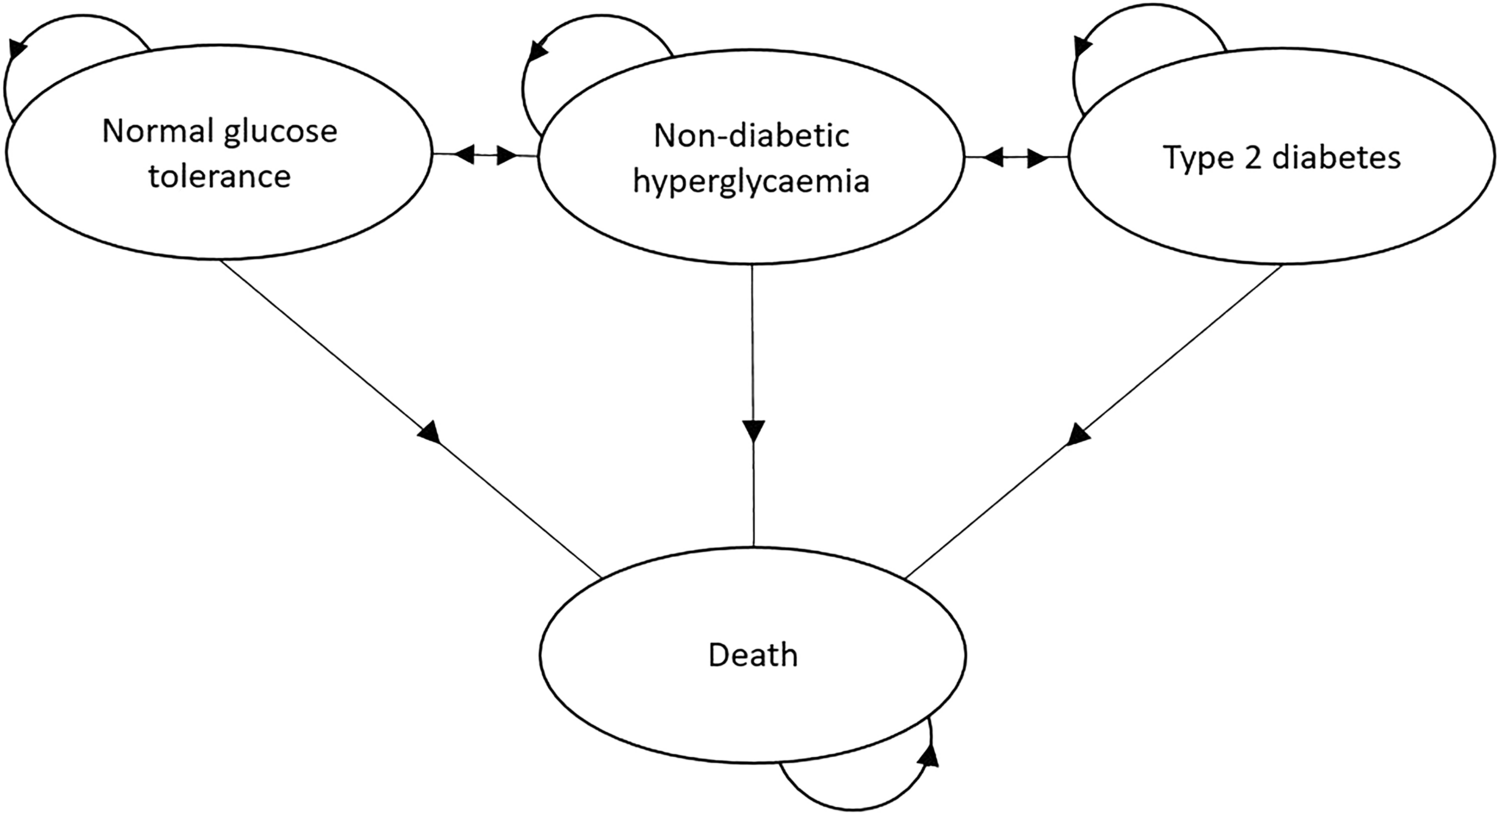
The structure of health states for treatment responders and non-responders for the Markov model is illustrated and described in S2 Appendix in the electronic supplementary material (ESM). Patients progress from F0 (no fibrosis) through F3 (fibrosis stage 3) before developing cirrhosis. Patients with cirrhosis can maintain limited symptoms with compensated cirrhosis (CC, or F4) before developing decompensated cirrhosis (DCC). While HDV can progress to HCC from any stage of disease, progression to more advanced disease states, with increasing fibrosis and advancement to cirrhosis, increases the risk of developing HCC. While both responders and non-responders are able to progress through all fibrosis stages, responders progress at a slower rate than non-responders, and only responders can regress through fibrosis stages (i.e., F4 to F3 and F3 to F2), reflecting clinical improvement. Patients in the DCC or HCC state may undergo liver transplant (LT). Patients with post-LT survival for at least 1 year move to the post-liver transplant (PLT) state.
2.3 Patients
At the time of model entry, all patients are assumed to be HDV-RNA-positive adults with compensated liver disease. As data regarding outcomes among patients with different genotypes associated with HDV remain heterogeneous and need validation, no HBV or HDV genotype subgroup was specified. At baseline, patients are distributed across stages of disease severity, ranging from chronic hepatitis without fibrosis to cirrhosis, and then assigned to HDV treatment or BSC. Over the course of a simulation, patients can achieve spontaneous or treatment-induced virologic responses (e.g., HBsAg loss or seroconversion, or the combined response endpoint of HDV-RNA undetectability/≥2-log10 decline and ALT normalization) or advanced liver disease (e.g., CC, DCC, HCC, or LT). In addition to liver-related excess mortality rates, age-specific background mortality rates were derived from the US Centers for Disease Control and Prevention [25] and applied to the entire population regardless of health state.
For the sake of analyzing potential treatment outcomes for hypothetical novel treamtents for HBV/HDV infection, the mean starting age of all patients was 40.2 years, with 67% male, as observed in the baseline demographics of a recent clinical trial [18]. Distribution across fibrosis stages for F0 (11.62%), F1 (11.62%), F2 (12.45%) and F3 (17.42%) was taken from the literature [26]; distribution for F4 (CC, 46.90%) was taken from the same recent clinical trial patient demographics [18].
2.4 Hepatitis D Virus (HDV) Natural History Progression Rates
Natural history health state transition rates are provided in Table 1. Published data regarding the natural history of HDV are scarce and heterogeneous owing to the relatively rare nature of HDV and geographic variability of HDV prevalence, risk factors, socioeconomics, and health system factors. Thus, to derive values for use in the natural history model, first, transition probabilities representative of natural history for HBV mono-infected patients were sourced from published literature and prior disease models. A literature review was performed to identify studies that presented hazard ratios regarding the relative rate of progression to advanced liver disease events in HBV/HDV-infected versus HBV mono-infected patients. Studies were selected for use in the model for transition probability adjustment based on the individual transitions examined (i.e., to CC, to DCC, etc.), relative study size, and geographic scope. The faster rate of progression reflective of HBV/HDV infection was derived by applying identified hazard ratios between disease progression in HBV/HDV patients versus the transition probabilities for disease progression for HBV mono-infected patients. The model also considers an annual rate of HBsAg seroclearance for patients off-treatment, as well as for those receiving HDV treatment; both are set to 1.13% in the base case [27].
Table 1 Model inputs and sources2.5 Treatments
Only patients in the F0 through F4 health states are assumed to receive either an HDV treatment or BSC. Treatment stopping rules for patients receiving HDV treatment include no achievement of the combined response outcome by week 48; treatment response with HBsAg seroclearance; or disease progression, regardless of fibrosis stage. Upon progression to DCC, HCC, LT, or PLT, patients are also assumed to discontinue treatment. Patients achieving a treatment response with HDV treatment may continue treatment until HBsAg seroclearance, or discontinue treatment with sustained (6 months) HBsAg seroconversion or loss of virological and biochemical response. The discontinuation rate for HDV treatment of 5.07% was a weighted average from the current ongoing clinical trial, converted to an annual rate [18]. This annual discontinuation rate was assumed to continue for any patients remaining on treatment beyond the first year. All patients who discontinue treatment have subsequent rates of disease progression according to the natural history of HDV.
2.6 Clinical Inputs and Health State Transitions2.6.1 Treatment Efficacy and Safety
The efficacy of HDV treatment was modeled through one of two hypothetical scenarios, where either 50% or 75% of patients receiving HDV treatment were assumed to respond as per the defined criteria. For both scenarios, patients receiving HDV treatment who are non-responders or are not complete responders stop HDV treatment after 48 weeks; responders remain on treatment until treatment discontinuation. Responder rates in each scenario are set to 50% or 75% at both weeks 24 and 48. The efficacy of BSC is set to 0% at 24 weeks and 2% at 48 weeks, based on observations from a recent clinical trial [18].
2.6.2 Disease Progression
The nature of the relationship between the impact of combined virologic and biochemical response as a surrogate outcome on natural history progression in HDV has not been well quantified. In order to determine a quantifiable relationship between treatment response and disease progression for use in the model, a modified Delphi panel approach was used to determine the impact of use of the combined response endpoint (detail in S1 Appendix in the ESM) [28]. The Delphi panel formed of 11 international clinical experts reached a consensus (82%, 9/11) that the combined response endpoint would have an impact on disease progression similar to the effect observed between HDV RNA− and HDV RNA+ patients based on natural history studies. The rationale for this was that achievement of the combined response endpoint via treatment would slow histological and clinical disease progression, even if patients did not achieve RNA undetectability. For the base case, given that patients would ultimately still have HBV/HDV infection, although would have controlled HDV viremia, it was assumed that it was more appropriate to employ hazard ratios representative of reduced rates of disease progression for patients who are still HDV Ab+ but RNA− rather than apply hazard ratios that would be reflective of patients who are HBV mono-infected.
To determine these hazard ratios, a systematic literature review was first undertaken to identify cohort studies that report relationships between HDV RNA− and HDV RNA+ [28]. These data were then synthesized in a meta-analysis, where hazard ratios between HDV RNA− and HDV RNA+ on specific liver disease progression events were determined. The hazard ratios used to calculate disease progression for treatment responders are provided in Table 1. Notably, patients in the identified natural history studies did not necessarily achieve HDV RNA− versus HDV RNA+ via treatment, although some patients in these studies did receive PEG-IFN-α. However, given the limited long-term treatment outcomes with HDV RNA treatments to date, this difference in HDV RNA− versus HDV RNA+ patients was considered a suitable proxy for understanding the reduction in disease progression for those patients who respond to treatment.
Table 1 presents the annual disease progression transition rates for patients achieving the combined response endpoint. In short, the annualized transition probabilities calculated for patients with uncontrolled HDV were first converted to annual rates, which were then scaled by hazard ratios determined from a recent meta-analysis [28] and then reconverted to annual transition probabilities to reflect slowed disease progression in patients responding to treatment. In the absence of data on progression between non-cirrhotic fibrosis stages (F0–F3), the hazard ratio from non-cirrhotic to cirrhotic disease (F3 to F4) was applied to all early fibrosis stage transitional probabilities. Since patients who progress to end-stage liver disease (DCC, HCC, LT or PLT) are assumed to discontinue treatment, no subsequent reduction in disease progression is accounted for in these patients.
2.6.3 Disease Regression
Statistically significant reductions in HDV viral load following treatment response have been shown to be associated with regression of liver fibrosis and cirrhosis in chronic viral hepatitis [24, 29]. Farci et al. reported 8.8% of treatment responders with F4 could transition to F3 (non-cirrhotic disease) [24], while Marcellin et al. reported regression of cirrhosis for HBV mono-infected patients who experienced viral suppression while receiving treatment; 13.3% of responders with F3 were found to have transitioned to F2 [29]. Clinical expert consultations concurred that patients who achieve the combined response endpoint experience an improvement in fibrosis/cirrhosis with subsequent disease regression.
2.7 Model Analyses and Outcomes2.7.1 Base-Case Analysis
Health events associated with advanced liver disease (CC, DCC, HCC, LT, and liver-related deaths) were determined for HDV treatment and BSC as the number of events per 10,000 patients for both the 50% and 75% responder scenarios.
2.7.2 Scenario Analyses
To explore the potential impact of early treatment, multiple scenario analyses were performed, including exploring the impact of earlier treatment initiation by starting all patients at an earlier given fibrosis stage. A second scenario analysis also explored the impact of assuming there would be no regression through fibrosis stages for treatment responders. Furthermore, given the uncertainty of the relationship between the achievement of the combined response endpoint and HDV progression, three additional scenario analyses were explored to test this assumption. The ‘treatment-HBV’ scenario analysis used hazard ratios for the achievement of the combined endpoint from patients with HBV mono-infection and assumed that responders would have equal disease progression to treated HBV mono-infected patients (Table 2). The ‘treatment-ALT’ scenario analysis used hazard ratios based on the relationship of ALT normalization and reduction of liver disease events observed in patients with treated HBV mono-infection (Table 2).
Table 2 Annual disease progression hazard ratios for patients achieving the combined response endpoint in the ‘treatment-HBV’ and ‘treatment-ALT’ scenario analyses 

留言 (0)