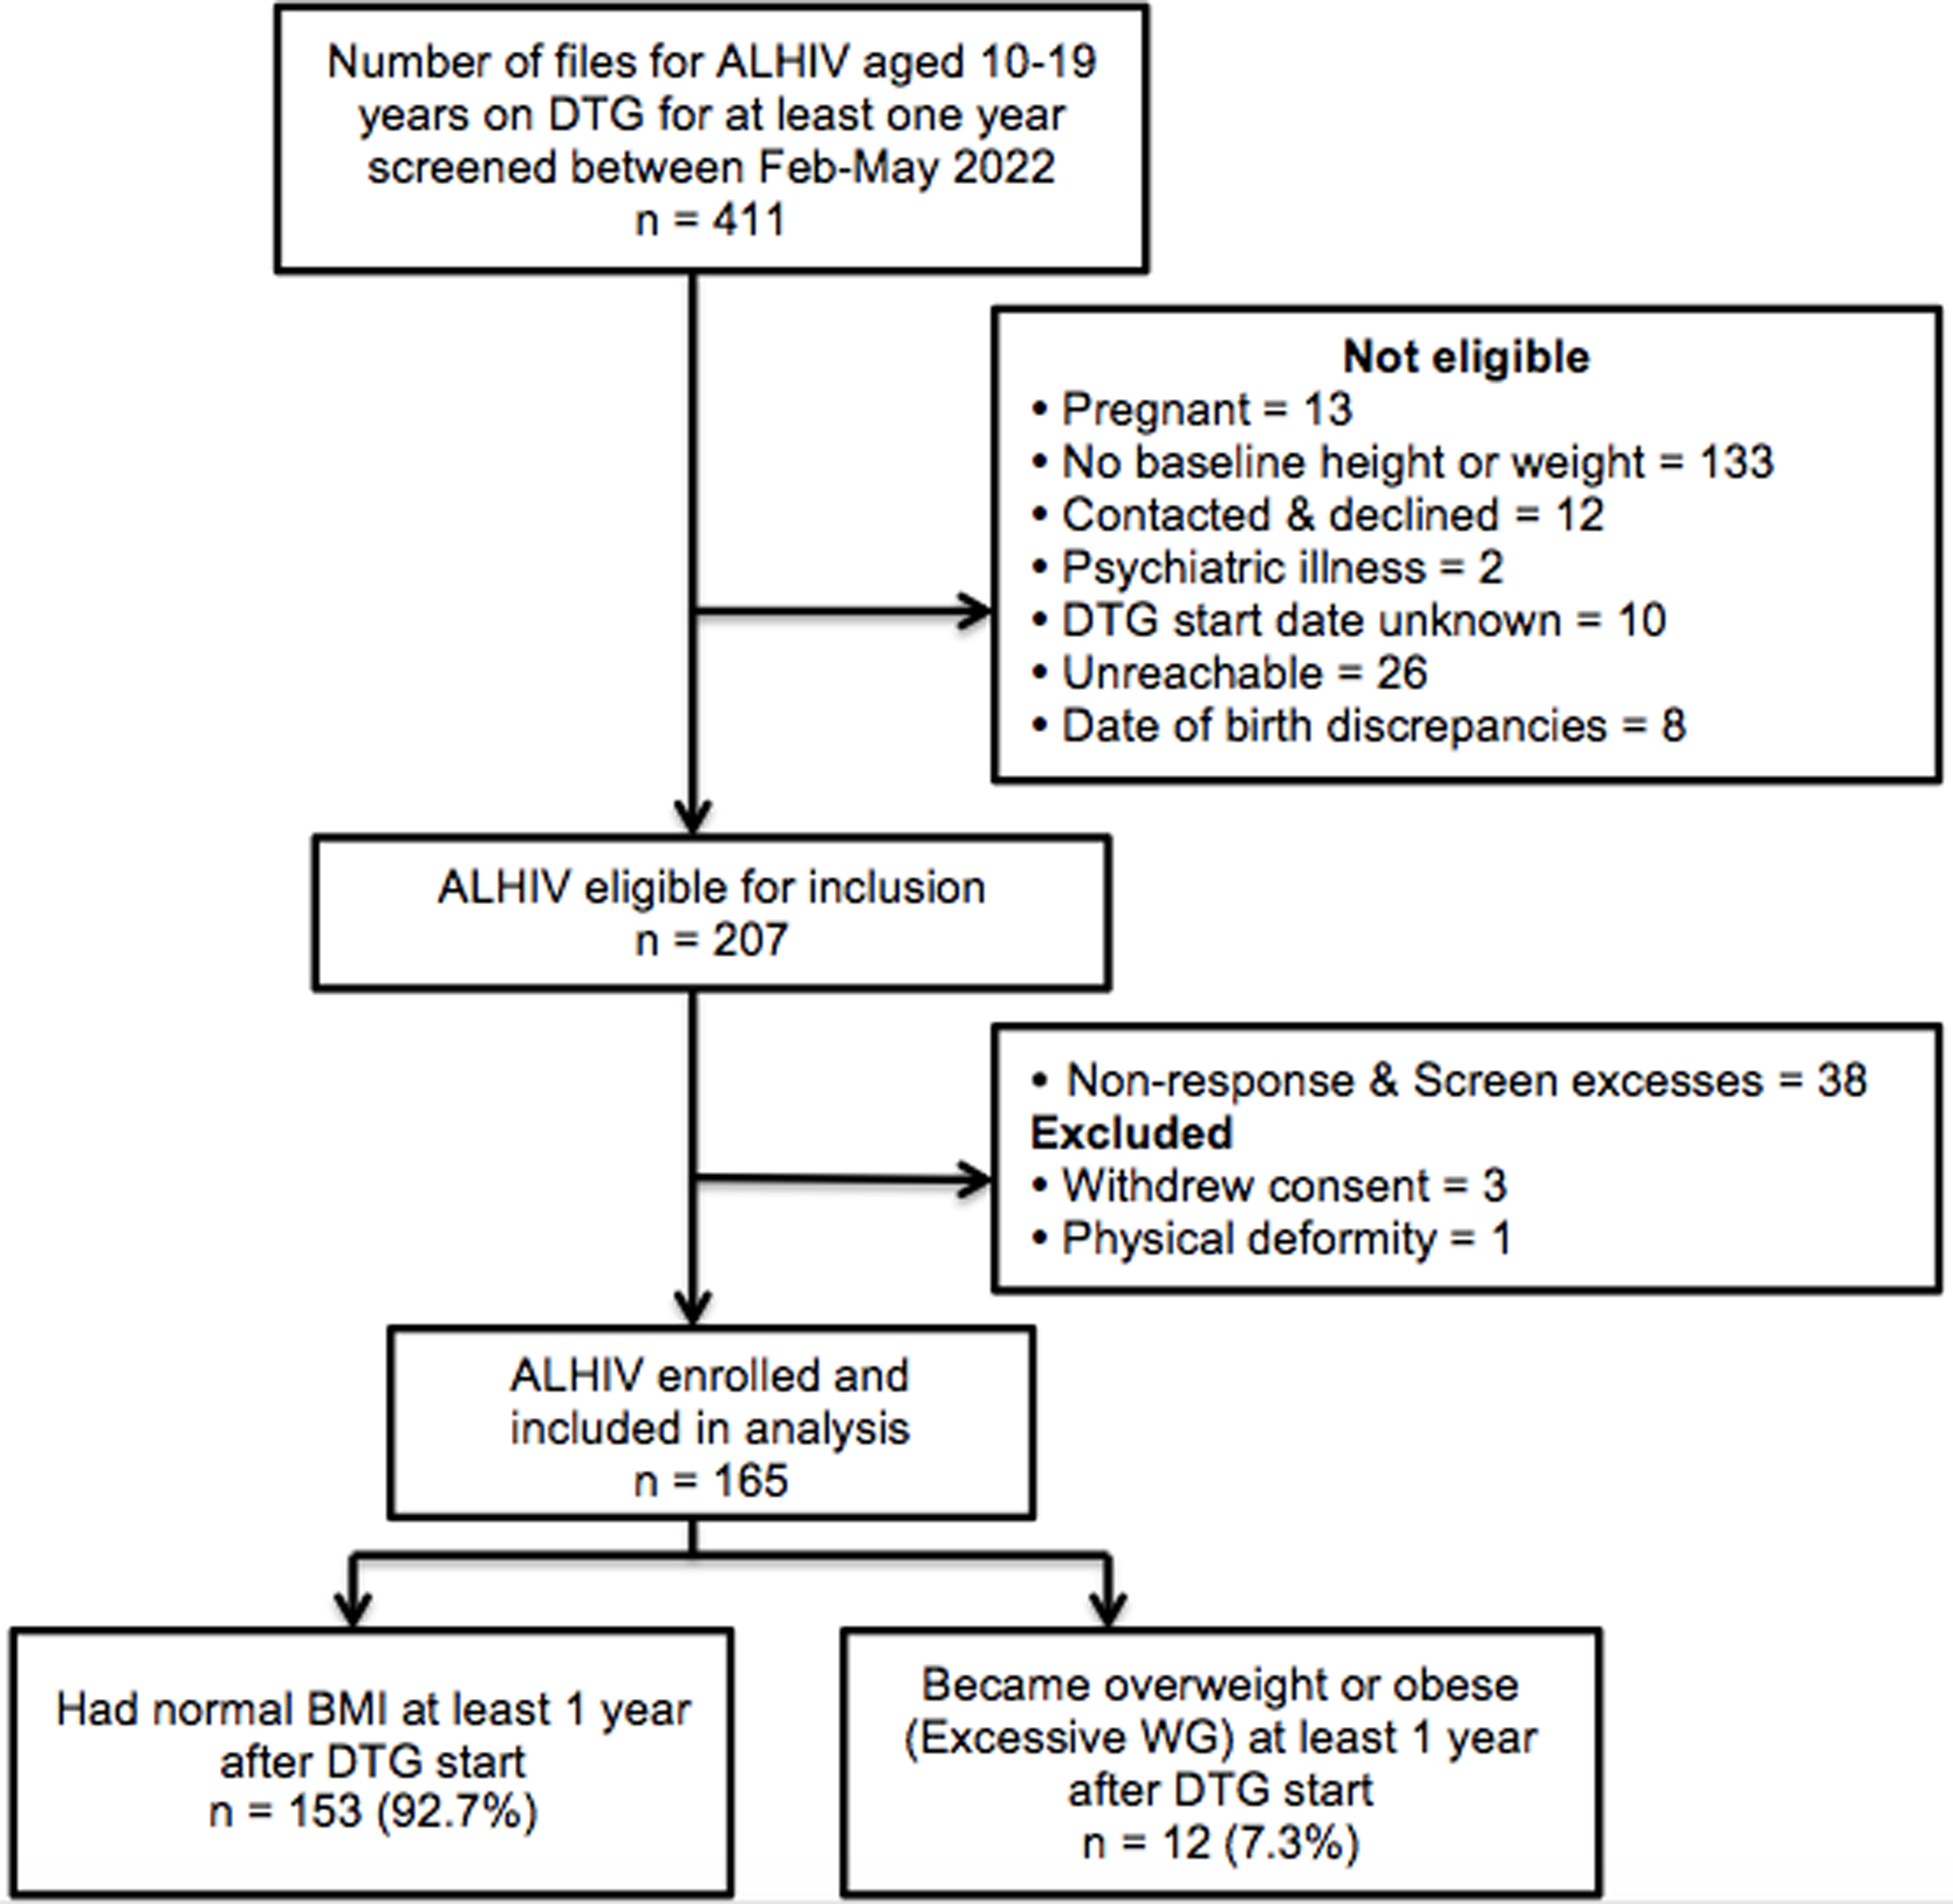
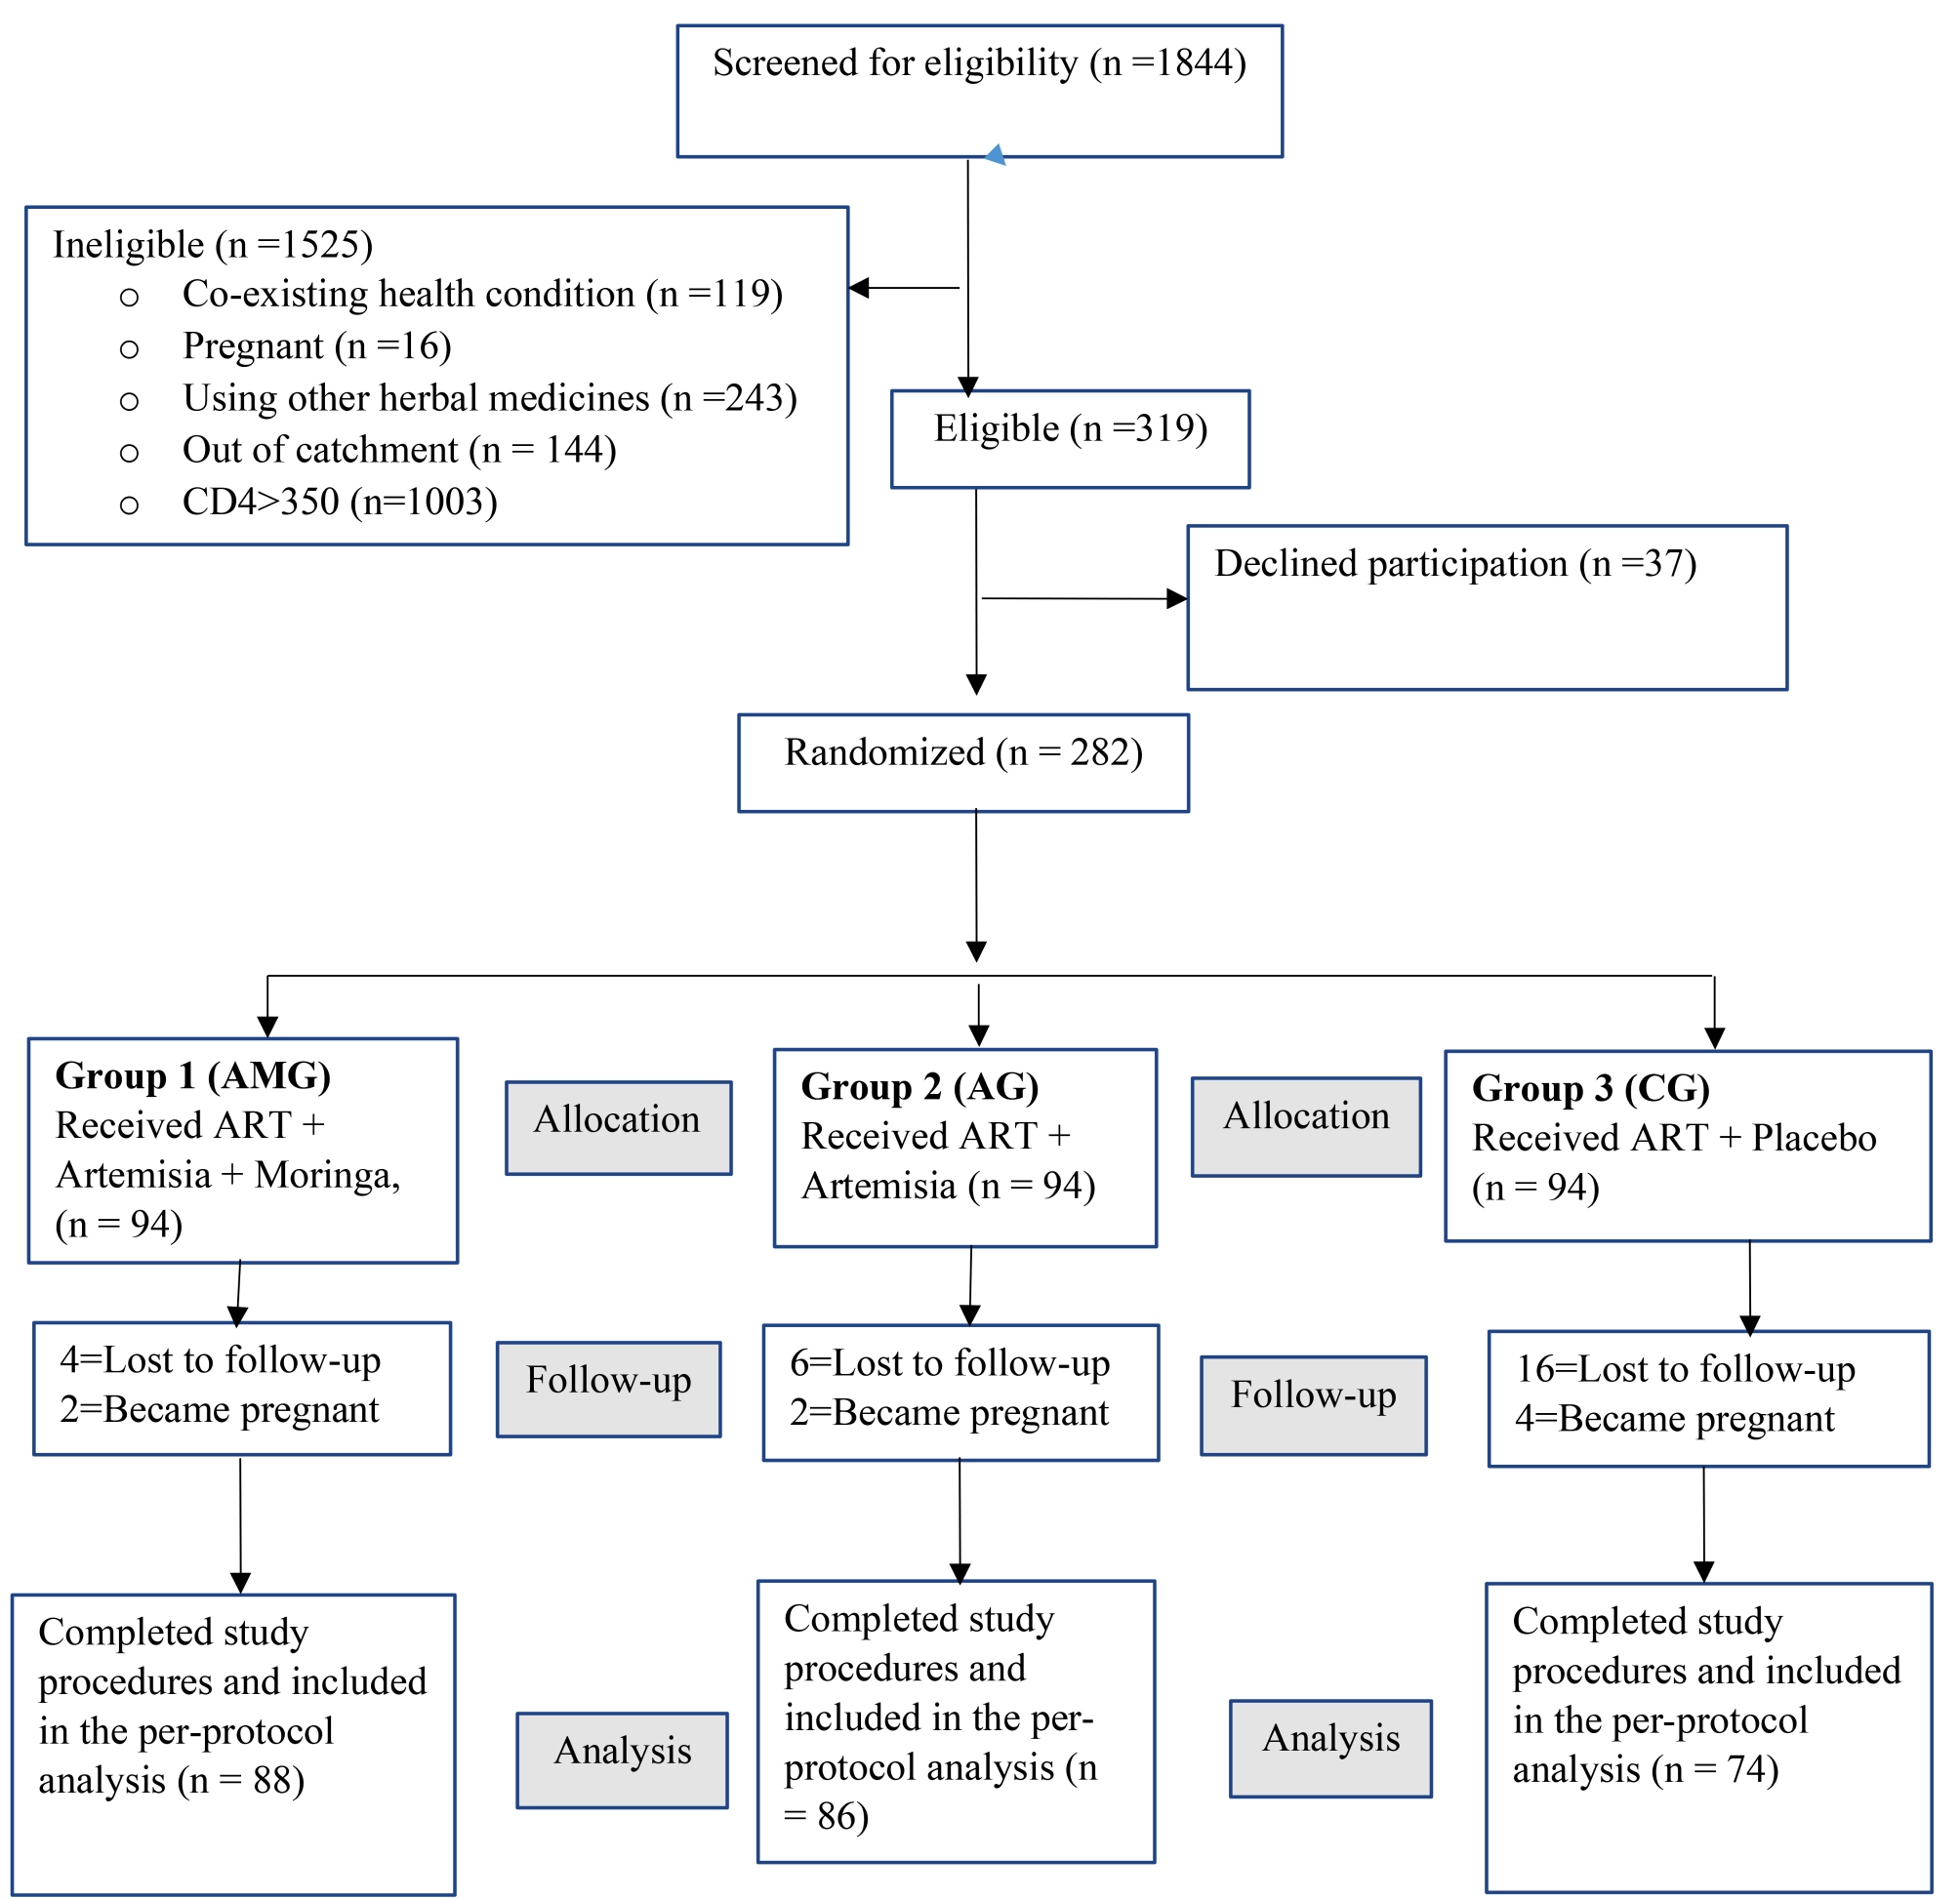
Patients and tissue samples
The cervical specimens, including cases of CIN and cervical cancer, were obtained from patients treated at the Eighth Affiliated Hospital of Guangzhou Medical University in Guangzhou, China, between 2018 and 2022. A total of 118 patients with cervical intraepithelial neoplasia (CIN) grades I–III were included in the study, comprising 54 HIV-positive and 64 HIV-negative patients. Additionally, 48 cervical cancer patients were included, including 26 HIV-infected patients and 22 HIV-negative patients. This study was approved by the Research Ethics Committee of the Eighth Affiliated Hospital of Guangzhou Medical University (Approval No. 202215227). Written informed consent was obtained from patients.
Immunohistochemistry
The cervical lesion specimens used in this study were surgical resection specimens. Following surgical removal, the specimens were fixed with 10% neutral formaldehyde. Immunohistochemistry was performed on 8 μm serial sections mounted on glass slides using a single-staining procedure. The protocols for each antibody were executed following the instructions provided in the Immunohistochemistry kit (Cat. No. PV-9000, Beijing Zhongshan Jinqiao Biotechnology Co. Ltd [ZSGB-BIO], China). The primary antibodies used were E-Cadherin (ZSGB-BIO), cytokeratin (broad-spectrum, ZSGB-BIO), vimentin (ZSGB-BIO), and N-Cadherin (Zhongshan Aoquan Medical Technology Co., Ltd., China).
Comprehensive analysis and scoring were conducted based on the staining intensity and the number of stained cells. The intensity was assessed using a scoring system with values ranging from negative (0) to strong (3). The proportion of staining was scored as follows: 1 (≤ 10%), 2 (11–50%), 3 (51–75%), and 4 (> 75%). An overall expression score was calculated by multiplying the scores for intensity and proportion, resulting in a range of 0 to 12.
Cell lines and cell culture
The SiHa cells and human cervical epithelial cells were obtained from Procell Corporation, Wuhan, China. The SiHa cells were cultured in complete growth medium (Procell Corporation) in a humidified incubator at 37 °C with 5% CO2.
Western blot
The protein was extracted using RIPA lysis buffer, and protein concentration was determined using the Bicinchoninic Acid (BCA) Protein Assay Kit (Thermo Fisher Scientific, USA). The protein sample was separated by SDS-PAGE and subsequently transferred onto PVDF membranes (Millipore, MA, USA). To block nonspecific binding, the membranes were incubated with 5% nonfat milk at room temperature for 2 h, followed by washing with Tris-buffered saline-Tween. Primary antibodies against vimentin (1:1000, Signalway Antibody, USA), N-cadherin (1:3000), E-cadherin (1:10,000), cytokeratin (1:2000, HUABIO, Hangzhou, China), and GAPDH (1:1000, Abcam, USA) were incubated with the membranes overnight (16 h) at 4 °C. Subsequently, the membranes were incubated with the appropriate secondary antibody for 2 h at room temperature. Finally, the immunoreactive proteins were visualized using the ECL detection system (Millipore, MA, USA).
Wound-healing assay
SiHa cells were seeded in a 6-well plate at a density of 1 × 10⁵ cells. The experiment consisted of two groups: a control group and an HIV gp120 and Tat protein treatment group, with each group containing three replicate wells. The treatment group was exposed to 100 ng/ml of HIV gp120 protein and 100 ng/ml of Tat protein (Prospec, USA). The culture medium was replaced daily, and the proteins were added again during each medium change. When the cells reached 90% confluence, wounds were created by scratching a straight line using a 200 µl pipette tip. The wound areas were then imaged at 0 h, 24 h, and 48 h using a microscope. The Image J software (NIH, USA) was utilized to calculate the wound areas.
Transwell assays
SiHa cells were seeded in a 6-well plate at a cell density of 1 × 10⁵ cells. The experiment consisted of two groups: a control group and an HIV gp120 and Tat protein treatment group, with each group containing three replicate wells. The treatment group was exposed to 100 ng/ml of HIV gp120 protein and 100 ng/ml of Tat protein. The culture medium was changed daily, and the proteins were replenished during each medium change. After 5 days of treatment, cells were collected for the Transwell assay. In the lower part of the Transwell chamber, 700 µl of complete medium was added, while in the upper part, 200 µl of serum-free medium containing suspended cells (1 × 10⁴ cells) was added. The cells were allowed to culture overnight, approximately 18 h, after which, the chamber was removed and fixed with 4% paraformaldehyde for 10 min. Subsequently, the cells were stained with crystal violet for 10 min. Following staining, the cells were rinsed with running water, and a gentle rub with a cotton swab was performed to remove the cells that did not transfer to the small chamber. The cells were then counted under a microscope, with nine randomly selected non-overlapping fields of view used for the analysis.
RNA sequencing and bioinformatics analysis
SiHa cells were seeded in a 6-well plate at a cell density of 1 × 10⁵ cells. The experiment consisted of two groups: a control group and an HIV gp120 and Tat protein treatment group, with each group containing three replicate wells. The samples from each group were sent to Gene Denovo Biotechnology Co. (Guangzhou, China) for mRNA sequencing analysis. Total RNA from each sample was isolated using the TRIzol reagent kit (Invitrogen, USA). RNA quality was assessed using an Agilent 2100 Bioanalyzer (Agilent. Technologies, Inc., USA), and agar gel electrophoresis was performed to verify RNA integrity. An oligo(dT) bead enrichment procedure was conducted to extract the target mRNA fragments, which were then reverse-transcribed into double-stranded cDNA (ds-cDNA) using random primers. The cDNA fragments were purified, repaired, poly(A)-tailed, and ligated to construct the library. The library was sequenced using the Illumina NovaSeq 6000 platform (Illumina Inc., USA). Differential expression analysis of the RNA-seq data between the two groups was performed using DESeq2 software (University of California, Berkeley, United States). Significantly differentially expressed genes/transcripts were identified based on a false discovery rate (FDR) below 0.05 and an absolute fold change of ≥ 1.5. Gene Ontology (GO) and Kyoto Encyclopedia of Genes and Genomes (KEGG) pathway enrichment analyses were conducted.
Immunofluorescence
For immunofluorescence labeling and detection, SiHa cells were cultured on coverslips and fixed with 3% formaldehyde in PBS. Permeabilization was achieved by treating the cells with 0.1% saponin. The cells were then blocked with 10% donkey serum at room temperature for 30 min, followed by incubation with anti-β-Catenin antibody (Proteintech, USA; 1:200 dilution) at 4 °C overnight. After washing with PBS 3 times, the cells were incubated with Cy3-conjugated goat anti-rabbit antibodies (Abcam, UK; 1:3000 dilution) at room temperature for 50 min. The cover slips were then mounted using Fluoroshield with DAPI (Sigma, USA). Cell immunofluorescence imaging was observed using a Nikon Eclipse Ti Confocal Laser Scanning Fluorescence Microscope (Nikon, Japan).
Statistical analysis
Continuous data were indicated with mean ± SD (standard deviation) while categorical data were indicated with number and percentage (%). For comparisons of means between two groups, the student’s independent t-test was used. Categorical data were tested using the Chi-square test or Fisher’s exact test (if an expected value ≤ 5 was found). For comparisons of means among multiple groups equal to or larger than 3, one-way analyses of variance (ANOVA) with Fisher’s Least Significant Difference (LSD) post hoc multiple comparisons was used. A P value < 0.05 was considered statistically significant. All the above analyses were performed using IBM SPSS Version 25 (SPSS Statistics V25, IBM Corporation, Somers, New York). After RNA sequencing, the differential gene expression RNA-seq was analyzed using a difference comparison volcano map, differential gene clustering heat map, and GO enrichment analysis.


留言 (0)