
記住我


People enrolled in both Medicare and Medicaid, or dual-eligible beneficiaries, have on average higher needs, higher costs, lower income, and higher rates of people from historically underserved groups than Medicare-only beneficiaries.1 The lack of coordination between Medicare and Medicaid services results in a fragmented care experience and suboptimal outcomes for dual-eligible beneficiaries.2 Developing methodologies and measures linking Medicare and Medicaid data sources are needed to improve care coordination and measure patient-centered outcomes.
Medicare-Medicaid integration, such as Financial Alignment Initiatives, dual-eligible special needs plans, and Program of All-Inclusive Care for the Elderly (PACE), has the potential to improve beneficiary outcomes and impact spending by aligning patient outcomes with financial incentives across both programs.3,4 However, assessing these models using only Medicare or Medicaid data for dual-eligible beneficiaries may result in inaccurate measures of key outcomes and miss beneficiaries’ full psychosocial and physical health needs. For example, Medicaid claims might not capture all hospital admissions if Medicare covered the full cost. Medicare claims might miss nursing home and community-based services (HCBS) primarily funded by Medicaid. The design and evaluation of Medicare-Medicaid integration models must have a robust data infrastructure to best evaluate patient-centered utilization, payer spending, and out-of-pocket cost outcomes for dual-eligible beneficiaries.
Studies of Medicare and Medicaid have largely relied on the Medicare-Medicaid Linked Enrollees Analytic Data Source, last updated in 2012.5,6 Starting in 2014, a Centers for Medicare & Medicaid Services (CMS) repository for State Medicaid data (Transformed Medicaid Statistical Information System) became available for linkage to Research Identifiable Medicare administrative files using a common identifier; however, states and researchers often need to use local state-sourced Medicaid program data streams because (1) they include data assets that are not captured in Transformed Medicaid Statistical Information System, (2) the local data and systems are familiar to programmers, or (3) they require reduced capacity and resources than accessing linked data through ResDAC. Many studies using state-sourced data provide limited information on definitions and validation to inform research using linked data.7 There are few peer-reviewed methodological papers describing linkages of Medicare claims with state-sourced Medicaid administrative enrollment. Those we identified are restricted to 1 county or subgroups of the dual-eligible population (diabetes, over age 65).8,9
Given the growing state and federal interest in Medicare-Medicaid integrated programs, methods for defining dual-eligible populations, validating linkages, and reconciling outcome measures in contemporary state-sourced Medicaid data are needed. We build on prior evidence by validating the linkage of more contemporary (2014–2017) state-based Medicaid data with Medicare claims in a general population of dual-eligible beneficiaries for the state of North Carolina (NC). In addition, over 95% of NC Medicaid beneficiaries are served by fee-for-service rather than managed care in this time period. As a result, we are able to evaluate outcome measures in a more complete population than in states with a high prevalence of managed care.
This project proposes standardized linkage and reconciliation approaches to support the development of patient-centered outcomes measures. Our goal is to describe linkage validation, full-benefit dual-eligibility (FBDE) verification, need-based subgroup identification, and utilization and payer spending outcomes reconciliation of linked Medicare and Medicaid claims data for a North Carolina (NC) dual-eligible cohort. We present this approach as a test case as more states work to fully integrate care for duals.
METHODS Data SourceThis study utilized 100% of Medicare and Medicaid claims for NC beneficiaries, including Medicare and Medicaid health care claims files (Supplemental Table 1, Supplemental Digital Content 1, https://links.lww.com/MLR/C691) and NC Medicaid enrollment and demographic files. The separate existing data use agreements with CMS and NC Department of Health and Human Services (DHHS) were updated to allow the linkage of beneficiaries across both sources. The Institutional Review Board, NC Department of Health and Human Services, and CMS approved this study.
Identification and LinkageOur target population was full-benefit dual-eligible (FBDE) beneficiaries. NC DHHS identified NC Medicaid beneficiaries who were dually enrolled in Medicaid and Medicare at any point during 2013–2017. Their definition combined beneficiaries with partial Medicaid benefits, such as Qualified Medicare Beneficiary (QMB) who receive Medicare subsidies only, and those with full Medicaid benefits, which includes programs such as Qualified Medicare Beneficiary Plus (QMB+) and Special Low-income Medicare Beneficiary Plus (SLMB+). This beneficiary list was sent directly to a CMS contractor to create a crosswalk of encrypted Medicaid and Medicare ID variables to link these beneficiaries’ claims to our in-house data. Beneficiary names and direct identifiers were never shared with the research team to protect beneficiary privacy and confidentiality.
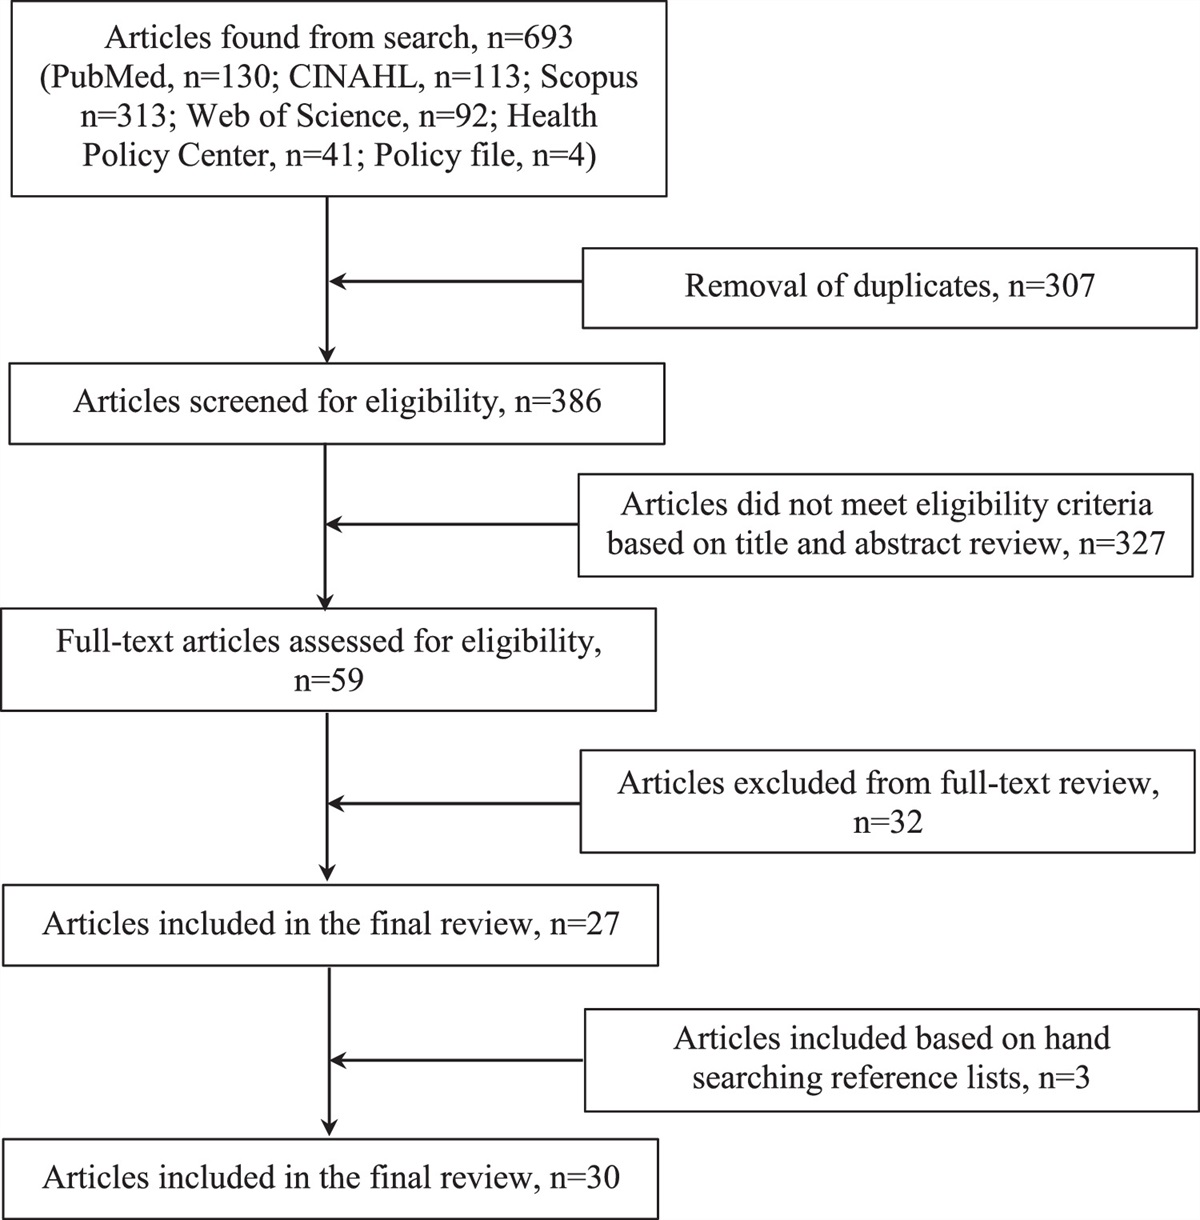
Validating LinkageWe systematically identified and processed missing or duplicate encrypted Medicare IDs from the beneficiary crosswalk (Fig. 1). First, we removed encrypted Medicaid IDs that did not match Medicare IDs. Second, we removed matched Medicare IDs not found within the institutional data, or that linked to multiple Medicaid IDs. We reconciled instances where 1 Medicaid ID linked to multiple Medicare IDs (eg, in rare instances where 1 person had multiple Medicaid IDs over separate periods of enrollment). If both Medicare IDs had health care claims, both IDs and Medicaid ID were removed. If only 1 Medicare ID had a health care claim, that Medicare ID and the Medicaid ID were retained. If neither Medicare ID had a health care claim, the Medicare ID with longer enrollment, or last in alphabetical order if enrollment was equal, and the Medicaid ID were retained. Third, we removed Medicaid IDs that were only found in 2013, as we excluded that year from our study period. Finally, we validated the crosswalk linkage by comparing sex and date of birth between Medicare and Medicaid files for the linked IDs.
 FIGURE 1:
 STROBE diagram depicting the creation of the analytic cohort of NC FFS. full-benefit dual-eligible beneficiaries (FBDE)DHHS indicates Department of Health and Human Services; FBDE, full-benefit dual-eligible; FFS, fee-for-service; PACE, Program of All-inclusive Care for the Elderly.
Validating EligibilityWe validated dual Medicaid and Medicare eligibility in the Medicaid institutional data against that identified by DHHS in the original finder file. Eligibility was defined by DHHS as meeting at least one of the following: (1) enrollment in the Medicaid QMB aid program; (2) classified as an SLMB or qualifying individual; or (3) Medicaid record of concurrent enrollment in Medicare coverage. We added (4) enrollment in the Medicaid Aid to the Aged or State/County Special Assistance to the Aged aid program for medically or categorically needy once we found that beneficiaries in this group were misclassified as nondual enrollees using the first 3 criteria. These last categories are state-specific program options outside of the QMB, SLMB, and qualifying individual eligibility programs; medically needy eligibility provides coverage to aged individuals whose income is higher than the limits for other Medicaid programs but not enough to afford their medical care.
To be eligible for our cohort, we required at least 1 month of full dual enrollment status during the study period. Medicaid monthly enrollment was based on the Medicaid enrollment file and defined as ≥16 consecutive days for consistency with the program variable definitions, which accounted for plan-switching and other changes during the month. Dual-eligible beneficiaries enrolled in both programs and not in a partial dual program were considered full dual enrollees.
To assess health care utilization and spending outcomes, we further restricted our cohort to those with at least 1 month of fee-for-service (FFS) Medicare enrollment (Parts A and B in the Medicare buy-in indicator) while also a full dual beneficiary. Medicare managed care enrollees and those in the Program of All-inclusive Care for the Elderly (PACE; integrated managed care), were excluded because our institutional data only includes FFS claims.
Finally, we excluded pediatric beneficiaries younger than 21 years on the first date of dual enrollment, as their utilization and spending were expected to be markedly different from adults.
Reconciling Medicaid and Medicare DataWe established a priori that Medicaid would be the primary source of demographic data because it is largely self-reported for race and ethnicity; Medicare has known limitations for racial groups other than Black and White.10,11 When missing, we used the Medicare value. For variables with multiple years (eg, county of residence), we used the most recent available value.
We identified need-based subgroups using information only available through Medicaid. Medicaid has benefit plans for those with special needs that provide extra supportive services, including the Innovations Waiver and Community Alternatives Program for Children and Community Alternatives Program for Disabled Adults (CAP-C/DA). Enrollment in these benefit plans for at least 1 month was categorized as being in that subgroup. HCBS, reimbursed by Medicaid only, identified community-based individuals who needed long-term services and supports. Intensive behavioral health (BH) programs covered by Medicaid identified those with severe mental, BH, and intellectual or developmental disability (IDD) needs. We identified nursing home residents as those with at least 100 consecutive days of Medicaid service dates with place of service indicating skilling nursing facility, nursing facility, or custodial care facility. Beneficiaries could be in multiple subgroups. Those in none of the previous subgroups were identified as “community well.”
Given that Medicare is the primary payer for FBDE and is nationally consistent (compared with state-level Medicaid claims), we aligned outcomes from Medicaid to Medicare where possible. In many cases, Medicare data are preprocessed by CMS into data files based on service type (eg, outpatient and inpatient data tables), whereas these state-specific Medicaid data are delivered as coarser Institutional and Professional files, which are processed to extract utilization and service categories (eg, inpatient vs. outpatient facility encounters). This was an iterative process that sourced and adapted prior definitions where possible12 and involved DHHS guidance. When the definitions could not be reconciled, we present the results separately. Final utilization categories were emergency department (ED) visits, inpatient hospitalization, Medicare skilled nursing facility (SNF; Medicare only), Medicaid facility–based postacute/longer-term care (with subcategories SNF/nursing homes and intermediate care facilities; Medicaid only), HCBS (Medicaid only), BH services, home health, and hospice. Additional categories for spending outcomes were outpatient facility, carrier, durable medical equipment, and dental (Medicaid only). Within these categories, covered services may vary (eg, only NC Medicaid covers vision). Definitions with code lists and the rationales used to align Medicaid to Medicare categories are shown in Supplemental Table 1, Supplemental Digital Content 1, https://links.lww.com/MLR/C691, and can be applied to other administrative claims data sources.
Statistical AnalysisWe characterized the cohort using frequencies and proportions for categorical variables and medians and quartiles for continuous variables. Utilization rates were calculated as the total number of events divided by the total number of person-years (time enrolled in Medicare Parts A and B and FBDE during the study period), separately for Medicaid and Medicare due to coverage differences between Medicaid and Medicare. With this approach, the utilization types should be comparable by payer but cannot be summed across to represent the true total utilization. Medicare is the primary payer for acute care services, so we interpreted acute care services observed in Medicaid claims as Medicaid-funded coinsurance for the same services observed in Medicare. Spending was calculated as the total paid amount divided by the total number of person-years for Medicaid, Medicare, and combined. We calculated 95% CIs for all rates using 1.96 SDs from the mean to identify the 2.5th and 97.5th percentiles. Differences are described in terms of how the absolute rates of service use and spending observed in Medicaid and Medicare data differ. All analyses were conducted using SAS v9.4 (Cary, NC). Statistical significance testing was not performed in this descriptive analysis.
RESULTSSee Figure 1 for cohort creation and counts. NC DHHS identified 498,030 unique beneficiaries ever dually enrolled in Medicaid and Medicare. The CMS contractor matched 92% of Medicaid identifiers to a Medicare identifier, and among those, found 99.98% and 99.92% concordance between Medicaid and Medicare for sex and date of birth, respectively. Most (85.5%, N=425,664) matched Medicare identifiers in our institution’s Medicare claims data. Overall, 72,366 individuals were removed in the linkage and verification stages, 92,424 were found to be ineligible for full Medicaid benefits (partial Medicaid benefits only), 49,918 were excluded due to enrollment in Medicare Advantage only or PACE, and 2148 children (0–20 years old) were excluded.
Among the final cohort of 281,174 beneficiaries, concordance between Medicaid and Medicare was 99.99% for sex and 99.94% for date of birth. Overall, 147,225 were adults under 65 years (31.3% 21–44; 28.3% 45–54; 40.4% 55–64), and 133,949 were adults 65 years and older (45.8% 65–74; 31.5% 75–84; 22.8% ≥85) (Table 1). A majority were White (58.8%), non-Hispanic (91.5%), female (60.3%), and lived in urban counties (65.3%). About 1 in 10 were ever a partial dual enrollee for part of the study period.
TABLE 1 - Demographic Characteristics of NC FFS Full-benefit Dual-eligible Beneficiaries Age group Variable Overall Adults under 65 Adults 65 and older N (%) 281,174 147,225 (52.4)* 133,949 (47.6)* Demographics Age (y), median (Q1, Q3) 64.0 (51.0, 75.0) 52.0 (41.0, 59.0) 76.0 (69.0, 84.0) Race, n (%) American Indian or Alaskan Native 3917 (1.4) 2072 (1.4) 1845 (1.4) Asian 5059 (1.8) 1007 (0.7) 4052 (3.0) Black 100,836 (35.9) 57,292 (38.9) 43,544 (32.5) Multiracial 4688 (1.7) 2989 (2.0) 1699 (1.3) Native Hawaiian or Pacific Islander 144 (0.1) 61 (0.0) 83 (0.1) Unknown 1173 (0.4) 327 (0.2) 846 (0.6) White 165,357 (58.8) 83,477 (56.7) 81,880 (61.1) Ethnicity, n (%) Non-Hispanic 257,328 (91.5) 137,890 (93.7) 119,438 (89.2) Hispanic 9793 (3.5) 3941 (2.7) 5852 (4.4) Unknown 14,053 (5.0) 5394 (3.7) 8659 (6.5) Female sex 169,956 (60.4) 77,238 (52.5) 92,718 (69.2) Rurality, n (%) Urban 183,463 (65.2) 99,387 (67.5) 84,076 (62.8) Rural 95,831 (34.1) 47,313 (32.1) 48,518 (36.2) Unknown 1880 (0.7) 525 (0.4) 1355 (1.0) Chronic conditions, Median (Q1, Q3) 7.0 (4.0, 11.0) 5.0 (2.0, 8.0) 10.0 (7.0, 13.0) Ever partial dual 32,866 (11.7) 17,627 (12.0) 15,239 (11.4) Need-based subgroups, n (%) CAP-DA† 15,329 (5.5) 7310 (5.0) 8019 (6.0) Innovations/TBI† 3821 (1.4) 3637 (2.5) 184 (0.1) HCBS users 43,666 (15.5) 16,065 (10.9) 27,601 (20.6) Nursing home residents 18,348 (6.5) 1780 (1.2) 16,568 (12.4) Intensive BH/IDD service users 45,880 (16.3) 37,960 (25.8) 7920 (5.9) Community well 178,449 (63.5) 96,574 (65.6) 81,875 (61.1)*Row percentages; all remaining percentages are column percentages.
†These benefit plans provide extra community-based support for those with intellectual/developmental disabilities or medically fragility.
BH indicates behavioral health; CAP-DA, Community Alternatives Program for Disabled Adults; FFS, Fee-For-Service; HCBS, home and community-based services; IDD, intellectual and developmental disability; NC, North Carolina; TBI, traumatic brain injury.
The most common need-based subgroups among the adults under 65 were intensive BH/intellectual and developmental disability (IDD) service users (25.8%) and HCBS users (10.9%); less common among this age group were CAP-DA or Innovations waiver recipients and nursing home residents. Among adults 65 and older, the most common were HCBS users (20.6%) and nursing home residents (12.4%); less common were the CAP-DA or innovations waiver recipients and intensive BH/IDD service users. Overall, about 3 out of 5 beneficiaries were community well (no need-based subgroups; 65.6% and 61.1% among under 65 and 65 and older, respectively).
Health Care UtilizationThe overall ED utilization rate was similar by payer for adults under 65 but was substantially lower in Medicaid among adults 65 and older (Table 2). Observed hospital admissions, inpatient days, home health days, and hospice days were higher in Medicare than in Medicaid among both age groups. Medicare SNF days and Medicaid combined postacute and long-term care and HCBS days were higher among the adults 65 and older than younger adults (50.51 vs. 25.87 per person-year).
TABLE 2 - North Carolina Fee-for-service Full-benefit Dual-eligible Beneficiaries’ Medicare and Medicaid Health Care Utilization Per Person-year by Age Group Adults under 65 N=147,225 Adults 65 and older N=133,949 Service categories Medicaid utilization rate* (95% CI)† Medicare utilization rate* (95% CI)† Medicaid utilization rate* (95% CI)† Medicare utilization rate* (95% CI)† Emergency department visits (ED) 1.62 (1.61, 1.62) 1.73 (1.73, 1.74) 0.83 (0.82, 0.83) 1.30 (1.30, 1.31) With admit 0.05 (0.05, 0.05) 0.31 (0.30, 0.31) 0.04 (0.04, 0.04) 0.41 (0.41, 0.41) Without admit 1.57 (1.56, 1.57) 1.43 (1.42, 1.43) 0.78 (0.78, 0.79) 0.90 (0.89, 0.90) Hospital admissions 0.26 (0.26, 0.26) 0.45 (0.45, 0.45) 0.31 (0.31, 0.31) 0.52 (0.52, 0.52) Inpatient days 2.24 (2.23, 2.24) 3.67 (3.66, 3.67) 2.16 (2.16, 2.17) 3.79 (3.78, 3.79) Home health days 1.78 (1.78, 1.78) 7.09 (7.08, 7.10) 4.04 (4.04, 4.05) 14.20 (14.19, 14.21) Hospice days 0.20 (0.20, 0.20) 0.70 (0.70, 0.70) 3.31 (3.30, 3.31) 6.70 (6.69, 6.71) Behavioral health services 14.92 (14.90, 14.93) 3.07 (3.06, 3.07) 4.61 (4.61, 4.62) 1.52 (1.52, 1.53) Medicare only Skilled nursing facility days — 2.17 (2.17, 2.18) — 12.59 (12.58, 12.61) Medicaid only Postacute and long-term care 11.45 (11.44, 11.46) — 66.08 (66.05, 66.10) — SNF/nursing home days 8.65 (8.64, 8.66) — 65.48 (65.45, 65.51) — Intermediate care facility days 2.80 (2.79, 2.80) — 0.60 (0.60, 0.60) — HCBS days 25.87 (25.85, 25.89) — 50.51 (50.49, 50.54) —*Rates shown as utilization per person year.
†CIs are shown for completeness but are narrow due to large sample size.
CI indicates confidence interval; HCBS, home and community-based services; SNF, skilled nursing facility.
Overall yearly per person spending was higher for Medicare than Medicaid among those under 65 ($12,785; $9161) but similar by payer for adults 65 and older ($16,720; $15,809; Table 3). By age group, Medicaid, Medicare, and combined yearly spending were higher for the adults 65 and older ($16,720; $15,809; $32,529) than those under 65 ($9161; $12,785; $21,946) (Tables 3 and 4). The highest cost categories for adults under 65 were outpatient facility, carrier, and inpatient. However, among adults 65 and older, the highest yearly spending was Medicaid SNF/nursing homes, followed by carrier and outpatient facility.
TABLE 3 - North Carolina Fee-for-service Full-benefit Dual-eligible Beneficiaries’ Medicare and Medicaid Health Care Spending Per Person-year by Age Group Adults under 65 N=147,225 Adults 65 and older N=133,949 Service categories Medicaid spending rate* (95% CI)† ($) Medicare spending rate* (95% CI)† ($) Medicaid spending rate* (95% CI)† ($) Medicare spending rate* (95% CI)† ($) Overall spending‡ 9161 (9161, 9162) 12,785 (12,784, 12,785) 16,720 (16,720, 16,720) 15,809 (15,809, 15,810) Inpatient 86 (86, 86) 5021 (5020, 5021) 85 (85, 85) 5483 (5483, 5483) Outpatient facility 4902 (4902, 4903) 3157 (3157, 3157) 3395 (3395, 3395) 2700 (2700, 2700) Carrier 2388 (2388, 2388) 3085 (3085, 3085) 3888 (3888, 3888) 3182 (3182, 3182) Home Health 142 (142, 142) 353 (353, 353) 231 (231, 231) 787 (786, 787) Hospice 27 (27, 27) 120 (120, 120) 414 (414, 414) 1043 (1043, 1043) DME 40 (40, 40) 513 (513, 513) 29 (29, 29) 353 (352, 353) Medicare only Skilled nursing facility — 536 (536, 536) — 2262 (2262, 2262) Medicaid only Postacute and long-term care 1369 (1369, 1369) — 8565 (8565, 8566) — SNF/nursing home 1196 (1196, 1196) — 8510 (8510, 8510) — Intermediate care facility 173 (173, 173) — 55 (55, 55) — Dental 207 (207, 207) — 113 (113, 113) — HCBS§ 944 (944, 944) — 2080 (2080, 2080) —*Rates shown as spending for each payer per person year.
†CIs are shown for completeness but are narrow due to large sample sized.
‡Within each category, there may be differences in what Medicaid versus Medicare covers; for example, only Medicaid covers hearing and vision, which are captured under Carrier.
§HCBS spending is covered in the prior categories (eg, carrier and outpatient) and were not added again to the overall spending amount.
CI indicates confidence interval; DME, durable medical equipment; HCBS, home and community-based services; SNF, skilled nursing facility.
*Rates shown as spending for each payer per person year.
†CIs are shown for completeness but are narrow due to large sample size.
‡Within each category, there may be differences in what Medicaid versus Medicare covers; for example, only Medicaid covers hearing and vision, which are captured under Carrier.
§HCBS spending is covered in the prior categories (eg, carrier and outpatient) and do not added again to the overall spending amount.
HCBS indicates home and community-based services; SNF, skilled nursing facility.
This study demonstrated a process to standardize beneficiary-level linkages of Medicare and Medicaid data sources, verify full and partial dual eligibility, and reconcile patient health care utilization across payers to better understand the diverse needs of dual-eligible beneficiaries. Linked data also allowed us to identify needs-based subgroups (eg, due to medical fragility, intellectual or developmental disabilities, and intensive BH service users) to support the development of patient-centered outcome measures for this heterogeneous population. There are 3 key learnings for future researchers and administrators seeking to link these data to measure patient-centered outcomes.
The Medicaid program data are critical for identifying all dual-eligible beneficiaries. Like NC, many states offer full Medicaid benefits to individuals who do not qualify for Medicare premium subsidies and thus would not be identified using only Medicare data. Poor sensitivity and predictive value of the Medicare buy-in indicator have also been documented in other states.13 NC Medicaid race and ethnicity data were largely self-reported—a method considered the gold standard for identifying race and ethnicity10—and more complete relative to other states (2.0% missing race in NC vs. 17.4% national average).14 In contrast, Medicare data are known to be problematic for identifying races other than White and Black10 and limit beneficiaries to a single combined race/ethnicity category.11 Although our study is specific to NC, our outcomes reconciliation processes can inform methods for researchers using other states’ linked data. The utilization definitions, in particular, are applicable across both managed care encounter data and fee-for-service claims; thus, even as NC Medicaid has transitioned to a predominantly managed care model beginning in 2021, these processes remain relevant.We provide an example of how to measure patient outcomes and interpret substantial variation in utilization and spending by data source. In addition to the high-level categories of spending shown here, these data could also be used to evaluate other patient outcomes impacted by Medicare-Medicaid integration. Medicare-Medicaid integration is particularly important following hospitalization, when beneficiaries transition from acute and postacute care settings (largely funded by Medicare) to long-term HCBSs and supports (largely funded by Medicaid). Linked data are critical for understanding the impacts of care coordination on postacute care and subsequent long-term care utilization. Home time15,16 (days alive and not in a hospital/ED/SNF) has been proposed as a patient-centered outcome measure because it reflects both clinical events and patient preferences for independence. Dual-eligible special needs plans are expected to increase home time by preventing unnecessary institutional care, such as hospitalization or nursing home admission, through improved care coordination across Medicare and Medicaid services.
留言 (0)