
記住我
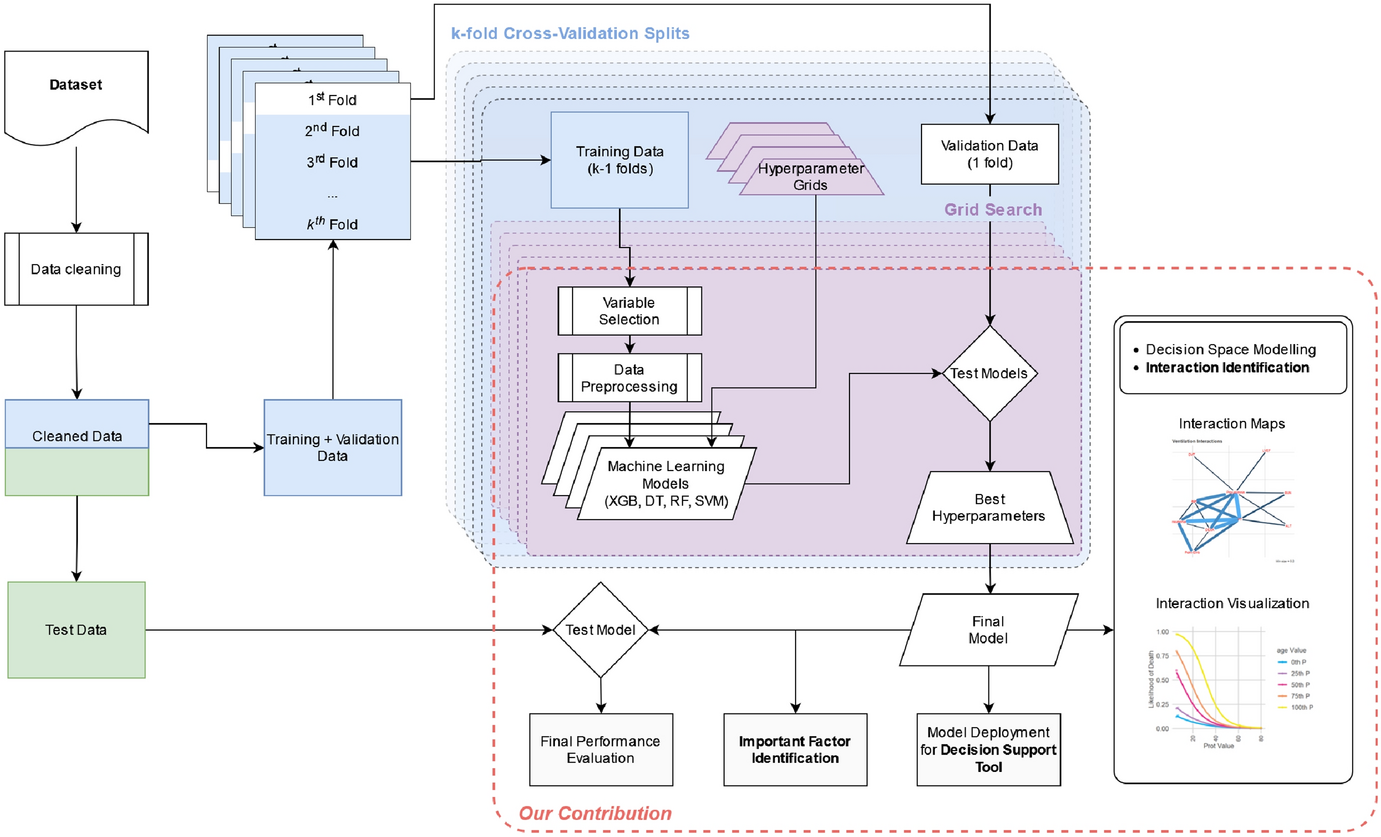
Consider the setting where multiple hospitals are performing the same medical procedure over the duration of a study period. Our goal is to compare four different methods that can be used to inspect the quality of care at different hospitals. These methods are used to distinguish between hospitals providing unsatisfactory care from hospitals that are performing well, which we define as out-of-control and in-control hospitals respectively. This helps the hospitals to identify where it might be necessary to evaluate the care process with plans for subsequent improvement. As early interventions are crucial, we are primarily interested in the time that each method takes to detect deviating hospitals. We are also interested in evaluating which hospitals are detected by each method. The comparison is performed on a real-life study about surgical resection of colon cancer.
We start with a description of a real-life data set on colon cancer surgery. Afterwards we introduce a binary outcome and give two examples of commonly used (binary) charts in this context: the funnel plot (Spiegelhalter 2005) and Bernoulli Cumulative SUM (CUSUM) chart (Steiner et al. 2000). We then introduce survival outcomes and present two survival charts: the Biswas & Kalbfleisch CUSUM (BK-CUSUM) (Biswas and Kalbfleisch 2008) and the Continuous time Generalised Rapid response CUSUM (CGR-CUSUM) (Gomon et al. 2022). We consider a method to determine control limits for the CUSUM charts and conclude this section with a discussion on an alternative use of quality control charts: the detection of an increase in the quality of care.
2.1 DataThe Dutch ColoRectal Audit (DCRA) is a nationwide clinical audit in the Netherlands that includes all patients that underwent surgery for primary colorectal cancer. The audit monitors, evaluates and improves the colorectal cancer care and has a completeness up to 95% which is externally validated (Van Leersum et al. 2013).
A total of 25367 patients who underwent a surgical resection in the period 01/01/2019 up until 31/12/2021 were included in this study, with 71 hospitals performing surgeries. The following patient, disease and procedural characteristics were extracted from the database for risk-adjustment: sex, body mass index (BMI), age, Charlson Comorbidity Index (CCI), American Society of Anesthesiologist (ASA) score, solitary of synchronous tumor, preoperative tumor complications (e.g. obstruction/ileus, perforation, anemia or peri-tumoral abscess), T-stage, M-stage, emergency or elective resection, additional resection due to tumor ingrowth or metastasis (Kolfschoten et al. 2011). A summary of these prognostic factors can be found in Table 1. BMI showed the highest percentage of missing data which is only 1.0%, therefore complete case analysis was performed. Outcomes considered were postoperative mortality within 90 days after resection (average 2.4%) and length of hospital stay in days (mean 7.05, SD 8.93, median 4).
2.2 Binary chartsAfter a surgical procedure, the health of a patient is closely monitored. Due to practical constraints and medical necessity, this usually happens for a fixed amount of time if no complications arise. For this reason, the treating hospital often only knows the vital status of a patient in that specific time period. This practical limitation has made the use of binary outcomes popular where the vital status of a patient is only considered at the end of the follow-up period.
This can be formalised as follows: suppose we have \(j = 1,..., k\) hospitals and consider for each patient \(i = 1,..., n_\) being treated at hospital j the binary outcome \(X_\), which is equal to zero if a patient is alive 90 days after surgery and one if the patient is deceased. For duration of stay, consider \(X_\) to be zero if a patient is still at the hospital 21 days after surgery and one if the patient was discharged. Outcomes for some patients may be censored, indicating that we did not observe the outcome. This can happen for a number of reasons, for example when a patient can no longer be reached for follow-up. We assume that these patients had desirable outcomes (not deceased), but it is also possible to not include these patients into the study. Furthermore, for each patient we have p prognostic factors denoted by \(\varvec_i\).
There are many disadvantages associated with the use of a binary outcome. The DCRA uses a follow-up time of 90 days for postoperative mortality, meaning that deaths later than 90 days after surgery will be ignored. Moreover, the outcome does not reflect how long after surgery a patient passed away. As a consequence, there is no difference in outcome between a patient who passed away one day after surgery and a patient who died 90 days after surgery. Additionally, the choice of follow-up duration is often relatively arbitrary. Choosing a slightly different follow-up time (e.g. 85 days instead of 90) can already significantly change the results of quality control methods. Finally, the use of a binary outcome introduces a time delay in the information stream. As vital status is only registered 90 days after surgery, no information on a patient is known before that point in time. This means that binary outcomes provide “outdated” information, potentially leading to delays in the detection of deviations.
In the following sections, we describe two methods based on binary outcomes that can be used to inspect the quality of care. We introduce the term failure, which is either death (\(< 90\) days) or prolonged hospital stay (\(> 21\) days). We consider the problem of inspecting the quality of care in a specific study period, which is between 01/01/2019 and 31/12/2021 for the DCRA.
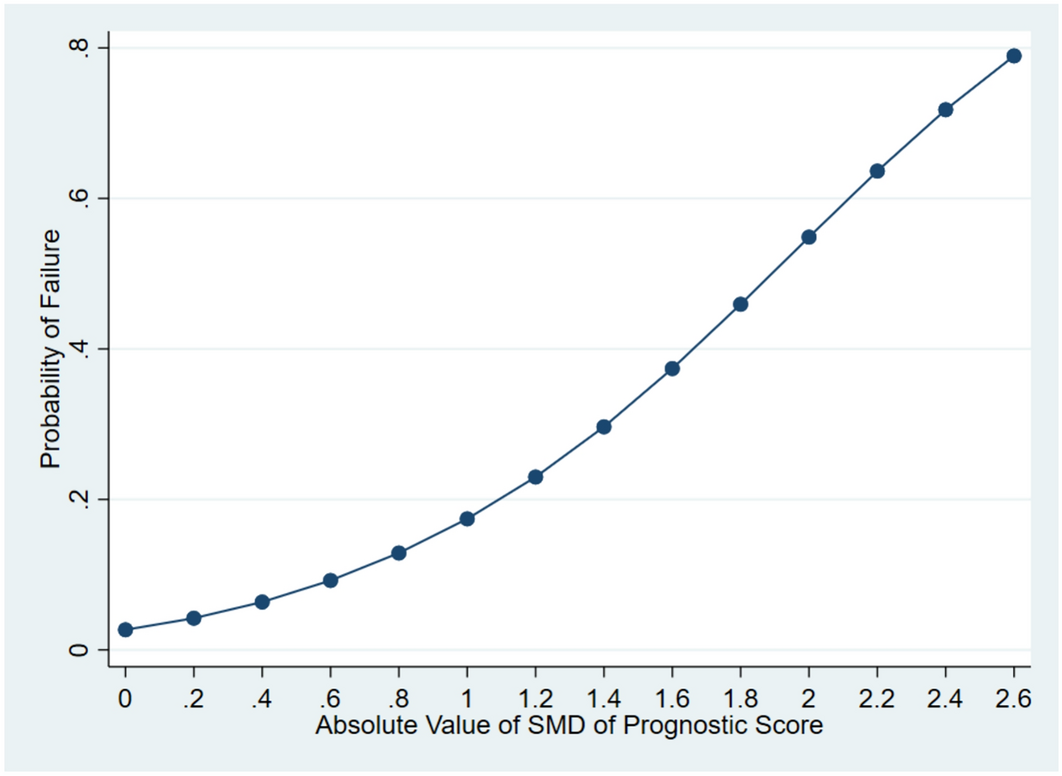
2.2.1 Funnel plotThe funnel plot (Spiegelhalter 2005) can be used to compare the proportion of failures between different hospitals. Suppose that \(p_0\) is an acceptable (baseline) probability of failure for a patient at the end of follow-up. Usually, such a probability is not known and the average failure probability over all patients at all hospitals is considered instead. We would now like to test the null hypothesis that patients at hospital j have an acceptable failure probability against the alternative that they do not. For this, we consider the proportion of failures at the hospital during the study period: \(\gamma _j = \frac^ X_}\). By the central limit theorem, this proportion is asymptotically normally distributed. This means that we can conclude that the probability of failure at this hospital is not in an acceptable range with confidence level \(1-\alpha\) when the proportion is outside the prediction limits:
$$\begin \gamma _j \notin \left[ p_0 + \xi _} \sqrt}, p_0 - \xi _} \sqrt} \right] , \end$$
(1)
where \(\xi _\alpha\) is the \(\alpha -\)th quantile of the standard normal distribution. This means that if \(\gamma _j\) is larger/smaller than the upper/lower boundary, the probability of failure is larger/smaller than baseline, indicating that the quality of care at this hospital is worse/better than expected. Note that the prediction limits only depends on the number of patients treated at a hospital and baseline failure probability.
Simply comparing the proportions of failure does not adequately capture the complexity of treatment between patients. Some patients might have worse prognostic factors than others, making an undesirable outcome more likely. To account for this, a risk-adjusted procedure can be considered where for each patient an individual probability of failure \(p_i\) is modelled using logistic regression. We determine the expected number of failures at a hospital as \(E_j = \sum _^ p_i\). A risk-adjusted proportion of failures is then given by \(\gamma _j^} = \frac \cdot p_0\) where \(O_j\) is the observed number of failures at hospital j. For the risk-adjusted procedure, \(\gamma _j^}\) is used instead of \(\gamma _j\) in Eq. (1) to draw conclusions.
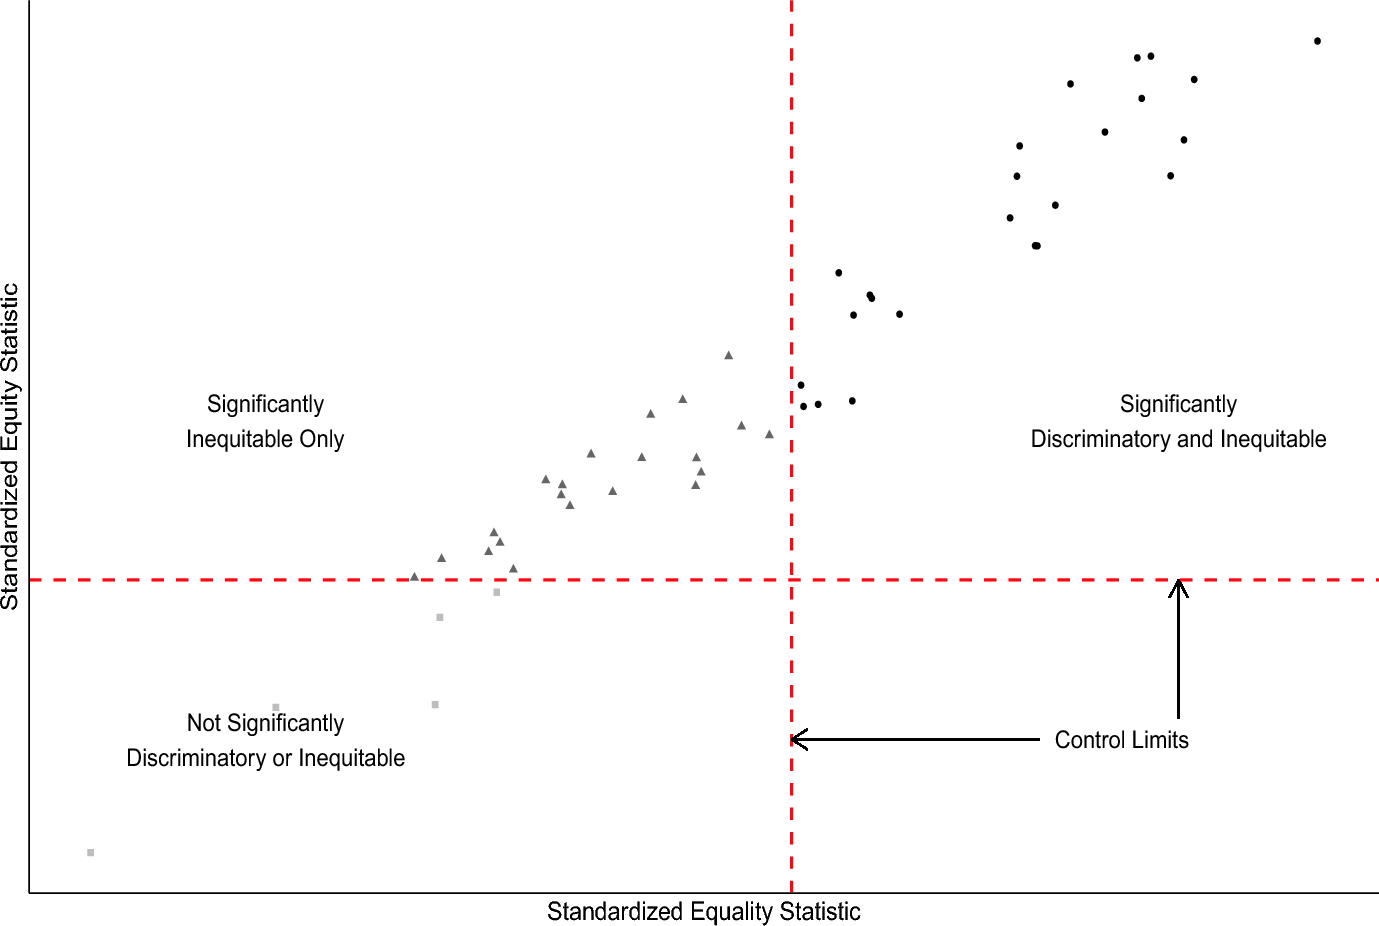
When constructing a (risk-adjusted) funnel plot, we determine the proportions \(\gamma _j^}\) for all k hospitals (\(j = 1,..., k\)) and plot them against the number of treated patients at that hospital in a scatter plot, along with the prediction limits in Eq. (1). An example of risk-adjusted funnel plot is given in Fig. 1.
The goal of funnel plots from a mathematical point of view is to check for an increase/decrease in the failure probability at an institution over a fixed time period. In practice funnel plots are often used to continuously compare the performances of hospitals (Warps et al. 2021), with many consecutive funnel plots being constructed over overlapping time periods. This approach introduces multiple problems, such as an increased probability of a type I error incurred by repeatedly performing a dependent testing procedure. In addition, hospitals that have had a good historical performance and end up in the right lower quadrant of Fig. 1a may not be detected by future funnel plots due to the buffer they have built up in previous years. Finally, with this approach it is not clear how to handle past information of hospitals that have been signalled by a funnel plot. Due to these disadvantages, control charts that allow for the continuous inspection of the quality of care should be used for the intended goal. We focus on such control charts in the following sections.
2.2.2 Binary CUSUMThe binary cumulative sum (CUSUM) chart (Steiner et al. 2000) is a control chart which can be used to test for an increase or decrease in the failure probability of a process. CUSUM charts can be used to test hypotheses sequentially, meaning that the test can be performed after observing each individual outcome. This is not the case for the funnel plot, where the test is performed at the end of the study duration. Consider a single hospital j and suppose we want to test whether the post surgery failure probability has increased from \(p_0\) to \(p_1\) (with \(p_1 > p_0\)) starting from some chronological patient \(\nu \ge 1\). In other words, we are looking for a change point in the failure probability at a single hospital. Again, \(p_0\) is usually not known in practice and therefore determined as an average over all patients. Choosing \(p_1\) can pose considerable challenges; therefore we consider the Odds Ratio \(OR = \frac =: e^\theta\). Choosing \(e^\theta > 1\) results in a test for an increase in failure rate, while \(e^\theta < 1\) produces a test for detecting a decrease in failure rate. The odds ratio is often chosen to be equal to two (Steiner et al. 2000), but a practical reason for this choice is usually lacking.
The binary CUSUM for hospital j after observing the outcome of the \(n-\)th chronological patient is given by:
$$\begin S_ = \max \left( 0, S_ + W_ \right) , \end$$
(2)
where
$$\begin W_ = X_ \ln \left( e^\theta \right) + \ln \left( \frac \right) . \end$$
(3)
For a risk-adjusted procedure the patient specific baseline probability of failure \(p_\) is first modelled using logistic regression and afterwards substituted for \(p_0\) in Eq. (3). Note that \(W_\) is positive if patient n has failed, and negative otherwise. This means that the value of the binary CUSUM chart increases when patients fail and decreases when favourable outcomes are observed.
When constructing a binary CUSUM chart, the value of the chart is plotted against the chronological patient number or against the time at which the outcome was observed for said patient. We signal a change in the failure rate when the value of the chart exceeds the value of a pre-specified control limit h. We discuss how to determine such a control limit in Section “Control limits”. Note that the value of the chart is cut-off at zero, meaning that the CUSUM cannot build up a buffer when the proportion of observed desirable outcomes is large. Examples of binary CUSUM charts can be seen in Figs. 2 and 3.
In addition to employing a binary outcome, the major limitation of a binary CUSUM chart is the need to specify the odds ratio in advance. In most practical scenarios, there will be no information about the expected increase in the failure probability at sub-optimally performing hospitals. Choosing an unsuitable value for the odds ratio may cause the procedure to lose statistical power or cause a delay in detections. Grigg et al. (2003); Grigg and Farewell (2004) describe this problem and other considerations when using risk-adjusted CUSUM charts.
2.3 Survival chartsInstead of considering a binary outcome, it is often advantageous to consider the time until event for each patient, also known as a survival outcome. We then consider \(T_\) to be the time (f.e. in days) until death or discharge of patient i at hospital j. In contrast to binary outcomes, failure here means the observed death or discharge of a patient. Considering the discharge of a patient as a failure might seem unnatural, as discharge is usually considered a positive outcome. The aforementioned dilemma is examined in Section “Lower CUSUM”. For the rest of this section we drop the subscript j and consider the problem of detecting an increase in the failure rate at a single hospital.
We model the survival times using a Cox proportional hazards model (Cox 1972) where the patient specific hazard rate is given by \(h_i(t) = h_0(t) \exp (\varvec^\top \varvec_i)\); the term \(h_0(t)\) represents the baseline hazard and \(\varvec\) a coefficient vector indicating the risk associated with the corresponding prognostic factors. The baseline hazard indicates an acceptable failure probability and is usually not known in practice, similarly to \(p_0\) for binary charts. The baseline hazard (and coefficient vector) is usually estimated by fitting a Cox model on all hospitals together, thereby recovering an “average” performance measure. As we are only interested in following a patient during their participation in the study, we consider the risk indicator \(Y_i(t)\) which is one if a patient is at risk of failure at time t and zero otherwise. A patient is not at risk of failure when they have not entered the study yet, or after they have failed or their observation has been censored. To keep track of the number of failures at a hospital in real time, we introduce a counting process N(t), which is equal to the number of failures at a hospital at time t after the start of the study. As for the binary outcomes, survival outcomes can also be right-censored. In our case we again consider censored observations as having a desirable outcome at the censoring time, but other assumptions are also possible.
There are many advantages to the use of survival outcomes instead of binary outcomes. First of all, the binary charts required a choice for an outcome threshold (i.e. 90 days) whereas for survival outcomes this is no longer necessary. The absence of such an (arbitrary) choice therefore no longer impacts the resulting conclusions, making the use of survival charts consistent. This is a major advantage, especially when there is no clear motivation for the choice of a threshold. Additionally, the survival outcome holds the most recent information about the status of a patient at any point in time, possibly leading to quicker detections. The disadvantages of using survival outcomes primarily relate to practical considerations. The registration of survival outcomes requires a continuous follow up of patients, which is often not feasible for long periods after the initial procedure. For this reason, times to event may only be known exactly in a fixed period after surgery, as is the case for postoperative survival in the DCRA data. The duration of stay is known exactly for each patient.
In the following two sections we describe two control charts that use survival outcomes, with the goal to detect an increase in the failure rate at a single hospital during the study period.
2.3.1 BK-CUSUMThe Biswas & Kalbfleisch CUSUM (Biswas and Kalbfleisch 2008) (BK-CUSUM) is a control chart for survival outcomes, used to test for a change in the failure rate of a process. This chart can be seen as the survival analogue of the binary CUSUM in Section “Binary CUSUM”. The BK-CUSUM however is used to test slightly different hypotheses. Where the binary CUSUM was used to test for an increase in failure rate starting from a chronological patient \(\nu \ge 1\), the BK-CUSUM is used to test for a sudden change in the failure rate of all patients in the study at some time \(s \ge 0\) after the start of the study. This sudden change is then described by an increase in the baseline hazard rate from \(h_0(t)\) to \(h_0(t) \exp ( \theta )\), with \(\exp (\theta )\) called the hazard ratio. The hazard ratio can be seen as an analogue of the Odds Ratio in binary CUSUM charts. It has to be chosen in advance, with a wrong choice potentially leading to delayed and/or false detections (Gomon et al. 2022). To facilitate testing the described hypotheses, we consider a time-constrained counting process \(N(s, t) = N(t) - N(s)\) for \(t \ge s\), which keeps track of the failures at a hospital between times s and t.
The BK-CUSUM is given by:
$$\begin BK(t) = \max _ \, \end$$
(4)
where \(\Lambda (s, t) = \sum _^ \int _s^t Y_i(u) h_i(u) du\) is the accumulated cumulative hazard at a hospital between times s and t. Heuristically, the accumulated cumulative hazard indicates how much risk was built up by patients present at a specific hospital between times s and t. Note that the value of the BK-CUSUM will increase by \(\theta\) any time a failure is observed and drift downwards at all other time points, with the downward slope depending on the current amount of patients at the hospital and their risk of failure. Even though the BK-CUSUM does not have an explicit cut-off at zero, the maximisation term implicitly stops the value of the chart dropping below zero. As with the binary CUSUM, the value of the BK-CUSUM is plotted against study time and a signal is produced when the value exceeds a pre-defined control limit h.
In parallel to the binary CUSUM, the choice of a hazard rate \(e^\theta\) complicates the use of the BK-CUSUM, as it is usually not known in advance what the increase in hazard rate will be at sub-optimally performing hospitals. (Biswas and Kalbfleisch 2008) chose to use a value of \(e^\theta = 2\), corresponding to the use of \(OR = 2\) in binary CUSUM charts. Even though this choice seems to be commonplace (Gomon et al. 2022; Steiner et al. 2000; Biswas and Kalbfleisch 2008), there is no guarantee that an OR equal to 2 will perform well in real life applications.
2.3.2 CGR-CUSUMThe Continuous time Generalised Rapid response CUSUM (Gomon et al. 2022) (CGR-CUSUM) is a control chart for survival outcomes, similar to the BK-CUSUM. There are two key differences between the CGR- and BK-CUSUM. First of all, the CGR-CUSUM can be used to test the continuous time alternative to the discrete time hypotheses considered for the binary CUSUM: the detection of a change in failure rate starting from some chronological patient \(\nu \ge 1\), ignoring the information of all patients before this patient. The BK-CUSUM can be used to test for a change point in time, considering the information of all patients still in the study. Secondly, the CGR-CUSUM is also used to test for a sudden increase of \(\exp (\theta )\) in the baseline hazard rate, but \(\theta\) is determined “automatically” using a maximum likelihood estimator. Suppose at time \(t > 0\) after the start of the study, n patients have been treated at a specific hospital. The CGR-CUSUM chart is then given by:
$$\begin CGR(t)&= \max _ \left\}_ N_(t) - \left( e^}(t)} - 1 \right) \Lambda _(t) \right\} , \end$$
(5)
where \(N_(t)\) counts the number of failures at time t after the entry of patient \(\nu\) and \(\Lambda _(t) = \sum _ \int _0^t Y_i(u) h_i(u) du\) is the accumulated cumulative hazard rate of those patients. The maximum likelihood estimator is then given by:
$$\begin }(t) = \max \left( 0, \ln \left( \frac(t)}(t)} \right) \right) . \end$$
Details on the calculation of the CGR-CUSUM are described in Appendix A. Similarly to the BK-CUSUM, the CGR-CUSUM will jump up at any observed failure and drift downwards when no failures are observed. There is also an implicit cut-off at zero due to the maximisation term. In contrast, the CGR-CUSUM no longer makes upwards jumps of fixed size due to the updating maximum likelihood estimate \(}(t)\). This estimate becomes large when recent patients fail rapidly compared to their accumulated cumulative hazard, and small when failures happen infrequently. The maximum likelihood estimate provides an indication on how the recent failure rate at a hospital compares to the baseline failure rate (usually the average over all hospitals). The value of the CGR-CUSUM is plotted against study time and a signal is produced when the value of a control limit h is exceeded.
The value of the maximum likelihood estimator \(}(t)\) can become very unstable, especially when some patients fail very quickly after their study entry. For this reason, (Gomon et al. 2022) chose to limit the value of the estimator between \(0 \le e^}(t)} \le 6\), thereby aiming to detect an increase in the hazard rate of by at most a factor 6. While the difference between the hypotheses concerning the increase in a failure rate from a specific patient in the CGR-CUSUM and a change at some point in time for the BK-CUSUM may seem trivial, it changes the considered problem significantly. The CGR-CUSUM assumes that at some point in time all future patients will have an increased probability of failure, whereas the BK-CUSUM assumes that at a certain point in time all current and future patients have an increased failure probability.
2.4 Control limitsEven though CUSUM charts give a visual representation of a hospital’s performance, we require a practical method to determine when a change in quality should be signalled. This is achieved using a control limit, a numeric value indicating when the value of a chart has become too large. A CUSUM chart is constructed until the time when its value exceeds the control limit, signalling a change in the failure rate at that specific hospital.
A natural question that arises is how this control limit should be chosen. Two approaches are commonly used: either the expected time until detection or the probability of wrongfully detecting an in-control hospital during the study period is restricted. For a single CUSUM chart, define the run length as the time since the start of the study until the first detection. The first approach chooses a control limit such that the expected run length of an in-control hospital is restricted to some suitable quantity. Using the second approach, the control limit is chosen such that an arbitrary in-control hospital has at most probability \(\alpha\) to be detected during the study period. In other words, the type I error probability is restricted over a certain time period. To the best of our knowledge, for both approaches no algebraic results for determining control limits for risk-adjusted survival CUSUM charts are available. For this reason, Monte Carlo simulation methods are usually employed to determine a control limit.
A commonly overlooked problem for CUSUM charts is that hospitals can differ in the number of patients treated during the study period. (Gomon et al. 2022) have shown that this difference warrants the use of control limits varying depending on the volume of patients treated at a hospital. Mathematically we model the number of patients treated at a specific hospital by using a Poisson process with rate \(\psi\). For each hospital we therefore estimate a Poisson arrival rate \(}\) using the Poisson maximum likelihood estimator and determine a hospital specific control limit for this rate. The estimated rate \(}\) can be seen as the expected number of people to be treated at a hospital per time unit (e.g. per day).
We choose a simulation approach to determine hospital specific control limits. Suppose we want to estimate the control limit associated with an estimated arrival rate of \(}_j\) for hospital j over a study period of length T. We fit a Cox model on all available data (all hospitals):
$$\begin h_i(t) = h_0(t) e^^\top \varvec_i} \end$$
to obtain an estimate for the baseline hazard \(\widehat(t)\) and regression coefficients \(\widehat}\). N dummy hospitals are then generated by bootstrapping patient characteristics from the full data set, with the amount of patients at each simulated hospital determined by independently sampling from a Poisson process with rate \(}_j\). Survival times are then generated using the inverse transform method described in Bender et al. (2005). CUSUM charts are then constructed over the study duration T for each hospital in the dummy data set and a value for the control limit is chosen such that at most a proportion \(\alpha\) of the simulated hospitals is signalled using this value. This is the empirical analogue of choosing a type I error rate of \(\alpha\) over a study duration of T.
To compensate for variance in the simulation procedure we propose to determine control limits for hospitals with different arrival rates \(\psi\) and fit monotone cubic regression splines (see Section 5.3.1 of Wood (2017)) on the determined control limits. We can then use the smoothed values as control limits instead, see Fig. 4 for an example. The reason for fitting monotone functions on the estimated control limits stems from Gomon et al. (2022), who showed that a variant of the CGR-CUSUM is asymptotically normally distributed with variance increasing with the arrival rate \(\psi\). Heuristically this means that in-control hospitals treating a larger number of patients are more likely to be detected than hospitals treating fewer patients over a fixed study period.
2.5 Lower CUSUMFor certain studies, detecting a decrease in the failure rate may be of greater interest than an increase. The goal would then be to detect hospitals performing better than what is deemed to be on target. This is easily achieved by choosing a value of \(\exp (\theta ) < 1\) for the binary and BK-CUSUM in Eqs. (2) and (4). For the CGR-CUSUM this is achieved by restricting the maximum likelihood \(\frac \le \exp (}(t)) \le 0\) in Eq. (5). Page (1954) suggested a procedure where we test for both an increase and decrease in the failure rate at the same time by plotting the two procedures in a single plot, with (usually) the CUSUM for a decrease in failure rate facing downwards. This is often called a two-sided CUSUM procedure, with one upper and one lower CUSUM chart. We will adhere to the usual naming convention by referring to CUSUMs for an increase/decrease in failure rate as upper and lower CUSUM charts respectively.
The lower CUSUM procedure solves the problem discussed in section “Survival charts”, which is that a discharge from a hospital is not usually regarded as “failure”. We are indeed interested in detecting a decrease in the discharge rate at hospitals and will therefore construct lower CUSUM charts for this outcome.
留言 (0)