
記住我
Infections contracted in hospitals or healthcare-associated infections (HAI) raise morbidity and mortality dramatically, particularly in underdeveloped countries.[1] They cause a significant emotional impact among family members as well as patients and increase the length of hospital stay, and escalate the cost of healthcare expenditure[2,3] Hand hygiene, a lack of trained personnel for infection control and prevention, a lack of accessibility or knowledge on the proper use of personal protective equipment (PPE), inadequate biomedical waste management policies and perception, widespread antimicrobial agent misuse, and other factors contribute to an increase in the HAI rate.[4]
Ventilator-associated pneumonia (VAP) is one of the most prevalent HAIs among critically ill patients on mechanical ventilation.[3] VAP has been defined as lung parenchyma infection in a patient who has been on invasive mechanical ventilation for more than 2 calendar days.[5,6] The prevalence of VAP ranges from 6% to 52%, with some cases reaching 76%. The probability of developing VAP in intensive care patients is estimated to be 3%/day for the first 5 days of mechanical breathing, 2%/day for the next 5–10 days, and 1%/day after that.[7] Even with further clinical criteria revisions, the diagnostic criteria for VAP remain contentious. The current surveillance study aimed to document the incidence, patient distribution, bacteriological profile, and antibiotic susceptibility pattern of patients who developed VAP during the study period using guidelines from the Centers for Disease Control and Prevention-National Healthcare Safety Network (CDC NHSN).[8]
MATERIAL AND METHODSThis prospective study was conducted between January 2016 and December 2019 from a tertiary care hospital, in Puducherry. Since this is an audit-based study for quality improvement, sample size estimation was not done. A universal sampling method was adopted to include all eligible study candidates over a period of 4 years as per protocol. All adult patients (>18 years) admitted in the critical care unit (CCU) requiring mechanical ventilator support for more than 2 calendar days were recruited in this study. The Institute Human Ethical Committee clearance was obtained (IHEC – MGMCRI Faculty – 2014–40). Those patients who were intubated/mechanically ventilated outside this hospital and patients with evidence of respiratory tract infection before intubation/within 2 days of admission, patients who expired, if they developed pneumonia within 48 hours or those who were admitted with pneumonia at the time of admission and patients population with acute respiratory distress syndrome were excluded from the study. Patients’ demographic details, date of CCU admission, indication for ventilation, date of respiratory samples sent for culture, and susceptibility testing reports were recorded.
The study duration was divided into two phases, that is, phase 1: (2016–2017) before intervention and phase 2: (2018–2019) after intervention. During both phases, ventilator settings, mode, alterations in the settings, patients’ daily vitals, oxygen saturation, the addition of new antibiotics, and respiratory secretions culture reports were monitored regularly. Based on the CDC ventilator-associated event (VAE) surveillance criteria, the diagnosis of VAP was made. The three-tier indicators are as follows: Ventilator-associated complications (VACs), infection-related ventilator-associated complications (IVAC), and possible/probable VAP. The first step of VAE is VAC which will identify any complication occurring in mechanically ventilated patients regardless of the origin or mechanism. To fulfill VAC criteria, a mechanically ventilated patient must have at least 2 days of stability or improvement of respiratory parameters such as a stable or decreasing daily minimum positive end-expiratory pressure (PEEP) or fraction of inspired oxygen (FiO2) followed by at least 2 days of worsened oxygenation diagnosed by an increase of the daily minimum PEEP (at least 3 cm H2O) or FiO2 (at least 20%). The second criteria IVAC aims to confirm the subgroup of VAC that is potentially related to infection-related complications. VAC associated with an abnormal white blood cell count, altered/modified temperature, with initiation of new antimicrobial agent continued for at least 4 days becomes an IVAC. In addition on or after calendar day 3 of the mechanical ventilator, positive culture from any of the CDC-recommended respiratory samples with significant quantitative or semiquantitative growth, and purulent respiratory secretions with organisms identified from respiratory specimens confirm VAP.
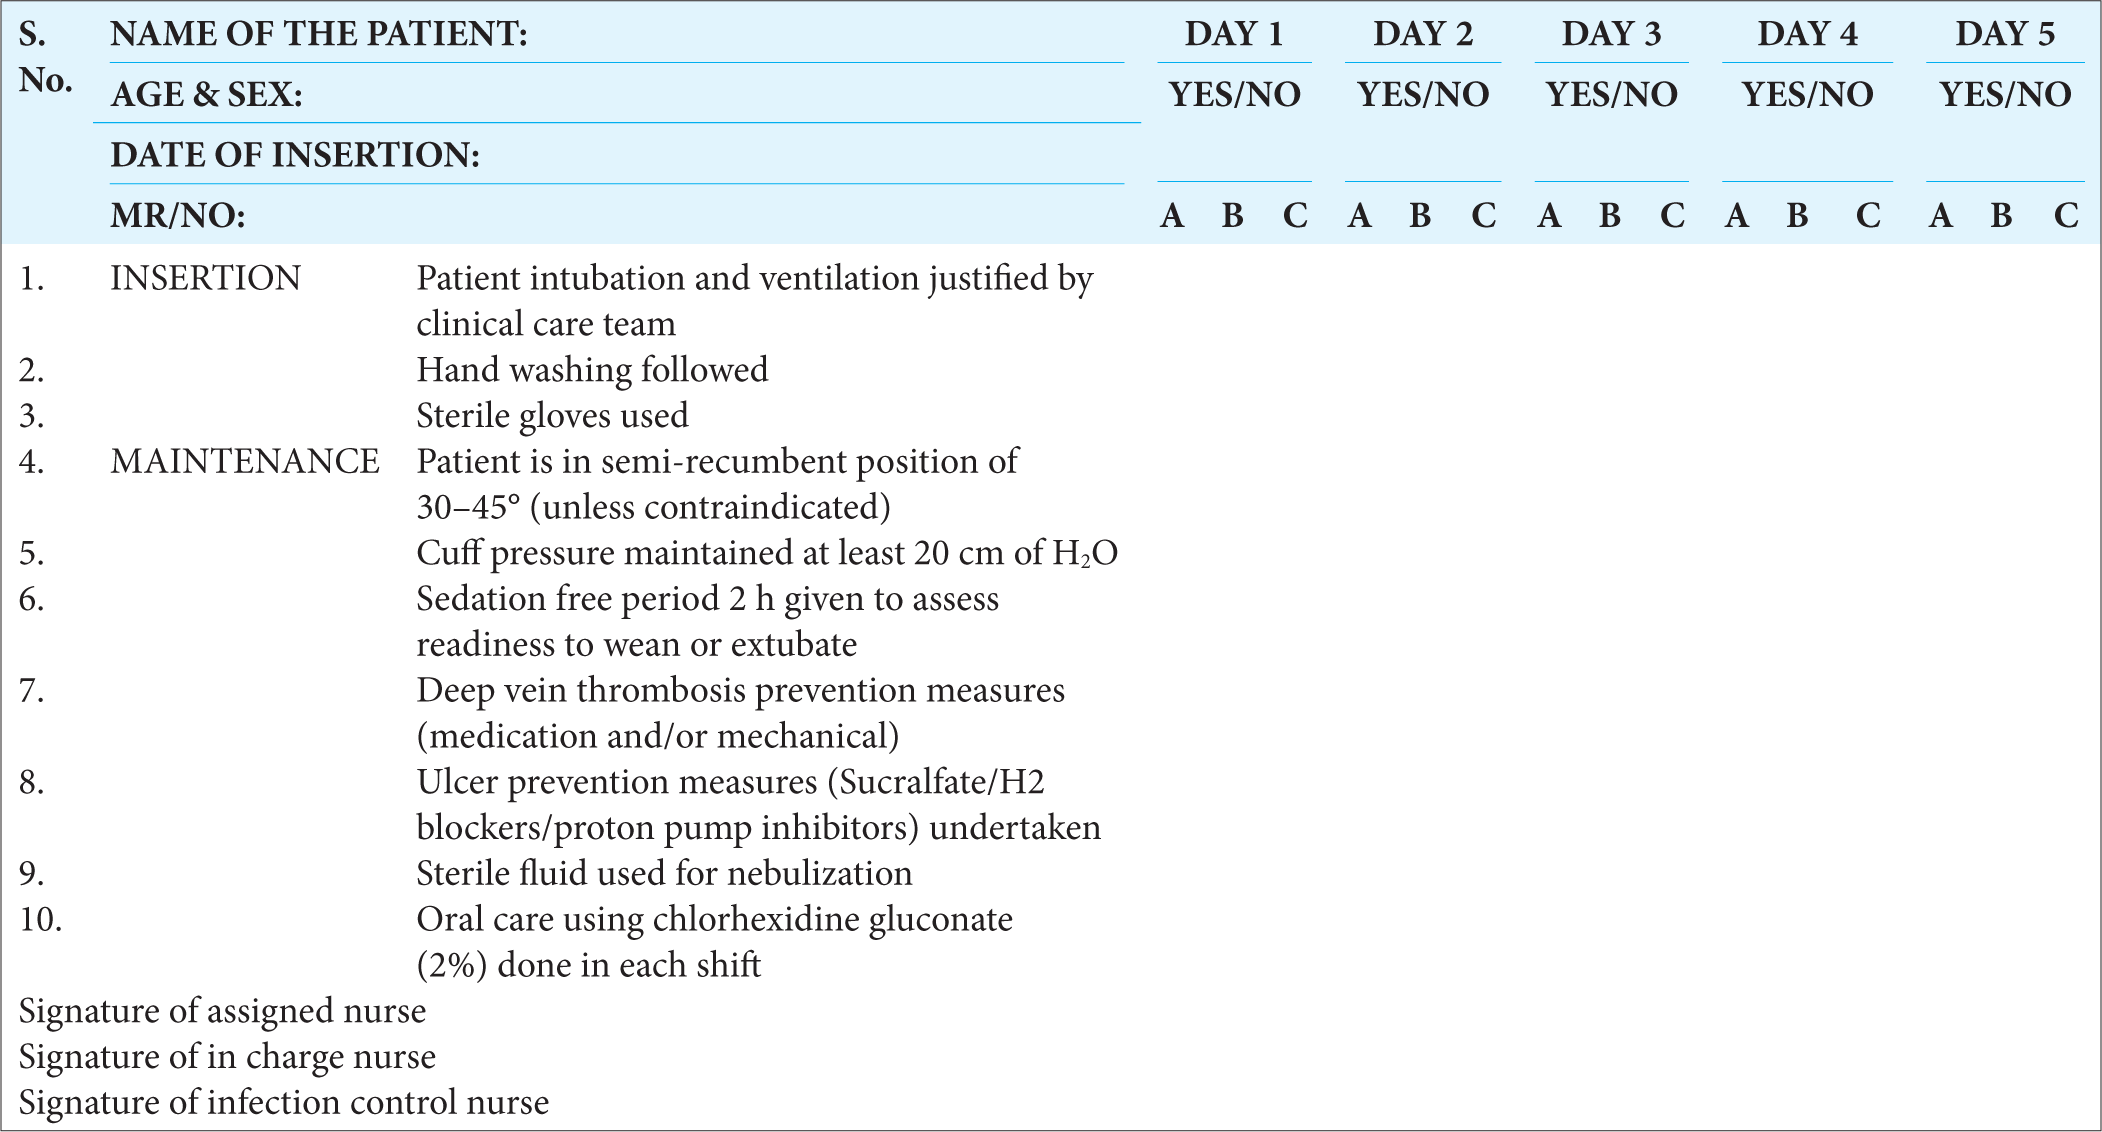
In Phase 2: Unlike Phase 1, interventions include targeted continuous surveillance which aims to monitor high-risk populations and their infection sites. Regular monitoring of all healthcare workers toward their hand hygiene practices, appropriate use of gloves, and insertion/maintenance care bundle approach by trained staff in-charge with checklist got implemented [Chart 1]. Based on the observation, regular educational sessions and workplace monitoring of their compliance were documented. Regular instrumental and environmental cleaning under supervision was insisted upon. For all new staff, regular induction sessions on standard precaution, infection control measures, and ventilator care bundle approach were re-emphasized. Daily auditing, reassessment, and reauditing with feedback discussions were introduced. Based on the culture reports, isolation, and contact precaution policies were strictly implemented.[9-11]
Export to PPT
Statistical analysisAudited data was captured in Excel sheets for analysis. A comparison of isolated bacteria and their combination was done using frequency and percentage due to the few number of isolates. Percentage calculation was done for all categorical variables.
RESULTSFrom January 2016 to December 2019, a total of 2086 patients were treated in the CCU. A total of 1220 (58.5%) patients got intubated and were provided with mechanical ventilator support, with an average of 3–4 adult patients on ventilator support per day. A total of 5922 ventilator days were recorded out of 1220 critically ill patients on mechanical ventilator support. A total of 49 (4%) patients developed VAP during this 4 years study period [Table 1]. The cumulative incidence rate of VAP was found to be 8.3/1000 ventilator days (Number of patients who developed VAP/total number of ventilator days for the month × 1000).
Table 1: Distribution of patients.
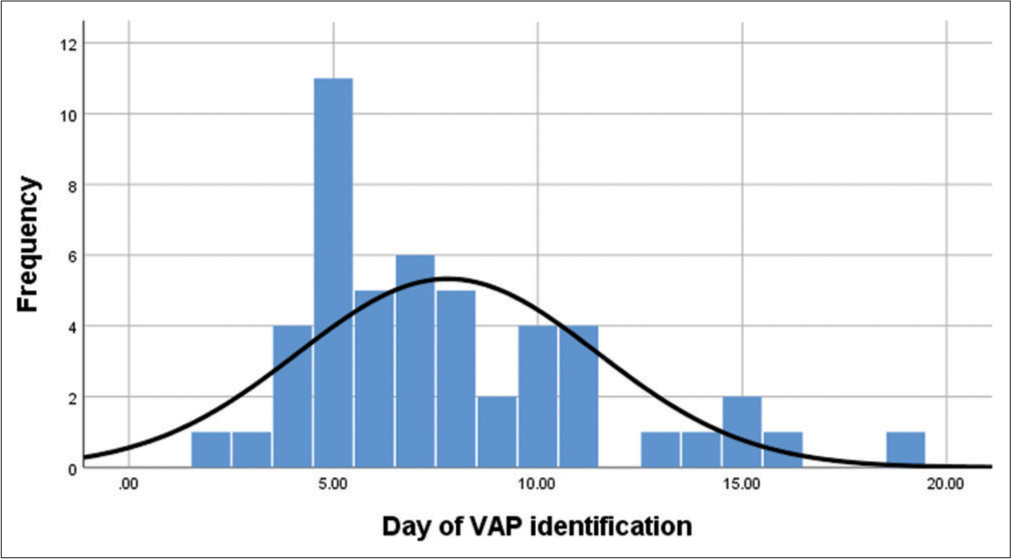
Before intervention After intervention 2016 2017 2018 2019 Total number of patients treated in intensive care unit (n=2086) 460 500 596 530 Total number of patients on ventilator support (n=1220) 253 (55%) 317 (63%) 313 (53%) 337 (64%) Total number of Ventilator days 1494 1708 1334 1386 Total number of patients who developed VAP (n=49) 16 (6.3%) 18 (5.6%) 13 (4.2%) 2 (0.6%) Incidence of VAP 10.7 10.5 9.7 1.4During phase 1: (2016–2017) study period, the incidence of VAP was 10.7 and 10.5/1000 ventilator days without interventions. Following intervention and auditing in phase 2 the incidence of VAP was 9.7 VAP/1000 ventilator days in 2018. Further, in the implementation period (2019), the incidence of VAP was significantly reduced to 1.4 VAP/1000 ventilator days. The average ventilator day support for each patient before the onset of VAP was found to be between 5 and 9 days post-intubation [Graph 1].
Export to PPT
Patients betweens 51–66 years were found to be in higher risk groups than other age groups for developing VAP in this study [Table 2]. In addition, the male gender (67%) was found to have higher risk of developing VAP than females (33%). The age group division was done according to the institute’s experience and the flow of patients.
Table 2: Age distribution of patients between Phase 1 and Phase 2.
Age distribution Before inervention After intervention 2016 2017 n=34 (%) 2018 2019 n=15 (%) 19–34 years 3 3 6 (17.5) 1 0 1 (6.6) 35–50 years 4 1 5 (14.7) 2 1 3 (20) 51–66 years 7 11 18 (53) 3 1 4 (26.6) ≥ 67 years of age 2 3 5 (14.7) 7 0 7 (46.6)Based on the endotracheal (ET) aspirate culture reports, Gram-negative bacilli (GNB) were found to be the most common pathogen isolated. Among GNB’s, Klebsiella pneumoniae was found to be the most common isolates, followed by Pseudomonas aeruginosa, Acinetobacter baumannii, and others [Table 3].
Table 3: Yearly distribution of bacterial isolates.
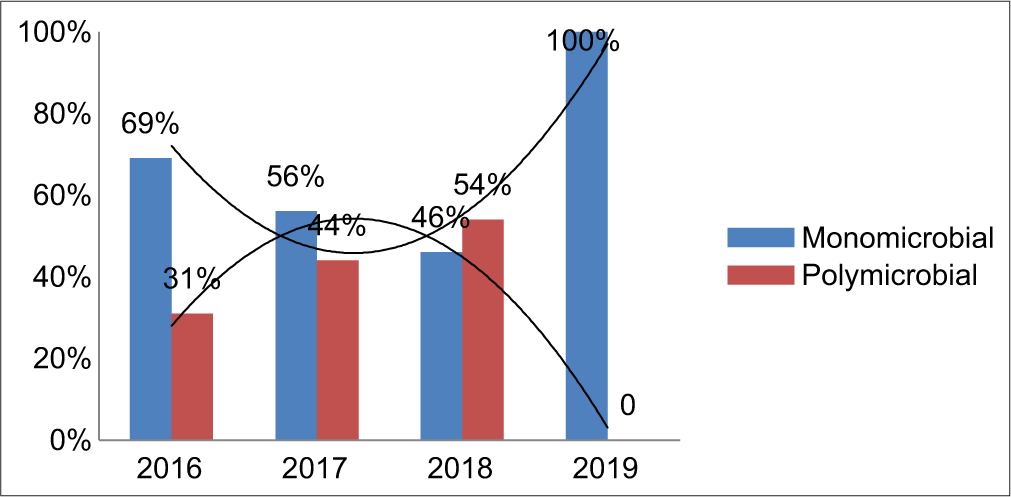
Organisms isolated Before intervention After intervention 2016 2017 n=49 (%) 2018 2019 n=28 (%) Klebsiella pneumoniae 3 12 15 (31) 6 1 7 (25) Enterobacter aerogenes 0 2 2 (4) 3 0 3 (11) Citrobacter freundii 1 0 1 (2) 0 0 0 Escherichia coli 0 0 0 1 0 1 (3.5) Acinetobacter baumannii 8 10 18 (37) 8 1 9 (32) Pseudomonas aeruginosa 7 4 11 (22) 8 0 8 (28.5) MSSA 1 0 1 (2) 0 0 0 MRSA 1 0 1 (2) 0 0 0The individual bacterial isolates showed a gradual decrease in the trend over the study period, especially in the case of K. pneumoniae, P. aeruginosa, and A. baumannii [Table 3]. Out of a total of 49 culture-positive ET samples, 20 samples grew polymicrobial isolates. K. pneumoniae + P. aeruginosa (35%) was found to be the most common polymicrobial combination among these patients, followed by A. baumannii + P. aeruginosa, Enterobacter aerogenes + K. pneumoniae, E. aerogenes + A. baumannii combination of 10% each, and then others [Table 4]. Following intervention, the trend of polymicrobial isolation rate was found to be gradually decreasing. With the remaining 29 ET samples, the monomicrobial infection rate was documented [Graph 2].
Table 4: Yearly distribution of bacterial combinations. Before intervention After intervention Total
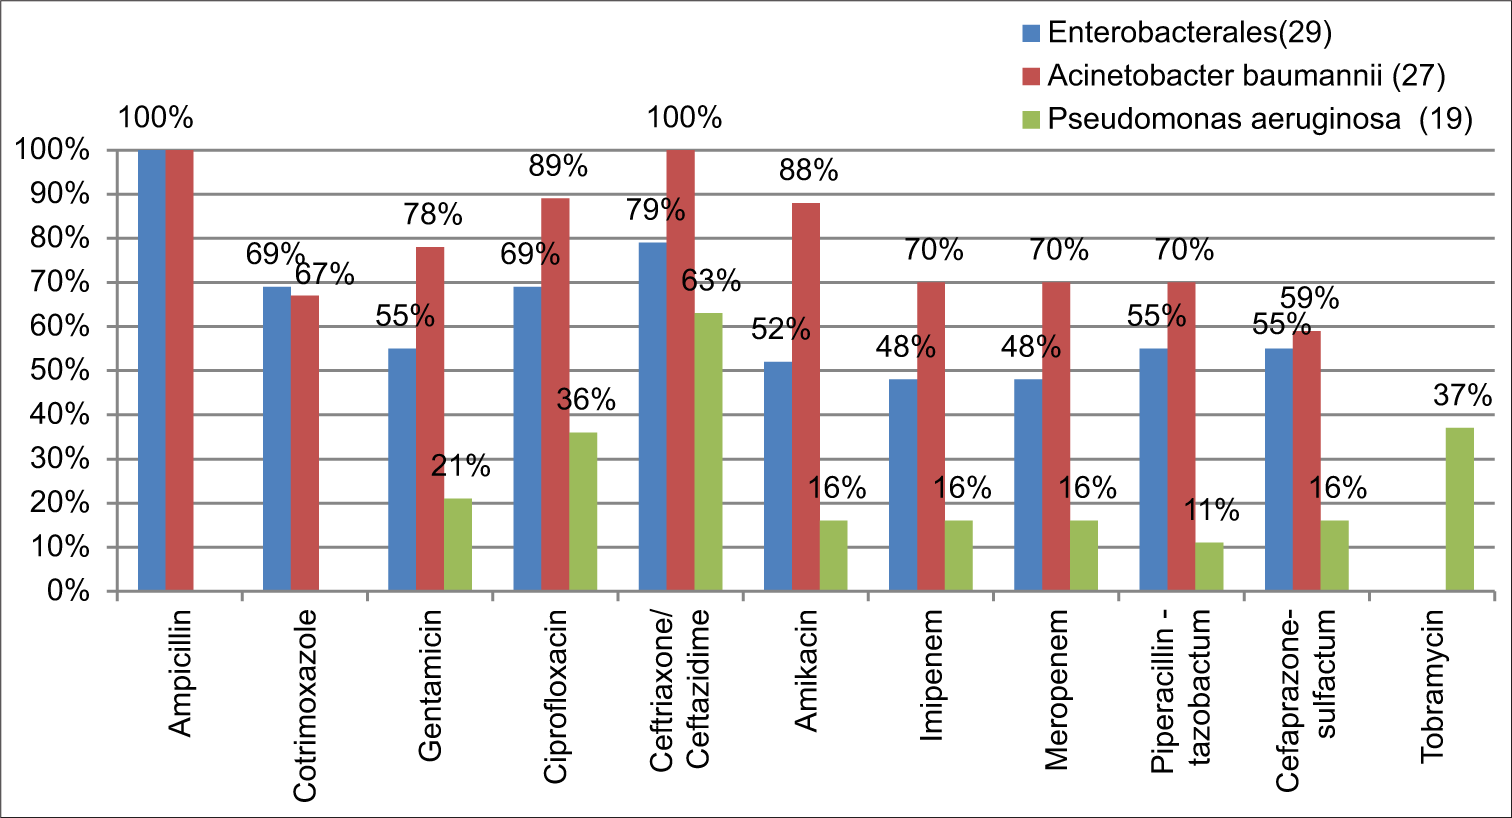
Before intervention After intervention Total 2016 2017 2018 2019 K. pneumoniae+P. aeruginosa 2 3 2 0 7 E. aerogenes+A. baumannii 0 2 1 0 3 A. baumannii+MRSA 1 0 0 0 1 E. aerogenes+P. aeruginosa 0 0 1 0 1 A. baumannii+P. aeruginosa 1 1 1 0 3 K. pneumoniae+A. baumannii 0 1 1 0 2 A. baumannii+MSSA 1 0 0 0 1 E. aerogenes+K. pneumoniae 0 1 1 0 2 Total 5 8 7 0 20The bacterial isolates in each year were not statistically significant to analyze its resistance pattern individually. Collectively, these isolates showed an increasing trend in its resistance pattern [Graph 2]. The majority of GNB (57%) were found to be multi drug resistant (MDR) isolates. Out of 29 Enterobacterales, 79% (23) were found to be resistant to third-generation cephalosporin and 69% (20) were resistant to fluoroquinolone and cotrimoxazole, followed by 55% (16) resistance to beta-lactam-beta-lactamase inhibitors. A. baumannii showed 100% resistance on ampicillin and ceftriaxone. Moreover, toward gentamicin 78%, amikacin 88%, and on carbapenems and piperacillin-tazobactam 70% resistance was documented followed by others. P. aeruginosa showed 63% resistance on ceftazidime, 36% on ciprofloxacin, 21% toward gentamicin, and others [Graph 3]. During the 4year study period only Staphylococcus aureus (2) got isolated in 2016. This, one was identified as MRSA and it was susceptible to most of the drugs tested. Both the isolates were 100% resistant to penicillin and 50% resistant to gentamicin, and ciprofloxacin, and 100% susceptible to clindamycin, tetracycline, erythromycin, cotrimoxazole, vancomycin, teicoplanin, and linezolid.
Export to PPT
Export to PPT
DISCUSSIONHealthcare-acquired infections (HAIs) occur as a result of compromised hand hygiene practices, aseptic medical device insertion technique, prolonged hospitalization, inadequate interventions, and inappropriate antimicrobial usage.[12] According to the WHO, over 1.4 million people worldwide suffer at a time from infectious complications following HAI.[8] Among patients with invasive mechanical ventilation, VAP is one of the most common HAIs. VAP is defined as the infection of the pulmonary parenchyma in patients exposed to invasive mechanical ventilation for a minimum of 48 hours. During the past few decades, especially in developed countries, adequate and effective HAI control programs are being implemented. Instead, due to a lack of awareness and ineffective implementable policies, the incidence of VAP remains peaking in developing countries. In addition, there is no adequate comparative data among developing countries to self-validate the safe health-care delivery system and infection prevention. VAP is one of the leading causes of high mortality among critically ill patients throughout the globe.[13]
In the present performance improvement study, the VAP rate was significantly high in 2016 and 2017. Internal benchmark value was derived using the previous year’s VAP incidence rate. Fixing the internal benchmark value as 6 VAP/1000 ventilator days, in phase 2: various interventions such as continuous active surveillance and infection prevention measures targeting all high dependent areas were introduced. Probable route cause analyses were made for individual VAP patients. Corrective and preventive measures such as regular educational sessions for all healthcare workers on VAP prevention, care bundle monitoring, contact precaution, and regular hand hygiene practices played a pivotal role in bringing the VAP incidence to 1.4 VAP/1000 ventilator days during 2019 [Table 1]. Very similar to this, according to the International Nosocomial Infection Control Consortium, CDC report, between 2007 and 2012 involving 43 countries in a device-associated module, the overall rate of VAP/1000 mechanical ventilator days was 14.7 and 9.54 in adult and pediatric intensive care units, repectively.[14,15] The pooled VAP data of 40 hospitals from 20 cities in India (10 years of data) state that the incidence was 9.4.[16] The CDC NHSN data of 2013 state a VAP rate of 2.0/1000 device days.[14] In contrast, a recent study from China documented (2012–2019) 22.68 VAP/1000 device days.[17] Similarly, a study by Deepashree et al., from Puducherry, India during 2015-2016, documented a VAP rate of 25/1000 device days.[18]
In general, based on the duration, the early-onset VAP (less than the initial 5 days of hospitalization and intubation) and late on-set VAP (after 5 days of hospitalization and intubation) clinical diagnosis will be made.[19] A recent Cochrane review (2023) reported a high incidence of late-onset VAP.[20] Similarly, the majority of the VAP documented during these 4 years were found to be late-onset VAP (>96 h). With increasing age between 51 and 66 years, the incidence of VAP was found to be significant along with male gender predominance.[17]
Among the pathogens, gram-negative organisms were found to be the common cause of VAP followed by Gram-positive organisms.[17,21,22] Similar to this present study, a study by Gragueb-Chatti et al., in 2021, documented K. pneumoniae as the most common pathogen and among all the nonfermenter, A. baumanniiand, P. aeruginosa, was found to be the predominant pathogen.[23] In contrast, a recent study from India and China (2023) documents, A. baumannii as the most common pathogen to develop VAP, followed by K. pneumoniae and P. aeruginosa.[17,24] Similar to other studies, 79% of Enterobacterales and 100% of A. baumannii were found to be resistant to third-generation cephalosporin.[25] About 48% of Enterobacterales, 70% of A. baumannii, and 16% of P. aeruginosa were found to be Carbapenemase producers. Similar to the present study, few studies says that MDR isolates of P. aeruginosa are increasingly prevalent among VAP patients and also reported that one-half to two-thirds of A. baumannii strains causing VAP are currently found to be Carbapenem-resistant.[26] These isolates were also found to carry blaOXA-23 encoding genes followed by blaOXA-66 in India.[24] The incidence of MRSA in causing VAP is in the decline phase and ths might be due to stringent infection control and preventive measures.
Fortunately, over a period of time due to multidimensional approaches such as close monitoring, strict hand hygiene practices, staff training, assessment, feedback review, proper use of PPEs, and care bundle approach, the trend of organisms showed a decline (bell-shaped curve) pattern. During 2019, when compared to previous years, the microbial combination also changed from polymicrobial to monomicrobial cause. This could be due to improved environmental disinfection processes, barrier nursing, isolation precautions, and other infection control measures with the care bundle approach [Chart 1].[26,27]
CONCLUSIONThe incidence of late-onset VAP was found to be higher than early-onset VAP. Males aged 51–66 were found to be in higher risk groups in this setup. Gram negatives, especially K. pneumoniae, P. aeruginosa, and A. baumannii were found to be the most common bacterial pathogenss with the significant resistant pattern. The duration of the mechanical ventilation needs to be reduced by administering proper weaning protocol and titrating the sedation regimens. With proper nursing care, strict hand hygiene, barrier nursing, antibiotic policy, precise diagnostic tools, proactive surveillance networking, and VAP care bundle approach, the burden of VAP can be kept within the benchmark value depending on the individual healthcare setup.
留言 (0)