
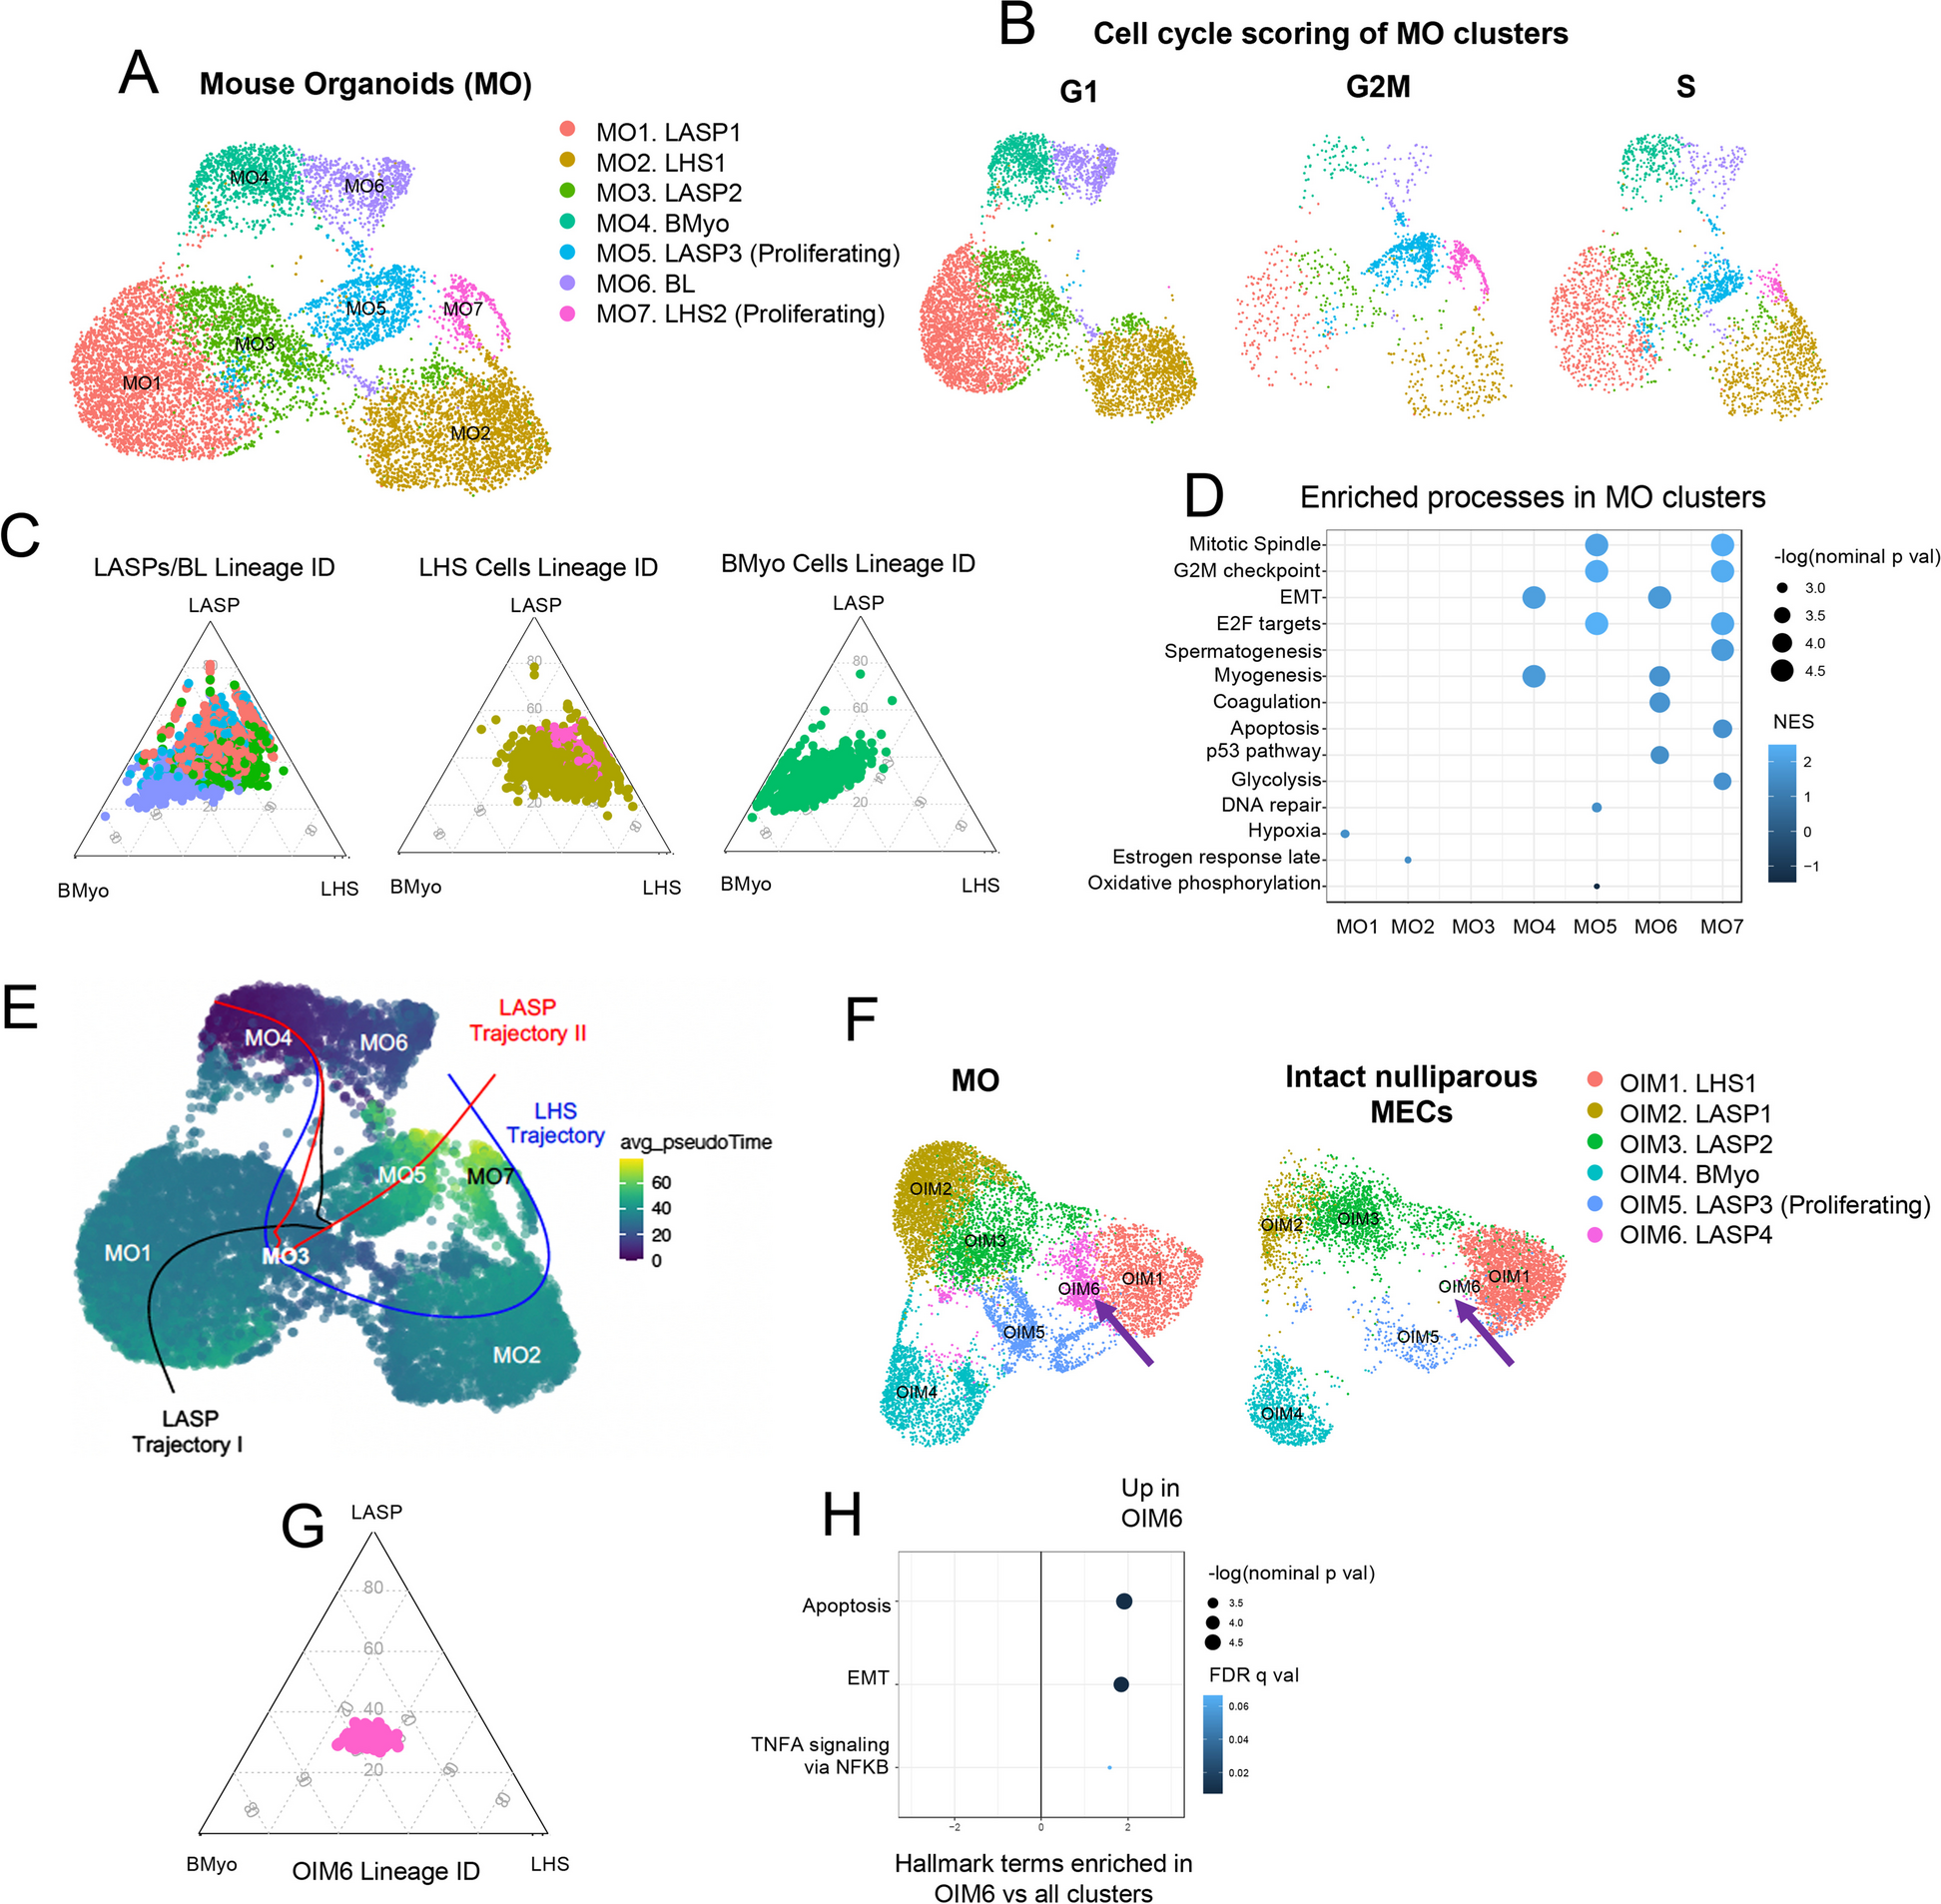
記住我


To investigate the effect of HFD on lymphatic function in the mammary gland, we measured lymphatic pulsing using NIRF in nulliparous mice started on HFD or LFD at 3 weeks of age. The average weight of the mice at the time of the first imaging in the LFD group was 21.3 g and that in the HFD group was 26.8 g (P = 0.005). Representative ventral NIRF images in the LFD and HFD groups are shown in Fig. 1A [for the LFD group] and Fig. 1B [for the HFD group]. At week 8, the lymphatic pulsing activity was significantly increased in the ventral and right dermal lymphatic vessels in the HFD mice Fig. 1C P < 0.001 ventral, HFD vs LFD; and P = 0.01 right, HFD vs LFD). At week 11, the lymphatic pulsing activity was significantly increased in the right and left dermal lymphatic vessels in the HFD mice (Fig. 1D, P = 0.01 for both). At week 14, no lymphatic pulsing was observed on the left or right; however, ventral lymphatic pulsing was increased significantly in the HFD mice at that time (Fig. 1E, P < 0.001 vs LFD). The lymphatic pulsing activity increased significantly in the HFD group at each time point. Average ventral lymphatic contractile frequency for LFD and HFD at 8, 11, and 14 weeks were (LFD) 1.25, 2.16, and 3.97 pumps/min vs (HFD) 2.94, 4.63, and 7.06 pumps/min (Fig. 1F).
Fig. 1
High-fat diet increases mammary lymphatic pulsing relative to a low-fat diet in nulliparous mice. NIRF imaging. All mice had two ventral, two left and two right measurements, N = 5 per group, however one mouse in each group died prior to imaging. A, B Representative in vivo near-infrared fluorescence (NIRF) images of ventral dermal lymphatic vessels above mammary gland #4 and #9 after subdermal injection of indocyanin green in mice fed a low-fat diet (LFD, A) or a high-fat diet (HFD, B). C Lymphatic contractile rate by diet at week 8, (D) week 11, (E) week 14 only ventral pulsing detected. F Lymphatic contractile activity over time
Next, to investigate the synergistic effects of HFD and lactation/weaning time on dermal lymphatic pulsing activity, multiparous mice that had been fed either the HFD or LFD were abruptly (forced) weaned or naturally (nursed) weaned (Fig. 2). Imaging included only the ventral lymphatics in these mice. The initial NIRF imaging occurred at 6 months of age but was interrupted/incomplete due to the COVID-19 pandemic; it was completed after the shut-down, compromising the data point, and thus was repeated a single imaging session baseline at 14 months. Mice were maintained on the diets without interruption during this time. In multiparous mice, lymphatic pulsing before tumor inoculation in HFD force-weaned (HF FW) and HFD nurse-weaned (HF NW) animals was increased compared to LF FW and LF NW (Fig. 2A, P < 0.001 and P = 0.01); whether mice were allowed to wean did not affect lymphatic pulsing activity in these mice (Fig. 2A, P = not significant [NS]).
Fig. 2
HFD increases lymphatic pulsing from mammary gland–draining lymphatics in multiparous mice to a degree similar to that induced by tumor initiation. A Lymphatic pulsing by diet and weaning status (N = 5 animals per group, fewer than five points reflects animal loss prior to imaging), at 6–7 months and 14 months. (B) Lymphatic pulsing pre and post tumor inoculation and growth
High-fat diet significantly increased IBC (SUM149) tumor growth in multiparous miceTo determine how risk factor–primed microenvironments influenced tumor growth, lymphatic activity, and vasculature after the orthotopic inoculation of SUM149 tumor cells into the #4 mammary gland fat pad of these mice, post-tumor-inoculation NIRF lymphatic pulsing images were obtained at 16 months (~ 8 weeks after tumor initiation). At 16 months, the presence of tumor was associated with significantly increased dermal lymphatic pulsing activity compared with the baseline (pretumor) pulsing activity in LFD groups, independent of weaning status (Fig. 2B), whereas HFD groups had already achieved virtually the same degree of increase before tumor initiation. Neither diet (Fig. 3A) nor weaning status (not shown) affected the percent of mice with tumors. In addition, IBC-like skin symptoms, scored as hair loss with bleeding or skin blisters and evident tumor growth into the skin, was present in 13 of the 14 mice in which tumors developed, and thus was not significantly different across the groups (Fig. 3B, C). Notably, this skin symptom incidence in these multiparous mice was unexpectedly higher than was previously reported for nulliparous mice in this model (25%) [9] and may indicate that pregnancy affects skin symptoms more than duration ofnursing, although the role of age or other factors was not evaluated and skin symptoms in mice, while comparable to findings clinically used for patient diagnosis may not be a comparable endpoint in mice. HFD-fed mice had modestly enhanced tumor growth relative to LFD-fed mice (Fig. 3D). However, weaning status did not affect IBC (SUM149) tumor growth (Fig. 3E, P = NS). Lymphatic pulsing trended towards correlation with tumor size at 42 days (P = 0.08) and was significantly correlated to tumor size at 48 days (P = 0.02).
Fig. 3
High-fat diet promotes IBC (SUM149) tumor growth in SCID/beige multiparous mice. A Percent of mice with tumor over time by diet group (LFD N = 7, HFD N = 7). B Skin symptoms by diet group. C Photograph of representative skin symptoms. D, E Tumor growth delay by diet (*P = 0.04 at 7 weeks, 0.05 at 8 weeks)
Considering molecular mediators of lymphatic trafficking, we examined the expression of C–C chemokine ligand 21 (CCL21) and C–C chemokine receptor 7 (CCR7). CCL21 is a ligand for the leukocyte receptor CCR7, which mediates leukocyte homing and trafficking towards lymphatics. We found that tumor size was significantly correlated with the number of cells expressing CCL21 (Representative image Fig. 4A, Correlation, P = 0.05, Table 1). Thus, we stained tumors from these mice for CCR7 (Fig. 4B), which might be expected to mediate lymphatic homing to this ligand; we found that CCR7 was expressed in SUM149 tumors and was numerically–but not significantly–increased in the HF FW mice. Of the other markers examined (Supplemental Fig. 3A-E), including podoplanin, only CD31 was significantly increased in tumors from HFD mice. There were no significant differences between NW and FW mice (Supplemental Fig. 3 F-J). Interestingly, CCR7 staining in tumors was significantly correlated with pre-tumor lymphatic pulsing in FW mice but not in NW mice (Supplementary Fig. 3 K-N).
Fig. 4
Tissue microarray multiplex immunofluorescence stains of markers from two panels in mammary gland tissue and tumors. A Tumor–stroma interface (20X) shows panel A staining: CD31 (teal), IBA1 (green), αSMA (yellow), podoplanin (red), vimentin (white), KRT19 (magenta). Scale bar is 100 μm. B Tumor Sect. (20X) shows panel B staining: CD163 (teal), CD11b (green), CCR7 (yellow), CD11c (red), CCL21 (white), and KRT19 (magenta). Scale bar is 200 μm
Table 1 Correlation between lymphatic pulsing, CCL21/CCR7 IF positive cells, and tumor growth and lymphangiogenesisHigh-fat diet–induced increase in mammary lymphatic function was independent of lymphatic vessel numberHFD significantly increased lymphatic pulsing activity, independent of weaning status, to a similar extent that tumor initiation did. To determine if this increase in lymphatic functionality was due to increased lymphatic vessel density, we used multiplex IF staining for lymphatic markers and examined the contralateral mammary gland sections from the multiparous mice to determine the number of lymphatic vessels. Multiplex IF staining of the tissue microarrays was successfully completed for the markers in 2 panels, CD31 (endothelial cells), IBA1 (macrophages), αSMA (myofibroblasts), PDPN [a marker of lymphatic endothelial cells], vimentin (marker of the epithelial-to-mesenchymal transition), KRT19 (tumor stem cells), CD163 (anti-inflammatory macrophages), CD11b (macrophages, NK cells), CCR7 (dendritic cells, NK cells, T cells), CD11c (dendritic cells), and CCL21 (T cells),in the tumor and mammary gland tissues (Fig. 4, Supplementary Fig. 3). Lymphatics were identified and annotated manually based on PDPN staining using the entire stained core, and labeled CCL21 cell counts were exported by using ImageScope algorithms (Table 1).
Increased lymphatic function was not associated with an increased number of vessels. No significant differences were found in expression of PDPN across all four treatment groups; in aggregate, the mice fed HFD actually had fewer PDPN+ lymphatic cells than the mice fed LFD (Fig. 5A, P = N.S.; Fig. 5B, P = 0.02). To confirm that the total number of lymphatics was not increased in the mice with increased function, we also assessed lymphatic morphology in the H&E images. The average number of lymphatic vessels identified by manual annotation of H&E-stained sections were not different between groups (Table 2, P=NS). Receipt of HFD also led to having decreased PDPN+ cell counts in annotated lymphatic vessels compared with receipt of LFD (Fig. 5B, P=0.02; representative images shown in Fig. 5D, E).
Fig. 5

High-fat diet enhances lymphatic function independent of lymphatic vessel numbers. Lymphatic vessels were annotated manually based on podoplanin [PDPN]-expression. Ducts were annotated based on KRT19 expression. Each point represents the number of positive cells within an annotated structure (thus the total number of points represents the number of lymphatic or ductal structures summed over all mice in the group). A Total number of PDPN+ cells localized to annotated lymphatics across all mice within each group (LF, low fat, HF high fat, NW, nurse weaned, FW, force weaned). B Total number of PDPN+ cells within annotated lymphatics across mice in HFD versus LFD groups. C Total number of PDPN+ cells within annotated lymphatics by weaning status. D, E. Multiplex IF images show increased density of PDPN+ cells in lymphatic vessels (red) in mammary gland sections from LFD mice (D) Relative to the HFD group (E). F, G, H Co-expression of PDPN and IBA1+ per annotated lymphatic. I, J IF images show infiltration of PDPN+IBA1+ macrophages in the mammary-gland lymphatic vessels in the HF FW and LF FW groups. K, L, M PDPN+IBA+ macrophages per annotated mammary ducts based on KRT19 staining. N IF images of PDPN+IBA1+ macrophages in ducts from FW mice (yellow; represents combination of red PDPN and green IBA1) and NW mice. All scale bars are 100 μm
Table 2 Average number of lymphatic vessels in each mammary gland core for each treatment groupExpression of lymphangiogenic, lympho-invasive PDPN+ ductal macrophages (PoEMs) and other mammary duct–associated monocyte-derived cellsAnalysis of multiparous tumor-bearing mice also showed that HFD increased markers of inflammation and lymphangiogenesis in the contralateral gland independent of lactation/weaning status. Podoplanin-expressing macrophages, PoEMS, have been recently described as lymphangiogenic and LVSI-promoting (42). Thus, we sought to identify mammary-duct–infiltrating PDPN+IBA1+ populations within manually annotated epithelial ductal and lymphatic structures. Within lymphatic vessels, the HF FW mice had the highest numeric concentration of PDPN+IBA1+ cells (Fig. 5F, G, H, I, J, P = NS), but the numbers were low overall and not statistically significant. Next, we examined ductal PoEMs. As was the case for the lymphatic vessels, HFD plus forced weaning increased the numbers of ductal PoEMs (Fig. 5K; L, P < 0.0001 and Fig. 5M, P = 0.002). This increased presence of ductal PDPN+ macrophages in the FW group (relative to the NW group) is illustrated by yellow fluorophores in Fig. 5N and O. Ductal epithelial cells also expressed significantly higher PDPN+ cells in HFD mice (Fig. 6A, NS, 6B, P = 0.006), and the FW mice expressed higher ductal PDPN+ cells than the NW mice (Fig. 6C, P < 0.001). Figures 6D and E show increased numbers of PDPN+ ductal cells within the mammary ducts in the FW mice versus the NW mice. To determine if the numbers or nature of ducts were different between groups, we evaluated lobular subtypes in these mice (type 1 is 11–15 acini per lobule, type 2 is > 15–50, and type 3 is > 50; type 4 is defined as a terminally differentiated milk-secreting lobule) but found no differences across groups (not shown). Ductal cells expressing αSMA also did not vary across all the treatment groups (Fig. 6F) nor by diet (Fig. 6G, P = NS). However, forced weaning led to significant increases in numbers of αSMA+ ductal cells (Fig. 6H, P = 0.001). Representative images are shown in Fig. 6I and J.
Fig. 6
High-fat diet and forced weaning synergistically increase PDPN+ ductal cells. A, B, C PDPN+ ductal cells. D, E Immunofluorescence (IF) images show greater numbers of PDPN+ (red) cells in the mammary ducts from the FW mice than in the NW mice. F, G, H Numbers of ductal cells expressing alpha-smooth muscle actin (αSMA) per duct (G, H). I, J IF αSMA+ ductal cells (yellow). All scale bars are 100 μm
HFD also increased the overall number of ductal IBA1+ macrophages (Fig. 7A; P < 0.0001 LF NW vs HF NW; P = 0.0002 LF FW vs HF FW) independent of weaning status (Fig. 7B, P < 0.0001; Fig. 7C, P = NS). These differences are apparent in the IF images of the postpartum mammary ducts from LFD vs HFD mice, in which IBA1+ cells in and around the ductal epithelium were more prevalent in the mice fed HFD (Fig. 7D, E). In addition, HFD mice had significantly higher numbers of CD163+ cells, independent of weaning status (Fig. 7F, P = 0.01, P = 0.003; Fig. 7G, P < 0.0001; and Fig. 7H, P = NS). These differences were evident in the IF images of postpartum mammary ducts from LFD vs HFD mice (Fig. 7I, J). Finally, the HFD increased the numbers of ductal CD11c+ cells (Fig. 7L, P < 0.001) but weaning status did not (Fig. 7M, P = NS). Again, ductal CD11c+ cells were more evident in the ducts from the HFD mice than in the ducts from the LFD mice (Fig. 7N, O).
Fig. 7

High-fat diet enhances inflammatory immune cells in the mammary ducts. A, B, C IBA1 expressing cells per duct. (D, E) Immunofluorescence (IF) images show IBA1+ cells (green) in postpartum mammary ducts from LFD mice (D) and HFD mice (E). F, G, H. CD163 expressing cells per duct. I, J IF images show CD163+ cells (teal) in postpartum mammary ducts from LFD mice (I) and HFD mice (J). K, L, M HFD led to increased numbers of ductal cells expressing the immune-cell activation marker CD11c independent of weaning status. N, O IF images show expression of ductal CD11c+ cells (red) in the ducts from HFD mice (N) and the LFD mice (O). All scale bars are 100 μm
留言 (0)