
記住我

Breast cancer is among the most common malignancies and the leading cause of cancer-related death in women worldwide.1 It is a highly heterogeneous disease with various therapeutic efficacies and is classified into the following 4 main intrinsic molecular subtypes: luminal A, luminal B, human epidermal growth factor receptor 2 (HER2)–enriched, and triple-negative breast cancer (TNBC).2 The eighth edition of the cancer staging system of the American Joint Committee on Cancer reported that the most important change in breast cancer is the addition of biomarkers, which leads to molecular subtype-based recommendations for systemic therapy.3 Molecular subtypes are essential for developing individualized treatment regimens for breast cancer, because they are associated with various clinical manifestations, treatment responses, and survival rates.4 The early identification of molecular subtypes is crucial for treatment and prognosis.5 Although invasive immunohistochemistry (IHC) based on pathological biopsy is the criterion standard, it only provides partial information on a single heterogeneous tumor.6–8
Magnetic resonance imaging (MRI), the most sensitive imaging modality with high specificity for breast cancer detection, is also the most appropriate imaging tool for high-risk screening and treatment response assessment.9 In addition, dynamic contrast-enhanced MRI (DCE-MRI) can monitor macroscopic changes in breast cancer.10 Many reports have identified some imaging signatures in different molecular subtypes carry on MRI, such as tumor size, morphology, and margin.11–15
Segmentation of the lesion is a particularly critical factor for further analysis of the tumor variation of the global and local shape features, on which most criteria of treatment decisions are based.16 To date, slice-by-slice manual segmentation by professional radiologists remains the most basic segmentation method.17 However, this approach is time-consuming, labor intensive, and yields high intraobserver and interobserver variability.18 Automatic segmentation can alleviate these problems through fast and consistent delineation in many imaging-based applications such as computer-aided diagnosis and image-guided treatment planning. The emergence of machine learning methods has facilitated quantitative image analysis workflows and offers promising prospects for automatic segmentation. Deep learning, as an approach to machine learning, is based on artificial neural network architectures and is more scalable than the other methods.19 Moreover, some studies have reported that computer-aided semiautomatic or automatic segmentation based on deep learning is faster with less evaluator effort and demonstrates more reproducible and effective texture features in different fields of image analysis.20–22
In recent years, radiomics, as a new analysis method for extracting high-dimensional quantitative data and associating multiple imaging parameters with different signatures in cancer imaging studies, has been identified as an auxiliary alternative for determining the subtype of breast cancer.23–25 Fan et al26 investigated a prediction model of 60 patients using 24 selected features and showed a high overall classification performance with an area under the receiver operator characteristic curve (AUC) value of 0.869. Wu et al14 studied multivariate logistic regression models of 210 patients based on DCE-MRI characteristics and achieved an area under the AUC 0.71 and 0.73 for luminal A, 0.67 and 0.69, luminal B, and 0.66 and 0.79 for basal cancer. Similar to the previous studies mentioned previously, the predictions of molecular subtypes in breast cancer were feasible; however, some problems such as the limitation of certain subtypes, small or moderate sample sizes, time-consuming segmentation, and small number of imaging features were encountered.
This study aimed to further investigate whether radiomics-based methods based on automatic segmentation using MRI can more efficiently and accurately assist radiologists in predicting the molecular subtypes of breast cancer.
MATERIALS AND METHODS Study DesignOur radiomics-based method follows the following workflow: (1) image acquisition; (2) automatic image segmentation improved by an iterative label workflow and annotation of molecular subtypes; (3) feature extraction, selection, and reduction; and (4) radiomics model establishment, analysis, and classification.
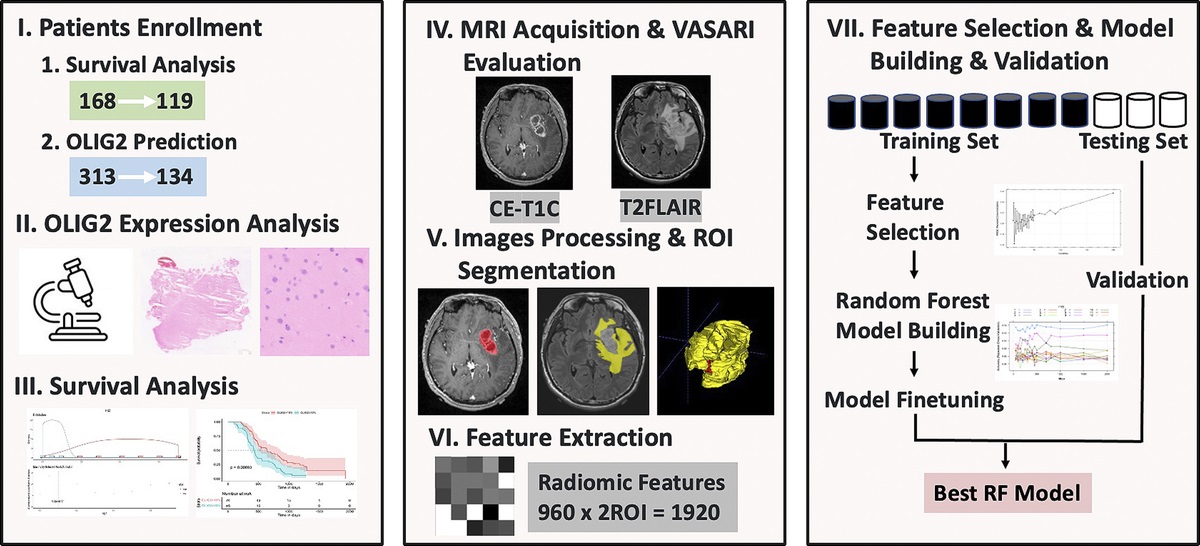
The workflow of radiomics for breast cancer analysis is described in Figure 1.
 FIGURE 1:
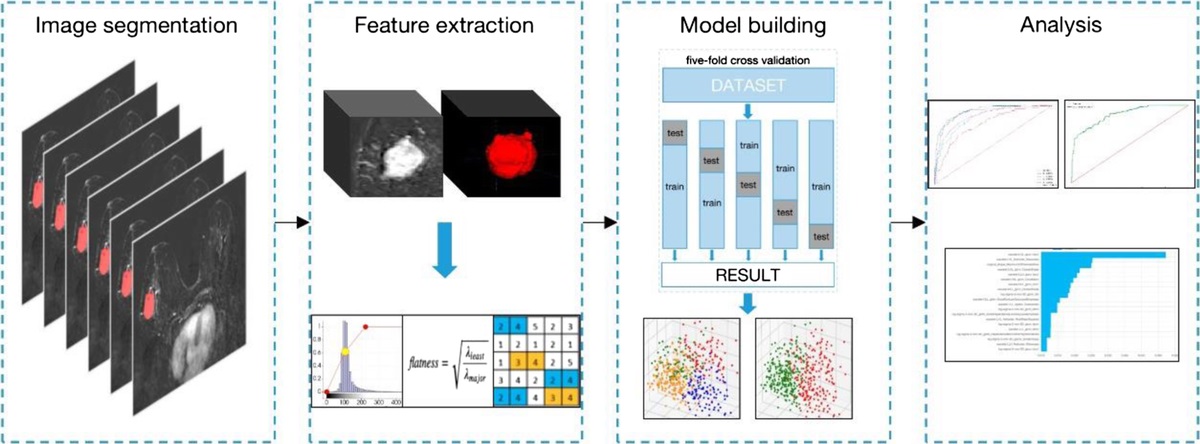
 Radiomics workflow. The delineated ROIs were segmented by a homemade deep learning automatic segmentation model and checked manually via the itk-SNAP software on the first DCE-MRI subtraction images. The radiomics features were extracted from the ROIs to quantify lesion intensity, shape, and texture. Ten-time 5-fold cross-validation of all 18 cross combination methods was used to build a radiomics model. The classification performance of the model was assessed with the AUC.
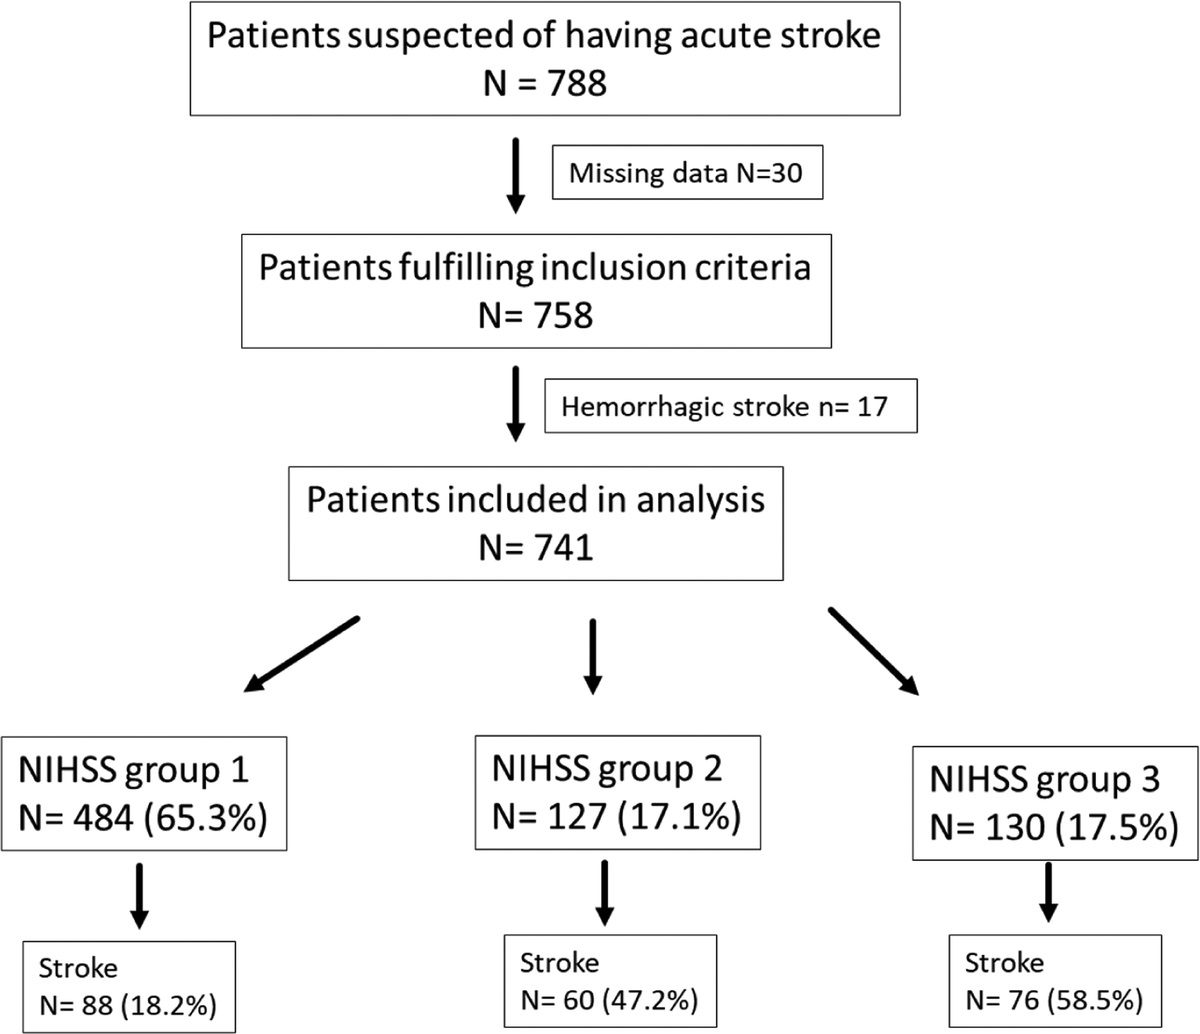
Patient SelectionThe institutional review board approved this retrospective study and waived the need for written informed consent. Six hundred patients who underwent pretreatment MRI before treatment between January 2015 and October 2021 were identified for this study. One of the patients had lesions in both breasts. All patients had available pathological data for IHC staining. All patients had available pathological data for IHC staining. The inclusion criteria were as follows: (1) pathological diagnosis of breast carcinoma and (2) complete clinical and pathological data and images, which were scanned using the same MRI protocol. The exclusion criteria were as follows: (1) received therapy before MRI examination, (2) ductal carcinoma in situ at diagnosis, and (3) artifacts on MRI examination. Finally, 516 women aged 23 to 80 years were recruited. The patient enrolment process is shown in Figure 2. The clinical characteristics of the patients are summarized in Table 1.
 FIGURE 2:
 Flow chart of patient enrollment.
TABLE 1 - Clinical Characteristics of 4 Molecular Subtypes and 3 Pairwise Comparisons Between Subtypes 4 Molecular Subtypes Luminal vs Nonluminal HER2-Enriched vs Non-HER2–Enriched TNBC vs Non-TNBC Luminal A Luminal B HER2-enriched TNBC P Luminal Non-luminal P HER2-enriched Non-HER2–enriched P TNBC Non-TNBC P Characteristics 0.155 0.226 0.565 0.712 Age, y 50.97 ± 10.13 (23–80) 51.73 ± 11.32 (26–74) 51.01 ± 9.81 (29–79) 48.29 ± 9.69 (28–80) 50.12 ± 9.83 (23–80) 51.23 ± 10.53 (28–80) 51.16 ± 9.84 (29–79) 50.59 ± 10.41Quantitative variables are expressed as mean ± standard deviation. Bolded text indicates that the results are statistically significant.
Breast cancer molecular subtypes were determined based on the Chinese Anti-Cancer Association and the immunohistochemical results in the histopathological reports were analyzed by pathologists.5 The estrogen receptor (ER), progesterone receptor (PR), HER2 status, and Ki-67 index were used to define the molecular subtypes. They were classified by IHC as luminal A (ER-positive and/or PR-positive, HER2-negative, and Ki-67 < 20%), luminal B (ER-positive and/or PR-positive, HER2 negative, and Ki-67 ≥ 20%), HER2-enriched (ER- and PR-negative and HER2-positive), and TNBC (ER-, PR-, and HER2-negative). Estrogen receptor and PR positivity was defined as more than 1% staining.27 In the St Gallen 2015 consensus meeting, most panelists accepted the threshold value of Ki-67 within the range of 20% to 29%.28 A Ki-67 index of 20% was selected for this study. HER-2 positivity was defined as a score of 3+ by IHC or fluorescence in situ hybridization amplification with a score of 2+ or higher.5
Magnetic Resonance Imaging AcquisitionAll patients were scanned using a 1.5T system (Magnetom Espree Pink; Siemens, Erlangen, Germany) equipped with an 8-channel phased-array surface coil for the breast. Conventional scans were carried out using the following parameters: axial T1 weighted imaging 3-dimensional (3D) nonfatsuppressed: (repetition time/echo time [TR/TE], 8.7/4.7 ms; acquired slice thickness, 1.1 mm); axial T2WI plus fat saturation: (TR/TE, 2900/60 ms; slice thickness, 4.0 mm). Dynamic contrast-enhanced MRI used a fast small-angle excitation three-dimensional imaging (3D-FLASH) sequence and fat-saturated axial T1 weighted imaging: (TR/TE, 4.5/1.6 ms, acquired slice thickness, 1.1 mm). Dynamic contrast-enhanced MRI was started after intravenous administration of 0.1 mmol/kg Gd-DTPA (Magnevist; Bayer, Berlin, Germany), followed by 30 mL of normal saline for washing at a flow rate of approximately 2.0 mL/s. Digital subtraction was simultaneously performed automatically at the same time. The scanning range included bilateral breast tissue, the front of the same level of the thorax, and bilateral armpits.
Image SegmentationWe designed a fully automatic segmentation method using artificial intelligence. The segmentation method building process includes the following procedures: preprocessing, augmentation, network building, and postprocessing. In the preprocessing step, image respacing, normalization, and cropping were applied to each data case. Z-score normalization was suitable for this study, according to our experiments. Subsequently, we calculated the mean pixel size to rescale all data sets. Finally, a 96 × 96 × 96 3D patch was cropped around the lesion and used as the input for network training. The details of the image segmentation have been reported in our previous study.29
The segmentation model is a robust 3D UNet-based Convolutional Neural Networks (CNN) with a residual block in feature extraction. The input is the images of the axial first DCE-MRI subtraction, and the output is the automatic segmentation of the regions of interest (ROIs). For model training, we used the dice similarity coefficient (DSC) and cross-entropy as loss functions.
Loss=0.5×DSC_loss+0.5×cross_entropy_loss
=0.5×1−2×Xi∩YiXi+Yi+0.5×∑i−YilogXi)
The extracted features were combined with the decoder output features from the skip connection to obtain accurate prediction results for lesion segmentation. We removed the small predicted region to avoid outliers from the predicted results because the lesion was an agglomerated region in the postprocessing procedure.
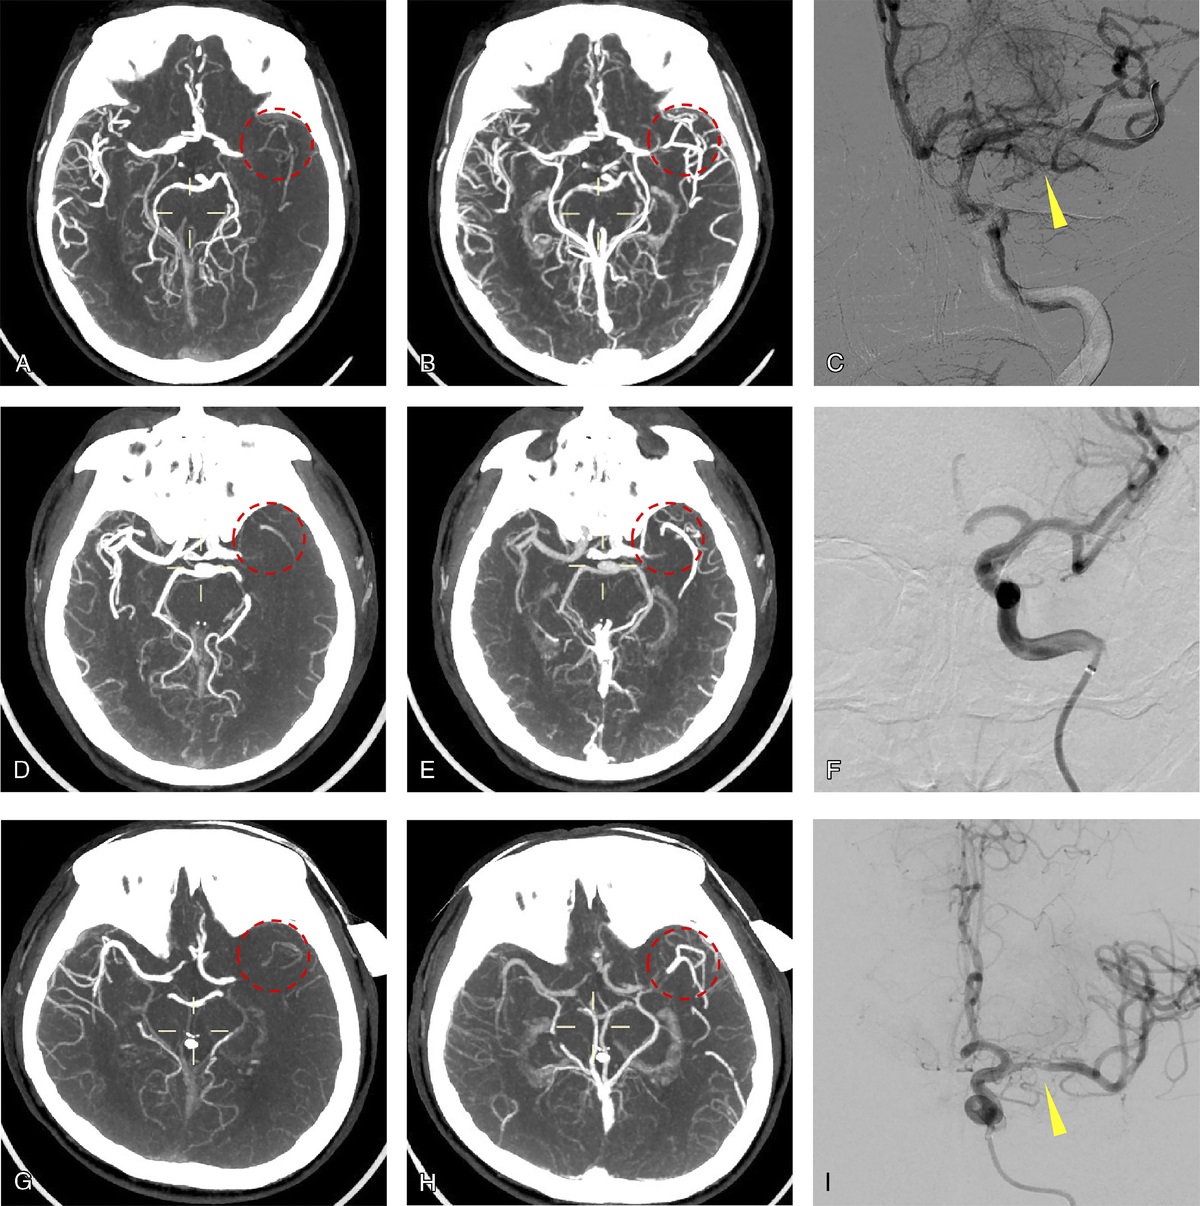
Itk-SNAP software (www.itksnap.org) was used to revise the automatically segmented areas. An iterative label workflow was used to delineate the ROIs in the early stages to obtain ideal labels without being time-consuming. This label workflow had 3 steps. First, a model was learned from the initial labeled data. The training set was then enlarged to the union of the labeled data and the model's predictions for the unlabelled data. Finally, a new model is trained on the new training set. Manual labels of the initial part of the patient were considered as the reference. An initial simple network model was trained using an in-house data set. Then, the pretrained model was applied to the ROIs of the remaining patients' ROIs and coarse segmentation was achieved. Subsequently, 2 dedicated radiologists participated in the manual revision, including labelling the tumor with pathological records of the molecular subtype. The overlay of the automatic segmentation and radiologist annotation areas were compared using DSC to evaluate the model results. Sample MR images of the 4 molecular subtypes are shown in Figure 3.
 FIGURE 3:
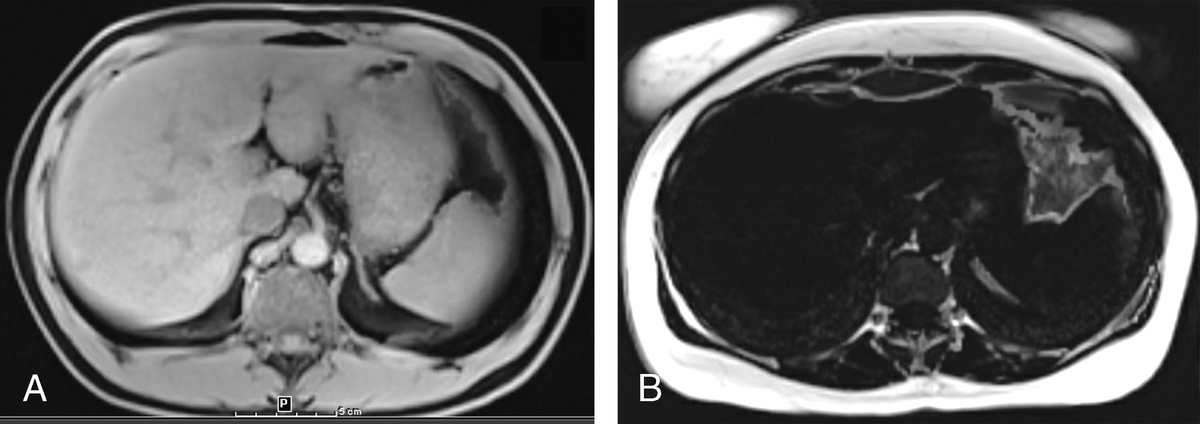
 Dynamic contrast-enhanced MRI subtraction images of 4 molecular subtypes of breast cancer. A, A 68-year-old woman with luminal A breast cancer. B, A 45-year-old woman with Luminal B breast cancer. C, A 45-year-old woman with HER2-enriched breast cancer. D, A 62-year-old woman with TNBC.
Data AnnotationThe corresponding tumor images were labeled with pathological records of the molecular subtypes. In total, the data contained 197 (38.10%) patients with luminal A, 99 (19.15%) with luminal B, 149 (28.82%) with HER2-enriched, and 72 (13.93%) with TNBC.
Features Extraction and Model BuildingPyradiomics, an open-source Python package, was used to extract radiomics features. These features were comprised of the following 7 parts: (a) first-order statistics features, (b) shape-based features, (c) gray-level co-occurrence matrix, (d) gray-level run length matrix, (e) gray-level size zone matrix, (f) gray level dependence matrix, and (g) neighboring gray tone difference matrix. Finally, 1316 radiomics features were extracted from the original MR images, images with wavelet filters, and Laplace of Gaussian filters for each patient. All features were Z-score normalized. A cross-combination method was used to determine the best classification performance for the feature selection and model building. We tried all combinations of 3 kinds of classification models, including linear support vector classification, logistic regression, and random forest, and 6 kinds of feature selection methods, including mutual information, Pearson correlation coefficient, Wilcoxon rank sum test, F test, L1-based feature selection, and tree-based feature selection. In addition, different numbers of features used by the model were tested for each classifier, and the grid search method was used to select the parameters. A weighted random sampling method was used to balance the number of each subtype in the model training. To reduce the risk of overfitting and improve prediction performance, all classification models were validated using 10 times 5-fold cross-validation. First, the entire data set was randomly divided into five parts: 4 parts were used to train the model, and the remaining part was used to verify the performance of the model. We repeated this procedure 10 times and obtained the average performance on the validation sets.
Statistical AnalysesThe predictive discrimination abilities of the models were assessed using the area under the receiver operating characteristic (ROC) curve (AUC). Sensitivity, specificity, and classification accuracy were calculated according to the following formulas:
Accuracy=TP+TN/TP+FP+TN+FNSensitivity=TP/TP+FNSpecificity=TN/FP+TN
Comparison of clinical characteristics between different molecular subtype groups was achieved using the χ2 test, t test, and Fisher exact test using the SPSS 25.0 software package. Statistical significance was set at P < 0.001.
RESULTSThe average DSC value of the automatic segmentation was 0.89. Table 1 shows the clinical characteristics of the 4 molecular subtypes; only tumor size showed statistically significant differences between the different molecular subtypes (P < 0.001).
Performance of 4 Molecular Subtypes ClassificationWhen 10 rounds of cross-validation of all 18 cross-combination methods were completed, the best performance of the 4 molecular subtype classifications came from the random forest classifier and the tree-based feature selection method. The confusion matrix plot in Figure 4 shows the ability of our method to correctly classify the 4 molecular subtypes. The ROC curves of the classification results for the 4 molecular subtypes are shown in Figure 5. The best average AUC performance for distinguishing molecular subtypes was 0.8623, with an accuracy of 0.6596, sensitivity of 0.6383, and specificity of 0.8775. A total of 113 radiomics features were selected from the feature selection for each ROI, including wavelet-LHL_glcm_Imc1, wavelet-LHL_firstorder_Skewness, original_shape_Maximum2DDiameterRow, wavelet-LHL_glcm_ClusterShade, and wavelet-LLH_glcm_Imc1, the weights of which ranked in the top 5. The top 20 features and weights are shown in Figure 6.
 FIGURE 4:
 Confusion matrix plot for the classification of 4 molecular subtypes. The horizontal direction of the plot was the ground-truth label for the 4 molecular subtypes, and the longitudinal direction of the plot was the prediction results of molecular subtypes. The color bars represented the proportion of prediction results in this molecular subtype.
 FIGURE 5:
 Receiver operating characteristic of 4 molecular subtypes classification results. A, Receiver operating characteristic plot for classification of breast cancer molecular subtypes. Curves 0 to 3 represented the molecular subtypes of TNBC, luminal A, luminal B, and HER2-enriched, respectively. B–D, Receiver operating characteristic plots for classification of luminal versus nonluminal subtypes, HER2-enriched versus non-HER2–enriched subtypes and TNBC versus non-TNBC subtypes.
 FIGURE 6:
 The top 20 radiomics features used in the classification. From (A–D) are the features and weights in the classification of 4 molecular subtypes, luminal versus nonluminal subtypes, HER2-enriched versus non-HER2–enriched subtypes, and TNBC versus non-TNBC subtypes. The length of the column represented the value of the feature weight.
Performance of Luminal Versus Nonluminal Subtypes ClassificationThe optimal classifier and feature selection for the classification of luminal versus nonluminal subtypes were linear support vector classification and L1-based feature selection after 10-time cross-validation. The ROC curves of the luminal versus nonluminal subtype classification results are shown in Figure 5. The AUC of the optimal performance was 0.8788 (95% confidence interval [CI], 0.8505–0.9071), and the accuracy, sensitivity, and specificity were 0.7756, 0.7973, and 0.7466, respectively. A total of 83 features were selected for building the classification model. The top five feature weights were wavelet-HHL_ngtdm_Strength, wavelet-HHH_glcm_MaximumProbability, wavelet-HHL_glszm_LowGrayLevelZoneEmphasis, wavelet-LHL_ngtdm_Busyness, and log-sigma-3-mm-3D_gldm_DependenceNonUniformityNormalized.
Performance of HER2-Enriched Versus Non-HER2–Enriched Subtypes ClassificationLogistic Regression and L1-based feature selection were performed for HER2-enriched versus non-HER2–enriched subtypes. The ROC curve of HER2 versus non-HER2 subtype classification results is shown in Figure 5. The AUC of optimal performance was 0.8676 (95% CI, 0.8370–0.8982), and the accuracy, sensitivity, and specificity were 0.7737, 0.8859, and 0.7283, respectively. In total, 82 features were selected for this study. The top 5 feature weights were log-sigma-3-mm-3D_glszm_SizeZoneNonUniformity, wavelet-HLH_firstorder_Range, wavelet-LHH_firstorder_Range, wavelet-HLH_glszm_GrayLevelNonUniformityNormalized, and wavelet-LHL_glcm_Idmn.
Performance of TNBC Versus Non-TNBC Subtypes ClassificationRandom forest and tree-based feature selection were used for TNBC and non-TNBC subtypes. The ROC curve of TNBC versus non-TNBC subtype classification results is shown in Figure 5. The AUC of the optimal performance was 0.9335 (95% CI, 0.9027–0.9643), and the accuracy, sensitivity, and specificity were 0.9110, 0.4444, and 0.9865, respectively. In total, 121 features were selected for this study. The top 5 feature weights were wavelet-LHL_firstorder_ skewness, wavelet-LHL_glcm_ClusterShade, wavelet-LLH_firstorder_ skewness, wavelet-LLH_glcm_ClusterShade, and wavelet-HLL_firstorder_ skewness.
Table 2 summarizes the performance of the radiomics model for several breast cancer subtypes.
TABLE 2 - Performance of the Radiomics Model Among Several Breast cancer Subtypes Classifications AUC Accuracy Sensitivity Specificity 4 molecular subtypes 0.8623 (95% CI: 0.8333–0.8913) 0.6596 (95% CI: 0.6346–0.6846) 0.6383 (95% CI: 0.6133–0.6633) 0.8775 (95% CI: 0.8495–0.9055) Luminal vs nonluminal 0.8788 (95% CI: 0.8505–0.9071) 0.7756 (95% CI: 0.7513–0.7999) 0.7973 (95% CI: 0.7723–0.8223) 0.7466 (95% CI: 0.7236–0.7696) HER2-enriched vs non-HER2–enriched 0.8676 (95% CI: 0.8370–0.8982) 0.7737 (95% CI: 0.7471–0.8003) 0.8859 (95% CI: 0.8559–0.9159) 0.7283 (95% CI: 0.6993–0.7573) TNBC vs non-TNBC 0.9335 (95% CI: 0.9027–0.9643) 0.9110 (95% CI: 0.8842–0.9378) 0.4444 (95% CI: 0.4134–0.4754) 0.9865 (95% CI: 0.9745–0.9985)In this study, we evaluated the diagnostic performance of radiomics based on the automatic segmentation of MRI for the noninvasive differentiation of 4 molecular subtypes and achieved an average AUC of 0.8623. The best results were achieved for the differentiation of luminal versus nonluminal (AUC, 0.8788), HER2-enriched versus non-HER2–enriched (AUC, 0.8676), and TNBC versus non-TNBC (AUC, 0.9335). This feasibility study obtained good results, particularly for the prediction of TNBC subtypes. Our comprehensive analysis of 516 patients provides a more persuasive reference for the potential of radiomics performance for prediction.
Based on the clinical characteristics of the 4 molecular subtypes described in Table 1, only tumor size showed statistically significant differences between the different molecular subtypes (P < 0.001). However, the molecular subtypes of heterogeneous breast cancer are difficult to accurately assess from the perspective of clinical characteristics alone. Significant imaging information obtained from MRI is feasible as a complementary approach. Radiomics in breast cancer has been applied to predict molecular subtypes, pathological complete response after neoadjuvant chemotherapy, and lymph node metastasis.30 Although invasive tissue sampling is the criterion standard, radiomics can potentially and dynamically serve as an auxiliary and noninvasive method to derive prognostic and predictive information during tumor treatment and help clinicians recognize important imaging characteristics.5,7
Our radiomics study evaluated 4 molecular subtypes classifications based on automatic segmentation, among which the highest AUC of the TNBC subtype was 0.9335. Molecular subtypes can influence treatment selection, such as endocrine therapy, anti-HER2 therapy, and cytotoxic therapy, in clinical practice.6 Luminal subtypes account for nearly 70% of breast cancer cases and respond well to hormonal therapy.14 The HER2-enriched subtype is more likely to have a pathologic complete response to neoadjuvant chemotherapy, whereas inferior pathologic complete response rates are demonstrated in the luminal subtype.31 Triple-negative breast cancer, as the most aggressive type, has a higher mortality rate than those of the other subtypes. Distinguishing between TNBC and non-TNBC will help clinicians make clinical decisions more rapid. The sensitivity and specificity for TNBC were 0.4444 and 0.9865, respectively. The relatively unbalanced data distribution might have contributed to this result. However, our specificity was close to 100%, demonstrating that the model can be used as an excellent inclusionary tool and provides clear guidance for clinicians. The application of our model can enhance the confidence and powerful evidence of TNBC patients to confirm the diagnosis and accelerate the treatment process. Compared with previous studies which predicted a certain subtype or 4 subtypes with overall accuracy, we used 3 pairwise comparisons between subtypes to verify the reliability and applicability of the model from various angles. Ma et al32 proved that the radiomics model based on 15 features to differentiate between TNBC and non-TNBC had the best AUC of 0.741 for cross-validation and 0.867 for the independent testing cohort. They also implemented a deep learning model for segmentation and achieved a DSC of 0.82. Compared with their study, we improved the DSC based on a larger sample size and performed radiomics classification of the 4 molecular subtypes based on this excellent segmentation result. Leithner et al7 extracted breast MR images and developed radiomics to allow the separation of aggressive and nonaggressive subtypes (TNBC and luminal A) with an overall median AUC of 0.80. Xie et al8 extracted features from DCE-MRI and diffusion weighted imaging of 134 breast cancer patients and established a novel 2-stage feature selection method combined with traditional statistics to identify molecular subtypes. The accuracy of the linear discriminant analysis model was the highest (72.4%) among the 4 classification tasks, and that of the support vector machine model for differentiating between TNBC and non-TNBC was the highest (91.0%). These 2 studies used multiparametric and DCE-MRI with different periods of radiomics to improve the efficacy. Leithner et al12 also used the first DCE-MRI subtraction images; we jointly selected this sequence because it is the clearest one for segmentation, and the malignant lesions show peak enhancement with discernible morphological features. Our studies have found that radiomics features from the first DCE-MRI subtraction images can identify molecular subtypes with high accuracy. In terms of the methodological use of radiomics, all studies used a combination of classification models and feature selection methods. This approach maximized performance and demonstrated that even the same feature selection method can produce different results when combined with different machine learning algorithms. Compared with the previously mentioned studies, our study expanded the sample size, devoted to precise differentiation, and eventually achieved better performance. Moreover, our sample distribution was relatively more balanced than those in other studies. In summary, our study further confirmed the development of a radiomics technique, which is effective in predicting molecular subtypes. How to apply it to clinical practice and provide the full value of radiomics still needs to be explored.
Image segmentation, as an important step for quantitative image analysis, is critical to identify the features combined with clinical, biological, genetic, or any other data.33 The common image segmentation methods can be done manually, semiautomatically, or automatically. Semiautomatic and automatic segmentation streamlined the process and provided higher reproducibility. Deep learning has emerged as a powerful alternative for supervised segmentation in recent years. Kumar et al34 proposed a multi U-Net algorithm, which built up an existing deep learning–based segmentation algorithm to segment suspicious breast masses on ultrasound imaging. The CNN have been used to handle varieties of biomedical imaging problems.35 Compared with traditional 2-dimensional segmentation, 3D images can provide stereoscopic information and more image features to accurately distinguish different tissues. Khaled et al36 proposed an automated method for breast lesion segmentation from DCE-MRI with a 3D patch-based modified U-Net framework and obtained a mean DSC of 0.680. Our research has achieved better performance on breast MRI to demonstrate the feasibility of our model. We used the high-performance automatic method named 3D UNet-based CNN with a high DSC (0.89) to improve efficiency and accuracy. The automatic segmentation was significantly less time-consuming than manual segmentation was for each ROI.
This study had a few limitations. First, this was a retrospective study conducted at a single institution. Although our study included a relatively large sample size, external verification can test the rationality of our model in clinical practice and improve confidence in performance. In addition, our model had the strongest ability to identify TNBC types. Although the TNBC type has the smallest amount of data, the prediction efficiency of the model is the best, which is related to the relatively obvious image characteristics associated with TNBC, such as round or oval mass and circumscribed margin. Further precise analyses are needed to improve the recognition of luminal and HER2-enriched subtypes. Third, combining other medical images, such as ultrasound, mammography, or computed tomography, also deserves attention. Models using different types of medical imaging methods may be better than those using single methods. Finally, from the perspective of methods, our study used only the first DCE-MRI subtraction images to extract radiomic features and build classification models. Some deep learning methods, such as CNN and Recurrent Neural Networks that can extract more complex features and use more imaging sequences, may be applied in this study to obtain better results.
CONCLUSIONSOur study explored a feasible radiomics model based on automatic segmentation with high performance for predicting the 4 molecular subtypes. Radiomic signatures could serve as efficient tools to monitor changes during treatment and assist in the clinical decision-making process. Further studies with larger samples and more advanced algorithms will increase the maturity of this technology.
REFERENCES 1. Meyer-Base A, Morra L, Tahmassebi A, et al. AI-enhanced diagnosis of challenging lesions in breast MRI: a methodology and application primer. J Magn Reson Imaging. 2021;54:686–702. 2. Zardavas D, Irrthum A, Swanton C, et al. Clinical management of breast cancer heterogeneity. Nat Rev Clin Oncol. 2015;12:381–394. 3. Teichgraeber DC, Guirguis MS, Whitman GJ. Breast cancer staging: updates in the AJCC Cancer Staging Manual, 8th Edition, and current challenges for radiologists, from the AJR Special Series on Cancer Staging. Am J Roentgenol. 2021;217:278–290. 4. Waks AG, Winer EP. Breast cancer treatment: a review. JAMA. 2019;321:288–300. 5. Ma M, Liu R, Wen C, et al. Predicting the molecular subtype of breast cancer and identifying interpretable imaging features using machine learning algorithms. Eur Radiol. 2022;32:1652–1662. 6. Huang Y, Wei L, Hu Y, et al. Multi-parametric MRI-based radiomics models for predicting molecular subtype and androgen receptor expression in breast cancer. Front Oncol. 2021;11:706733. 7. Leithner D, Mayerhoefer ME, Martinez DF, et al. Non-invasive assessment of breast cancer molecular subtypes with multiparametric magnetic resonance imaging radiomics. J Clin Med. 2020;9:1853. 8. Xie T, Wang Z, Zhao Q, et al. Machine learning–based analysis of MR multiparametric radiomics for the subtype classification of breast cancer. Front Oncol. 2019;9:505. 9. Leithner D, Wengert GJ, Helbich TH, et al. Clinical role of breast MRI now and going forward. Clin Radiol. 2018;73:700–714. 10. Bitencourt A, Daimiel Naranjo I, Lo Gullo R, et al. AI-enhanced breast imaging: where are we and where are we heading? Eur J Radiol. 2021;142:109882. 11. Ab Mumin N, Ramli Hamid MT, Wong JHD, et al. Magnetic resonance imaging phenotypes of breast cancer molecular subtypes: a systematic review. Acad Radiol. 2022;29:S89–S106. 12. Leithner D, Horvat JV, Marino MA, et al. Radiomic signatures with contrast-enhanced magnetic resonance imaging for the assessment of breast cancer receptor status and molecular subtypes: initial results. Breast Cancer Res. 2019;21:106. 13. Sun X, He B, Luo X, et al. Preliminary study on molecular subtypes of breast cancer based on magnetic resonance imaging texture analysis. J Comput Assist Tomogr. 2018;42:531–535. 14. Wu J, Sun X, Wang J, et al. Identifying relations between imaging phenotypes and molecular subtypes of breast cancer: model discovery and external validation. J Magn Reson Imaging. 2017;46:1017–1027. 15. Wu M, Ma J. Association between imaging characteristics and different molecular subtypes of breast cancer. Acad Radiol. 2017;24:426–434. 16. Lei Y, He X, Yao J, et al. Breast tumor segmentation in 3D automatic breast ultrasound using Mask Scoring R-CNN. Med Phys. 2021;48:204–214. 17. Gryska E, Schneiderman J, Björkman-Burtscher I, et al. Automatic brain lesion segmentation on standard magnetic resonance images: a scoping review. BMJ Open. 2021;11:e42660. 18. Gau K, Schmidt C, Urbach H, et al. Accuracy and practical aspects of semi- and fully automatic segmentation methods for resected brain areas. Neuroradiology. 2020;62:1637–1648. 19. Chan HP, Samala RK, Hadjiiski LM, et al. Deep learning in medical image analysis. Adv Exp Med Biol. 2020;1213:3–21. 20. Liu F, Zhou Z, Jang H, et al. Deep Convolutional Neural Network and 3D deformable approach for tissue segmentation in musculoskeletal magnetic resonance imaging. Magn Reson Med. 2018;79:2379–2391. 21. Huang B, Lin X, Shen J, et al. Accurate and feasible deep learning based semi-automatic segmentation in CT for radiomics analysis in pancreatic neuroendocrine neoplasms. IEEE J Biomed Health Inform. 2021;25:3498–3506. 22. Zhang J, Saha A, Zhu Z, et al. Hierarchical Convolutional Neural Networks for segmentation of breast tumors in MRI with application to radiogenomics. IEEE Trans Med Imaging. 2019;38:435–447. 23. Meyer-Bäse A, Morra L, Meyer-Bäse U, et al. Current status and future perspectives of artificial intelligence in magnetic resonance breast imaging. Contrast Media Mol Imaging. 2020;2020:6805710. 24. Pinker K, Chin J, Melsaether AN, et al. Precision medicine and radiogenomics in breast cancer: new approaches toward diagnosis and treatment. Radiology. 2018;287:732–747. 25. Ha R, Mutasa S, Karcich J, et al. Predicting breast cancer molecular subtype with MRI dataset utilizing Convolutional Neural Network algorithm. J Digit Imaging. 2019;32:276–282. 26. Fan M, Li H, Wang S, et al. Radiomic analysis reveals DCE-MRI features for prediction of molecular subtypes of breast cancer. PloS One. 2017;12:e171683. 27. Rakha EA, Green AR. Molecular classification of breast cancer: what the pathologist needs to know. Pathology. 2017;49:111–119. 28. Coates AS, Winer EP, Goldhirsch A, et al. Tailoring therapies—improving the management of early breast cancer: St Gallen International Expert Consensus on the primary therapy of early breast cancer 2015. Ann Oncol. 2015;26:1533–1546. 29. Yue W, Zhang H, Zhou J, et al. Deep learning-based automatic segmentation for size and volumetri
留言 (0)