
記住我
Legionella is an opportunistic premise plumbing pathogen and etiological agent of Legionnaires’ disease (LD), a potentially fatal pneumonia like infection (Cunha et al., 2016). Legionella is ubiquitous in natural and engineered water systems and transmitted through aspiration or inhalation of Legionella contaminated water or aerosols (Schwake et al., 2021). Globally the incidence of LD has been increasing. In 2021, the US Centers for Disease Control and Prevention (CDC) reported 8260 confirmed cases of LD in USA (Centers for Disease Control and Prevention, 2022). In Australia, 524 confirmed cases of legionellosis were reported in 2020 (Australian Government Department of Health and Aged Care, 2021). According to the European Centre for Disease Prevention and Control (ECDC) 11,298 confirmed cases of LD were documented across European countries in 2019. However, in 2020 the number decreased to 8,372; this reduction may be associated with COVID-19 pandemic lockdown restrictions or a decrease in focus on LD. In 2021, 10,723 confirmed cases of LD were documented of which 5.4% were nosocomial infections (The European Legionnaires’ Disease Surveillance Network, 2022). The actual number of legionellosis cases is understated, because in the majority of cases Pontiac fever remains unnoticed and the etiological agent of pneumonia remains unrecognized (Cassell et al., 2019). There are at least 60 distinct species of Legionella, with L. pneumophila sg.1 being the most common cause of outbreaks (Khodr et al., 2016; Miyashita et al., 2020). Initially, cooling towers were considered to be the main source of Legionella spp., but subsequent investigations have identified that engineered water systems are a major source of LD (Kanarek et al., 2022). Those at greatest risk of infection are the elderly and immunocompromised individuals, and as such nosocomial outbreaks associated with hospital engineered water systems are of significant concern (Bartram et al., 2007).
A range of factors influence the survival and persistence of Legionella spp. in hospital water systems including: biofilms, nutrients, disinfectants, protozoa hosts, water temperature, flow dynamics and stagnation (Abdel-Nour et al., 2013; Whiley et al., 2017; Nisar et al., 2020b). Naturally, Legionella spp. infects and survives within a wide range of polyphyletic protozoan hosts, with Acanthamoeba and Vermamoeba the most commonly identified hosts in potable water (Boamah et al., 2017; Best and Abu Kwaik, 2018; Nisar et al., 2020a). Intracytoplasmic Legionella spp. are protected from adverse environmental conditions (Best and Abu Kwaik, 2018), with Legionella spp. released from host protozoa more virulent and pathogenic in nature (Fields et al., 2002; Boamah et al., 2017). Additionally, Legionella spp. intrinsically tolerate water disinfection treatments by entering into a metabolically inactive but highly resistant and potentially pathogenic “viable but non-culturable” (VBNC) state (Kirschner, 2016). Under suitable environmental conditions, and in the presence of protozoa hosts, VBNC Legionella spp. can resuscitate back into a culturable state (Dietersdorfer et al., 2018). VBNC Legionella spp. are a significant challenge to water quality management as they cannot be detected using the standard culture-based method (International Organization for Standardization, 2017; Standards Australia, 2017). Legionella spp. specific quantitative PCR (qPCR) assay is an alternative method typically used to detect the genomic load of Legionella spp. (International Organization for Standardization, 2019); however, it cannot distinguish between culturable, dead and VBNC Legionella spp. (Kirschner, 2016). As such, there are currently limited studies that investigate the survival of VBNC Legionella spp. in engineered water systems.
Water stagnation in engineered water systems is categorized into two different types; permanent, and temporary stagnation (Peter and Routledge, 2018; Nisar et al., 2020b). Permanent stagnation is complete stagnation of plumbing structures, such as dead-ends and dead-legs (Nisar et al., 2020b). However, in engineered water systems, water can also stagnate in storage tanks, plumbing piping network, and within components at the water outlets for a few hours to weeks and even months (Bartram et al., 2007; Manuel et al., 2009). This type of water stagnation is known as intermittent or temporary stagnation (Manuel et al., 2009; Peter and Routledge, 2018). The relationship between Legionella spp. and permanent stagnation is well characterized (Totaro et al., 2018; Nisar et al., 2020b). However, less is known about the relationship between Legionella spp. and temporary stagnation. Therefore, this study examined the role of temporary stagnation arising through intermittent water usage on the persistence of Legionella spp. and free-living amoebae (FLA) within a hospital water system.
This study was the first study to utilize a novel method to enumerate VBNC Legionella spp. and L. pneumophila from environmental water samples and investigate relationships with protozoan hosts. This study utilized the Enware Smart® Flow monitoring system to examine the relationships between water flow (arising through water outlet usage) and temperature with Legionella spp., L. pneumophila and amoeba hosts. The specific aims of this study were as follows, to: (1) determine the prevalence of Legionella spp./L. pneumophila and FLA in a hospital water system; (2) examine the relationship between Legionella spp. and potential protozoan hosts; and (3) monitor the effect of sampling phases (months), water temperature, flow dynamics and stagnation on persistence of Legionella spp. in the hospital water system. To our knowledge, this is the first comprehensive study that has quantified VBNC Legionella spp. and FLA from a hospital water system under dynamic flow and temperature conditions.
2 Materials and methods2.1 Sample collection and processingFrom March 2021 to June 2022, water (n = 120) and biofilm (n = 46) samples were collected from the engineered water system of an Australian hospital located in New South Wales, Australia. The sampling was done in different phases, where the categorization was: March 2021 as phase 1, April 2021 as phase 2, November 2021 as phase 3 and June 2022 as phase 4. All water and biofilm samples were collected, transported and stored as recommended by standard guidelines (International Organization for Standardization, 2018; Centers for Disease Control and Prevention, 2019). For the water samples, 1 L first flush hand basin or shower water was collected in sterile wide-mouth screw capped plastic bottles (2105-0032, Nalgene™). For the biofilm samples, visible biofilm was scraped from the inside of tap faucet or shower head using sterile polyurethane-tipped swabs (CleanFoam® TX751B, Texwipe®), then 5 to 10 mL of water was added and placed with the swab in a sterile screw capped tube. For both the water and biofilm samples, 0.5 mL 0.1 N sodium thiosulfate (124270010, ACROS Organics™) was added to neutralize pre-existing chlorine-based chemical disinfectants. All samples were transported and kept at 5 ± 2°C and processed within 72 hours. The samples were vacuum filtered through 47 mm diameter 0.22 µm polycarbonate membrane (GTTP04700, Isopore™). The filtered residues were resuspended in 3 mL sterile distilled water. This sample suspension was used for further microbiological and molecular testing.
2.2 Water flow and temperature dataParameters related to water temperature and flow dynamics were monitored in the hospital water system using the Enware Smart® Flow monitoring system. Briefly, this monitoring system measures water system delivery temperatures using temperature probes located at the hot water inlet, cold water inlet, and outlet of the thermostatic mixing valves (TMV) and the hot water inlet and cold water inlet of hand basin faucets. Water flow was measured using flow switches located at the hot water inlet and cold water inlet of both the TMVs and hand basin faucets (Whiley et al., 2019). The temperature data of the hot water supply, cold water supply and outlet was collected for the entire duration of the sampling period. For analysis these measurements were separated into a period one week and one month prior to a water sampling event. In terms of flow regime, the total duration (hours) and number (counts) of flushing events for a period of one week and one month prior to sampling were recorded. The total duration (hours) of flushing events were divided into low and high flow regimes with categorization as: low flow regime; 0 to < 2 hours per month, and high flow regime; ≥ 2 to 40 hours per month.
2.3 Molecular analysisQuantification of Legionella spp. (16 rDNA gene) and L. pneumophila (mip gene) was performed using ISO/TS12869:2019 quantitative polymerase chain reaction (qPCR) assays (International Organization for Standardization, 2019). The 18S rDNA gene was amplified for the quantification of Acanthamoeba and Vermamoeba vermiformis (Qvarnstrom et al., 2006; Scheikl et al., 2016). Legionella spp. (GenBank Acc CP021281), L. pneumophila (GenBank Acc KR902705), Acanthamoeba castellanii (GenBank Acc U07413) and V. vermiformis (GenBank Acc KT185625) gBlocks gene fragments (IDT™) were used as a positive control and for the preparation of a standard curve using ten-fold serial dilutions. Using the Aquadien™ kit (3578121, BIO-RAD Laboratories Ltd.), genomic DNA was extracted from each water and biofilm sample before being subjected to a qPCR assay. The qPCR reaction mixture consisted of microbe-specific primers (Bio-Rad Laboratories Ltd.), 1X PCR reaction buffer (2X SsoAdvanced™ universal probes supermix:172-5281, Bio-Rad Laboratories Ltd.), and DNA template. To detect the potential presence of environmental inhibitors of the qPCR assays, both the purified and a one in ten dilution of extracted DNA was used as template (Hayes-Phillips et al., 2019; Nisar et al., 2022). Using a Rotor-Gene Q thermal cycler (Qiagen Ltd.), each template DNA was subjected to the qPCR assay in triplicate (Nisar et al., 2022). All fluorescence labelled probes and primers used in this study are presented in Table S1 (Supplementary Material).
2.4 Microbiological analysisIsolation of culturable Legionella spp. and L. pneumophila was performed in accordance with the standard guidelines (International Organization for Standardization, 2017; Standards Australia, 2017). Briefly, samples were heat treated (50 ± 1°C for 30 ± 2 minutes) and/or acid treated (HCl-KCl buffer treatment for 5 ± 0.5 minutes) to reduce the contamination of interfering microbes. An aliquot of treated sample was then spread on Legionella agar (CM1203, Oxoid Ltd.) supplemented with GVPC (glycine, vancomycin, polymyxin B and cycloheximide: SR0152, Oxoid Ltd.) and Legionella growth supplement (α-ketoglutarate, buffer/potassium hydroxide, ferric pyrophosphate, and L-cysteine: SR0110C, Oxoid Ltd.). The inoculated plates were incubated at 37 ± 1°C for 7 days and examined every day. Suspected Legionella-like colonies were counted from each plate and evaluated by Legionella latex agglutination test kit (DR0800, Oxoid Ltd.). This kit identifies genus Legionella and further characterizes various species and serogroups with overall 99% sensitivity and 100% specificity. Furthermore, all Legionella-like colonies were confirmed through Legionella spp. specific qPCR assays. To determine the heterotrophic plate counts (HPC), an aliquot from each sample was inoculated on R2A agar (CM0906, Oxoid Ltd.) and incubated at 35 ± 1°C. The colonies were counted after 2, 5 and 7 days of incubation. The results for Legionella spp. and heterotrophic bacteria were expressed in colony forming units (CFU)/L for water samples and CFU for the biofilm samples. Isolation of culturable FLA was performed by inoculating an aliquot of each sample on heat-inactivated (57°C for 45 minutes) Escherichia coli American Type Culture Collection 700891™ supplemented 1.5% non-nutrient agar (Eco-NNA: CM0003, Oxoid Ltd.) (Nisar et al., 2022). The plates were incubated at 25 ± 1°C for 14 days and amoebal growth was examined daily using an inverted light microscope (AMEFC4300, EVOS™ FL, Thermo Fisher Scientific). All monoxenic amoebae cultures were characterized by microscopic examination and sequence analysis of 18S rDNA gene.
2.5 Quantification of VBNC Legionella spp. and L. pneumophilaVBNC Legionella spp. and L. pneumophila were detected and quantified by flow cytometry-cell sorting and qPCR (VFC+qPCR) assay (Nisar et al., 2023). Briefly, 300 μL sample suspension was resuspended in 200 µL of filter sterilized staining buffer (0.01% Tween-20 and 1 mM EDTA in 1X PBS, pH 7.4 ± 0.1), followed by addition of 48 µM propidium iodide (PI) and 420 nM thiazole orange (TO) dyes (cell viability kit Cat # 349480, Becton Dickinson, Franklin Lakes, USA). The mixture was incubated at 5°C for 15 minutes. Then, using a FACS Aria Fusion instrument, (Becton Dickinson, Franklin Lakes, USA) cells were analyzed and segregated into dead (PI/TO), alive (potentially culturable: TO), and injured (potentially VBNC: PI/TO) cell populations. From each sample, the injured cell fraction was isolated and subjected to DNA extraction and quantification of Legionella spp. and L. pneumophila gene markers (Nisar et al., 2023).
2.6 Data analysisThe data are described in logarithmic form with base 10 (log10). The percentage of both bacterial and amoebae isolates was determined based on phases or contamination levels and plotted in Microsoft® Excel®. Statistical calculations were made using R studio (version 4.2.2) and graphically presented by using “ggplot2 (version 3.3.6)” package (Wickham, 2016). Briefly, the Shapiro-Wilk test was used to assess normality of analyzed quantitative parameters. For comparison of the means of the quantitative parameters (i.e., either GU or CFU of Legionella spp./L. pneumophila, HPC, Acanthamoeba and V. vermiformis), a non-parametric Kruskal-Wallis test was used. Finally, the non-parametric Spearman’s correlation (ρ) test was used to evaluate relationships among different variables (i.e., Legionella spp./L. pneumophila, HPC, Acanthamoeba and V. vermiformis). A statistically significant difference among the quantitative parameters was defined by p values of less than 0.05.
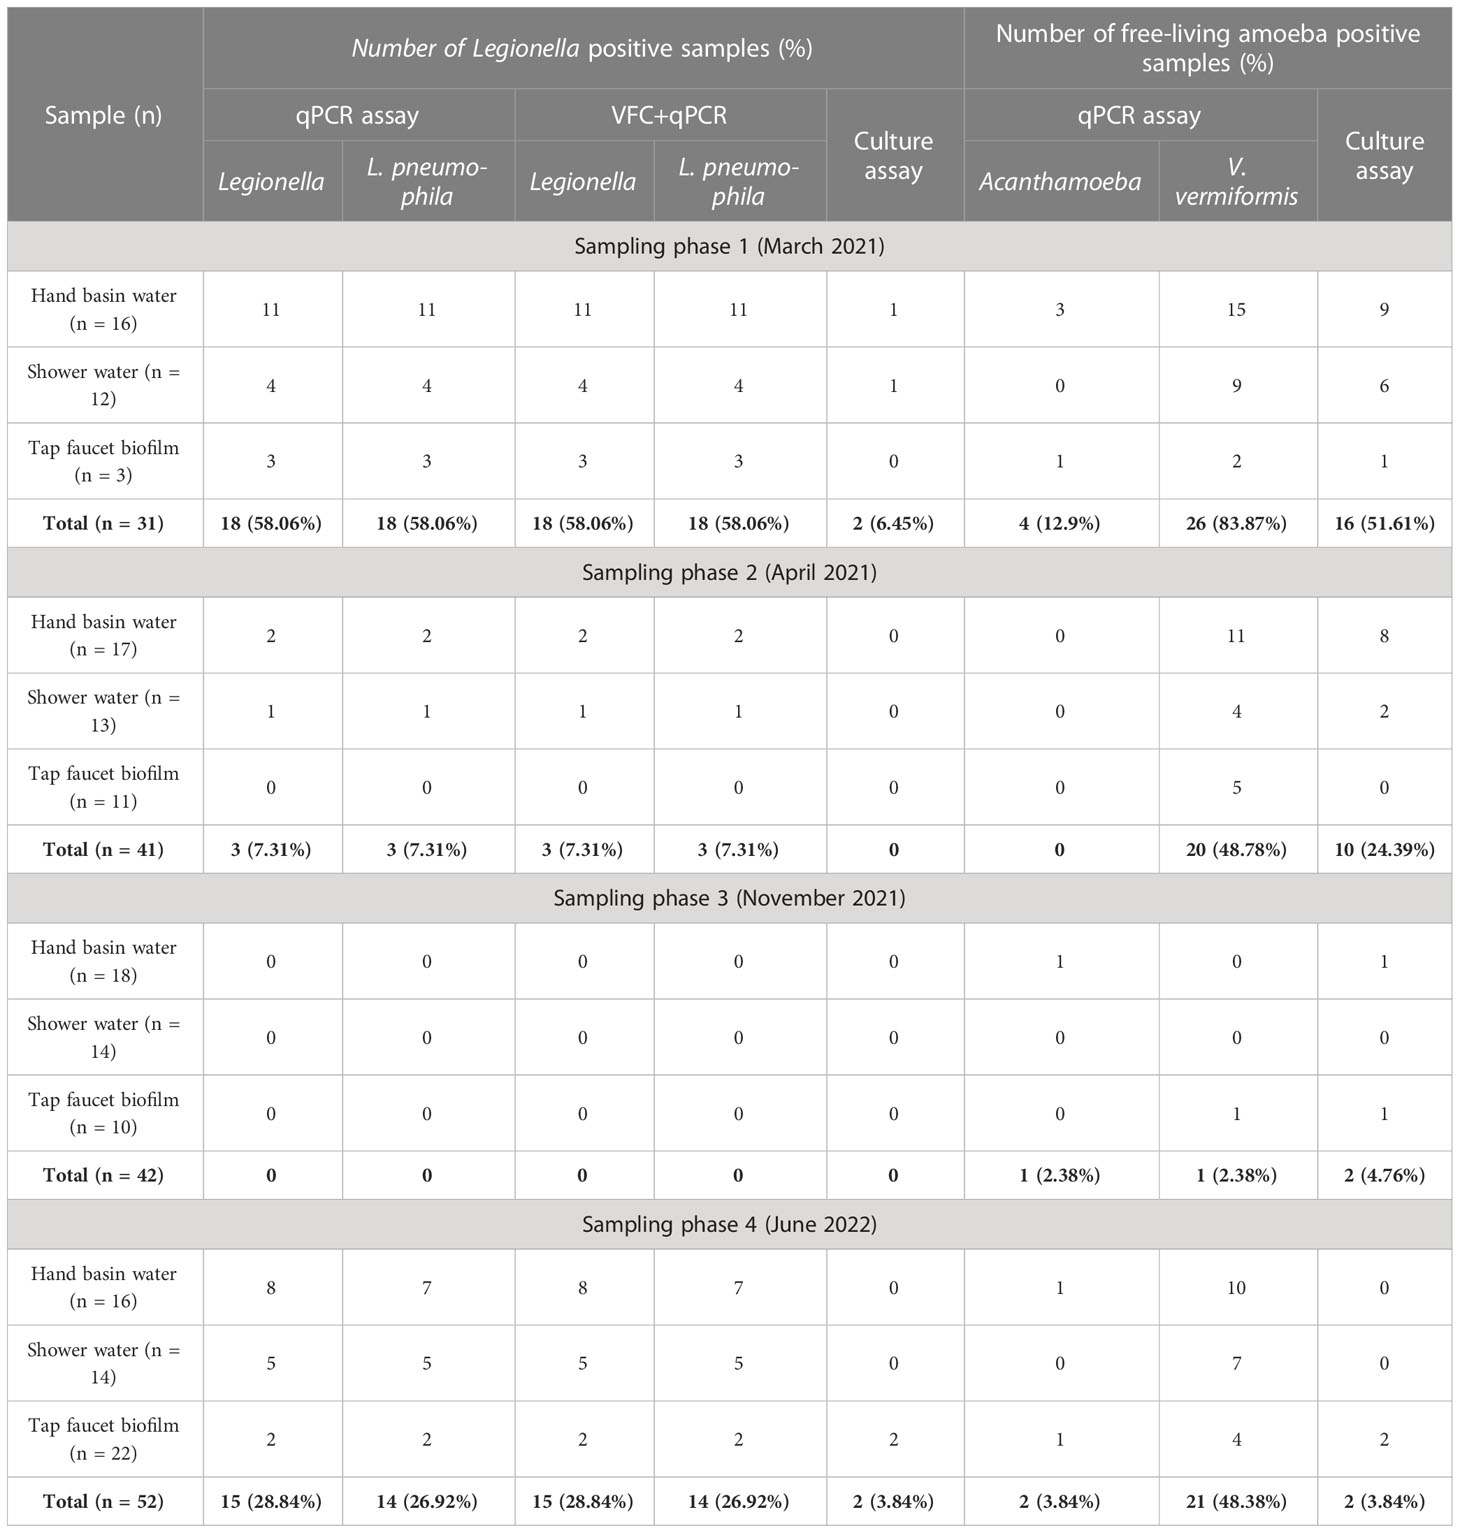
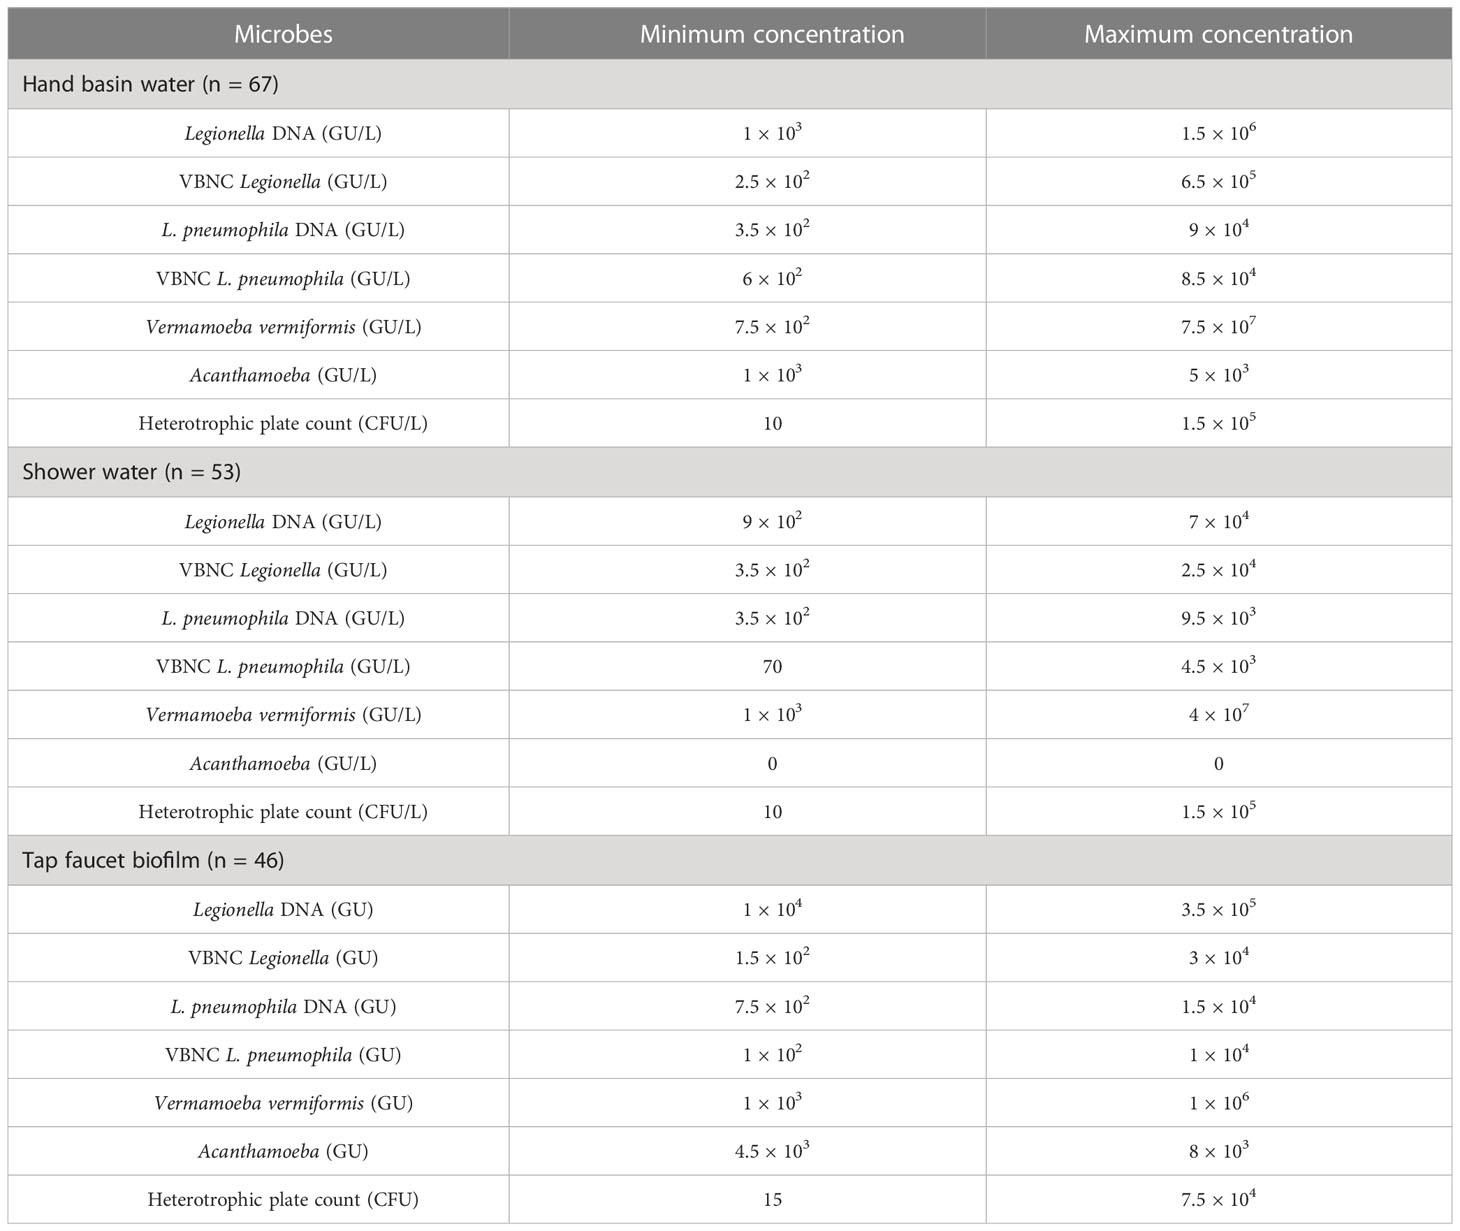
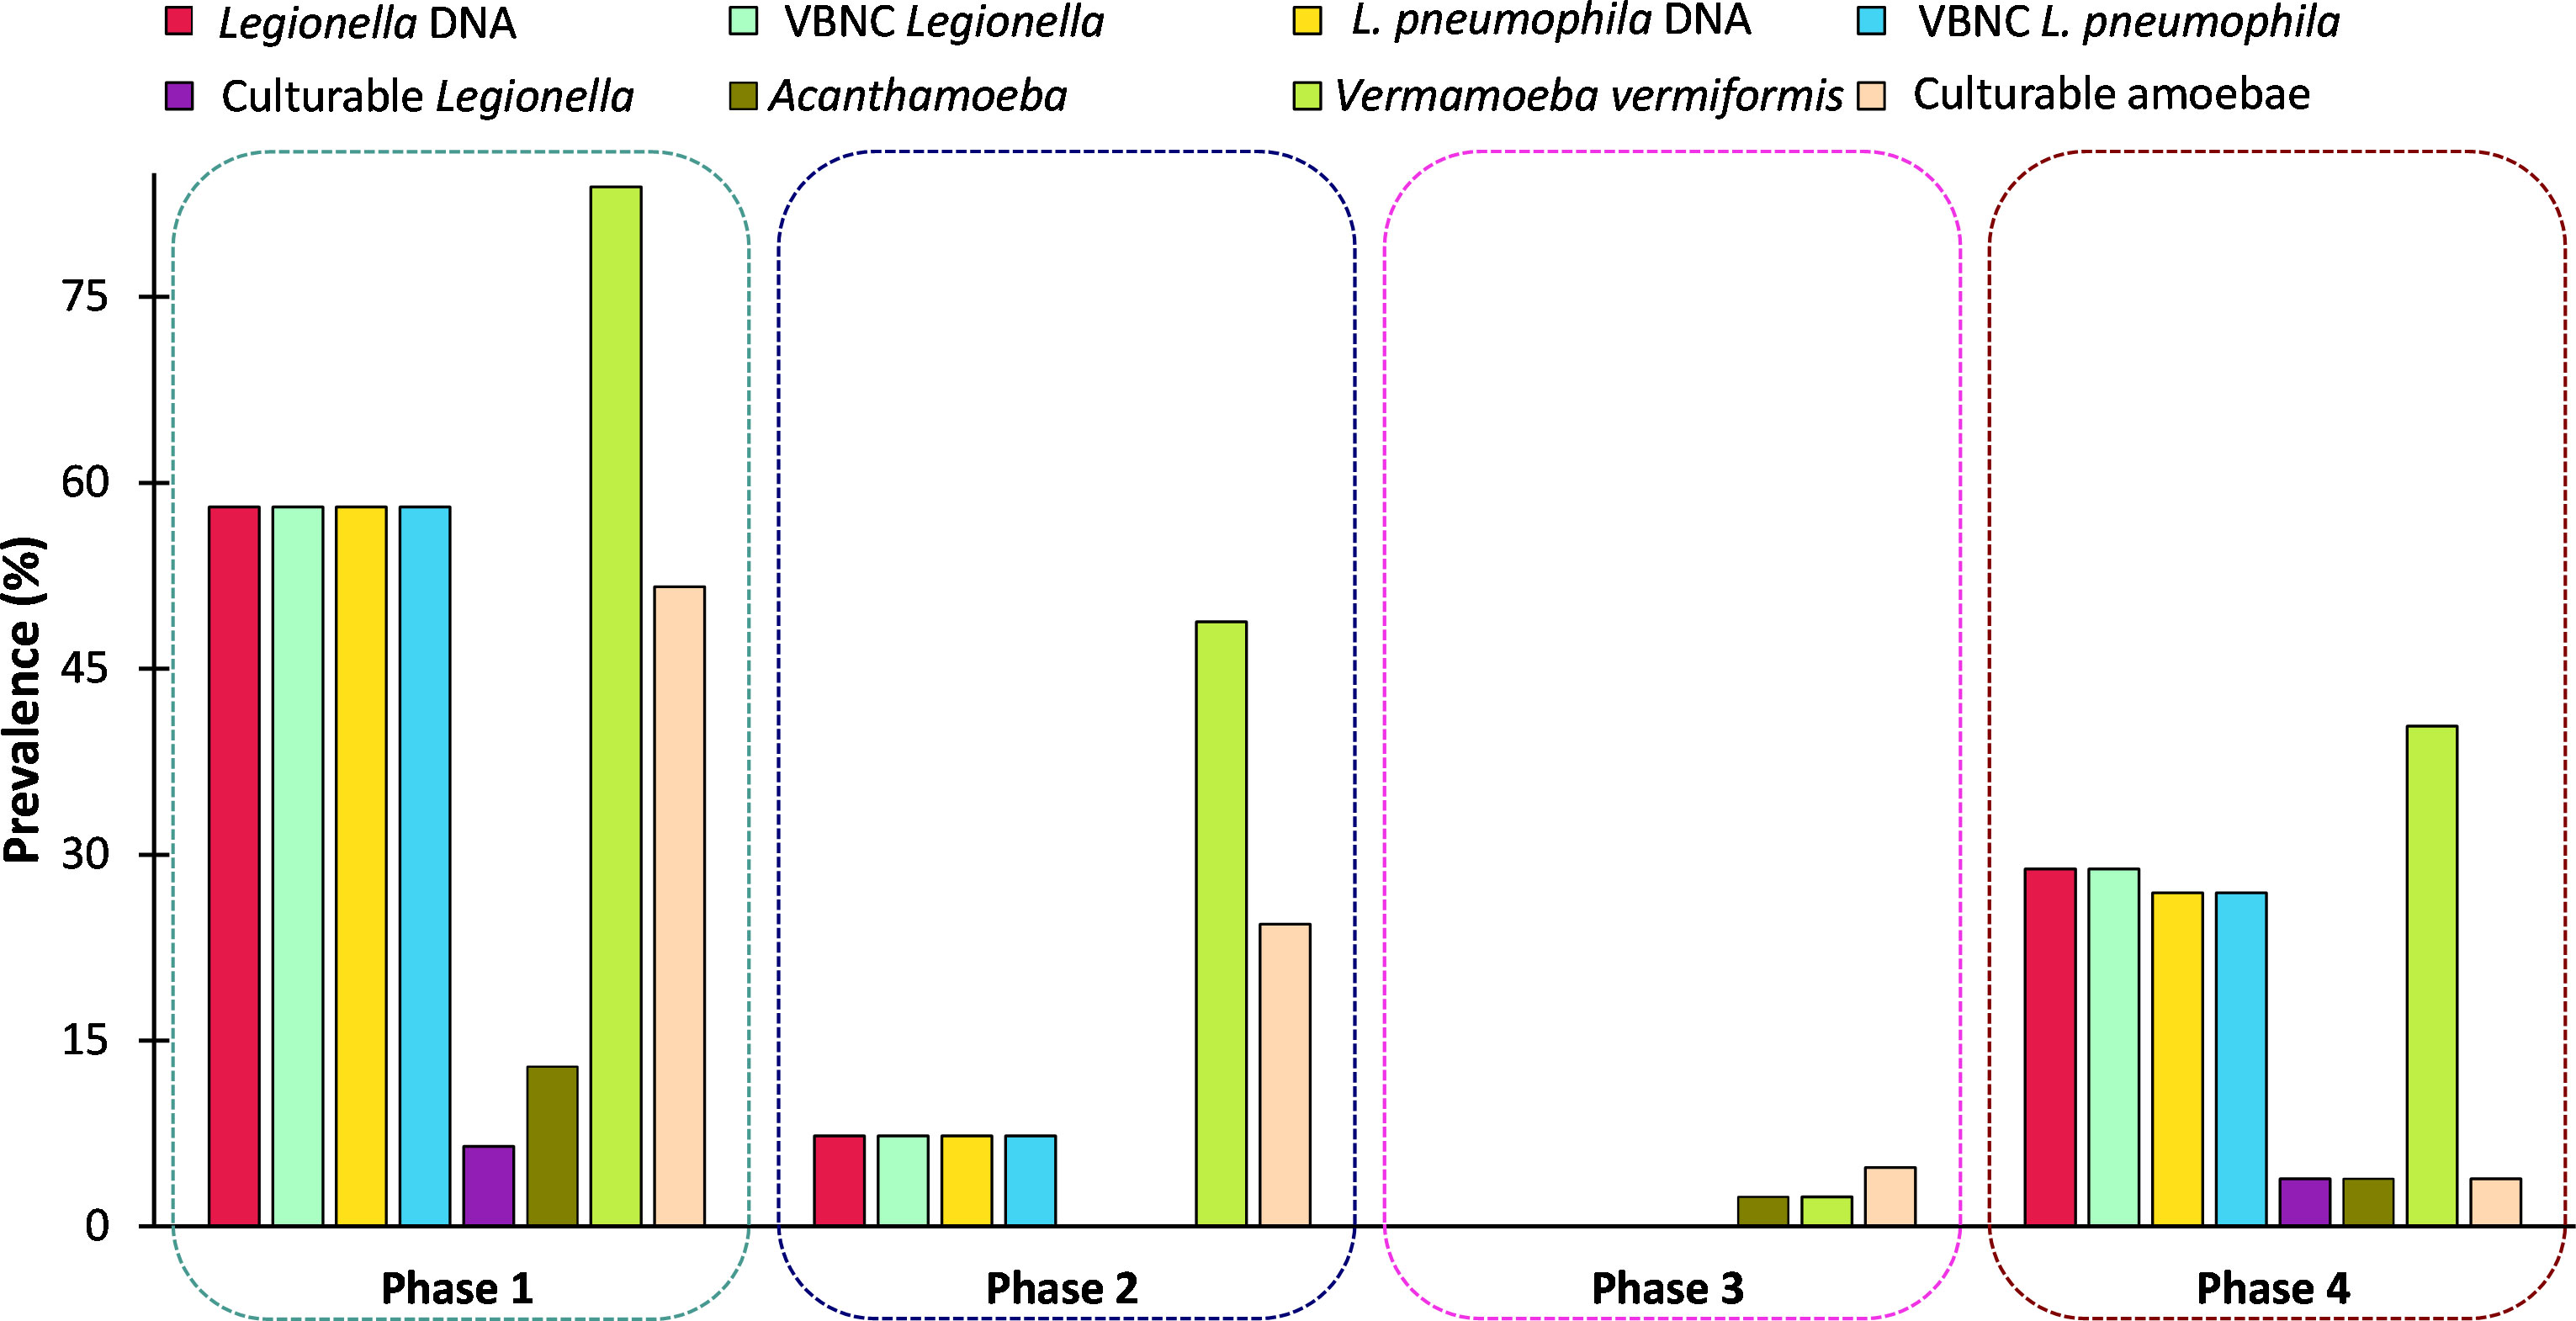
3 Results3.1 Occurrence of Legionella spp. and L. pneumophilaTable 1 presents an overview of the percentage of samples identified as positive for Legionella spp. and FLA using the different detection methods. All samples that were qPCR positive for Legionella spp. were also positive for FLA and VBNC Legionella. Specifically, 21.7% (n = 36/166) of total samples were positive for Legionella spp. DNA (16S rDNA gene) with a concentration range of 9 × 10² to 1.5 × 10⁶ GU (Tables 1, 2). L. pneumophila DNA (mip gene) was present in 21% samples (n = 35/166) with a concentration ranging from 3.5 × 10² to 9 × 10⁴ GU (Tables 1, 2). All L. pneumophila positive samples were also positive for Legionella spp. During phase 1, 58.06% (n = 18/31) of the samples tested positive for Legionella spp. DNA, whereas in the 2nd phase 7.31% (n = 3/41), and 4th phase 28.84% (n = 15/52) of the collected samples tested positive for Legionella spp. DNA (Figure 1). However, in phase 3 none of the samples were positive for either Legionella spp. or L. pneumophila DNA. Standard culturing demonstrated that only four samples (two in phase 1 and two in phase 4) were positive for culturable Legionella spp., which were identified as non-pneumophila Legionella using serology and qPCR. The VFC+qPCR assay demonstrated that all samples positive for either Legionella spp. or L. pneumophila DNA (according to the qPCR assay) also contained VBNC cells (Figure 1; Table 1). Therefore, of the 36 samples that were positive for VBNC Legionella spp., the standard microbiological culturing assay returned a false negative result for 32 of them (88.9%). For analysis, the VBNC Legionella spp. and L. pneumophila samples were categorized into three groups based on concentration i.e., low (< 103 GU/L), medium (≥ 103 to 104 GU/L) and high (> 104 GU/L) contamination. Based on this grouping it was found that in phase 1, 14.3% (n = 4/31) of the water samples were positive for high VBNC Legionella spp. contamination, whereas in the 4th phase 33.3% (n = 10/52) water samples were positive for high VBNC Legionella spp. contamination (Supplementary Material, Figure S1A). It was found that the lower level of VBNC L. pneumophila occurred more frequently in the samples collected during phase 1 (53.5%, n = 15/31) and 4 (23.3%, n = 7/52). Only 6.7% (phase 4: n = 2/52) water samples contained high levels of VBNC L. pneumophila contamination (Supplementary Material, Figure S1B). Based on sampling sites it was found that in hand basin water, 13.4% (n = 9/67) samples were positive for high VBNC Legionella spp. contamination, whereas in shower water, 9.4% (n = 5/53) samples were positive for high VBNC Legionella spp. contamination (Supplementary Material, Figure S2A). However, the majority of hand basin (22.4%, n = 15/67) and shower (15.1%, n = 8/53) water samples contained low levels of VBNC L. pneumophila contamination (Supplementary Material, Figure S2B). Overall, both qPCR and VFC+qPCR assays clearly demonstrated that the standard culturing assay is frequently unable to detect Legionella spp./L. pneumophila present in the hospital water system.
Table 1 Prevalence of Legionella spp., Vermamoeba vermiformis, Acanthamoeba and total free-living amoeba in a hospital water system using different detection methods.
Table 2 The minimum and maximum microbial concentrations present in the positive water and biofilm samples.
Figure 1 Prevalence (%) of Legionella spp. and free-living amoeba in a hospital water system. A total of 166 water (hand basin and shower) and biofilm (tap faucet) samples were collected in March 2021 (Phase 1), April 2021 (Phase 2), November 2021 (Phase 3), and June 2022 (Phase 4). Total amounts of Legionella spp./L. pneumophila, Acanthamoeba, and Vermamoeba vermiformis were detected and quantified by qPCR assays. Culturable Legionella spp. and amoebae were detected by standard microbiological culturing procedures. VBNC Legionella spp. and VBNC L. pneumophila were detected and quantified by flow cytometry-cell sorting and qPCR assay. The p values are: *p ≤ 0.05, **p ≤ 0.01, and ***p ≤ 0.001.
3.2 Occurrence of heterotrophic bacteria and FLABoth the hand basin and shower water samples contained HPC counts ranging from 10 to 1.5 × 10⁵ CFU/L (Table 2). In the biofilm samples the HPC load ranged from 15 to 7.5 × 10⁴ CFU/sample (Table 2). In case of FLA, the V. vermiformis gene marker was present in 40.9% (n = 68/166) of samples with concentrations ranging from 7.5 × 10² to 7.5 × 10⁷ GU (Tables 1, 2). The Acanthamoeba gene marker was detected only in hand basin water (3.01%, n = 5/166) and biofilm samples (1.2%, n = 2/166) with a range of 1 × 10³ to 8 × 10³ GU (Tables 1, 2). Culturable amoebae were identified in 18.1% (n = 30/166) samples; however, due to fungal overgrowth 13 isolates were unable to develop monoxenic cultures, of these 13, five isolates showed acrasid amoebae-like morphology. Only 17 isolates developed monoxenic cultures which were further characterized on the basis of cellular morphology and sequence analysis of 18S rDNA gene. Light microscopy revealed that isolates harbored monotactic morphotype and developed spherical cysts consisting of distinct inner and outer walls. Based on 18S rDNA sequencing, all these monoxenic isolates were identified as V. vermiformis.
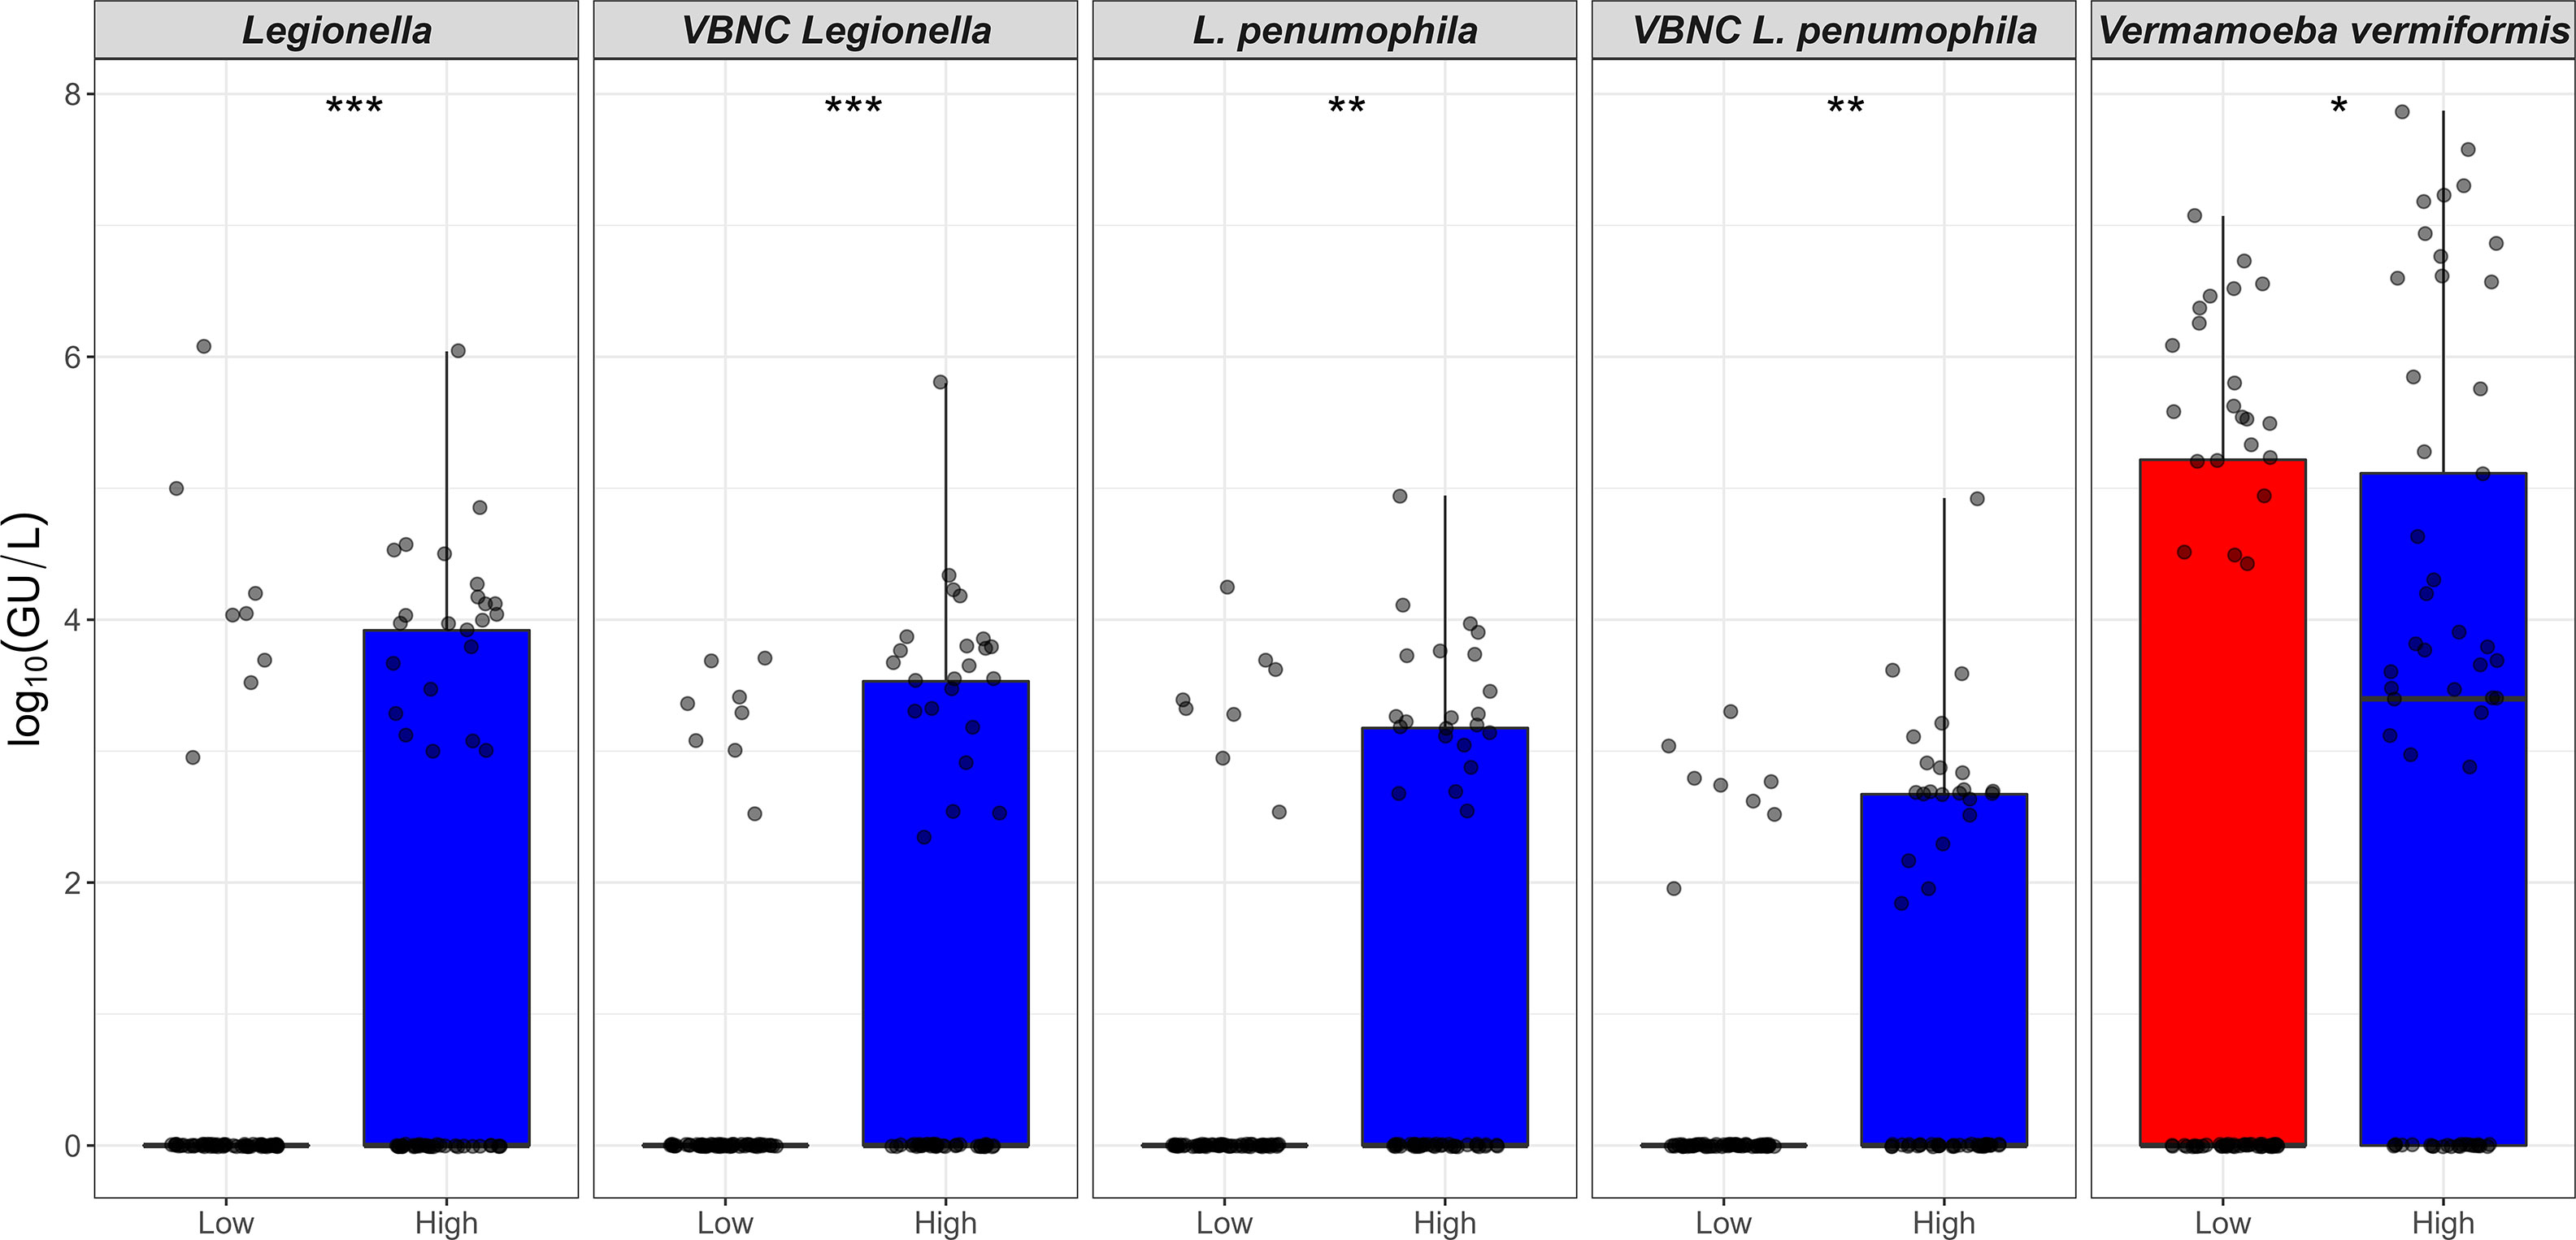
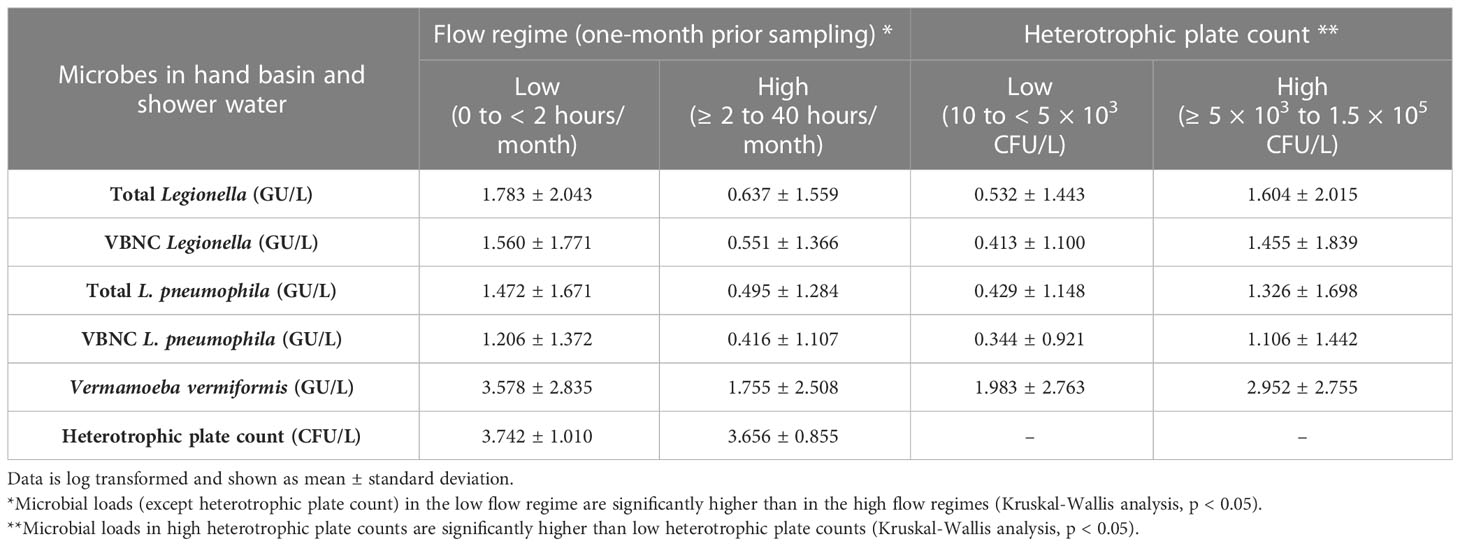
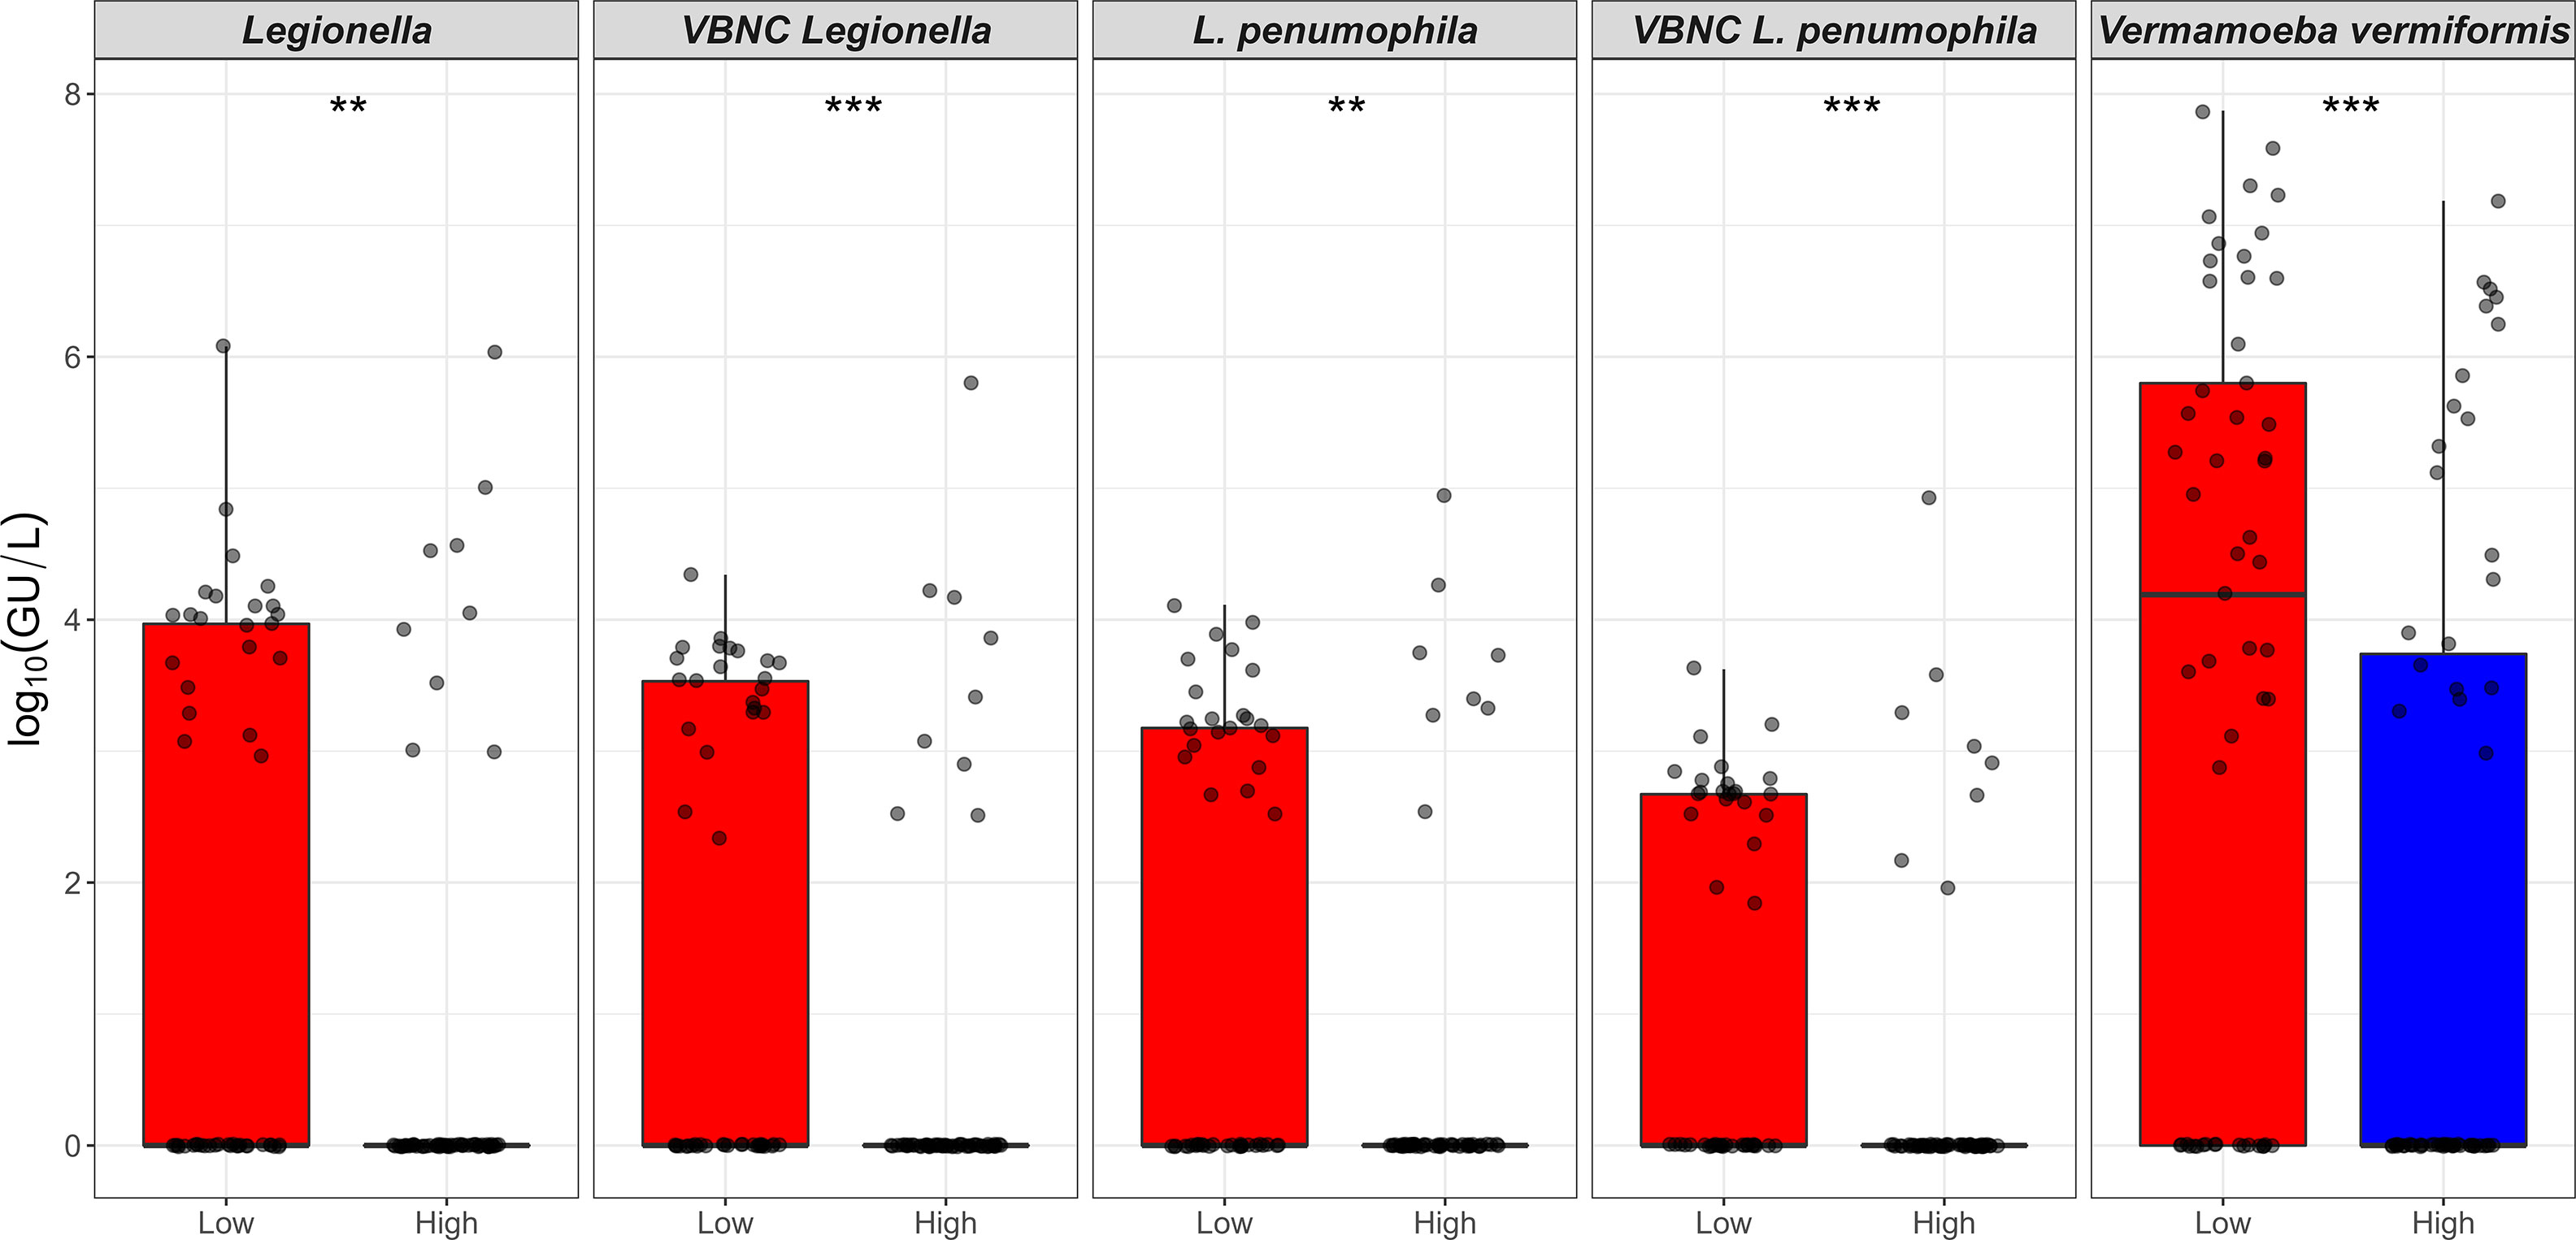
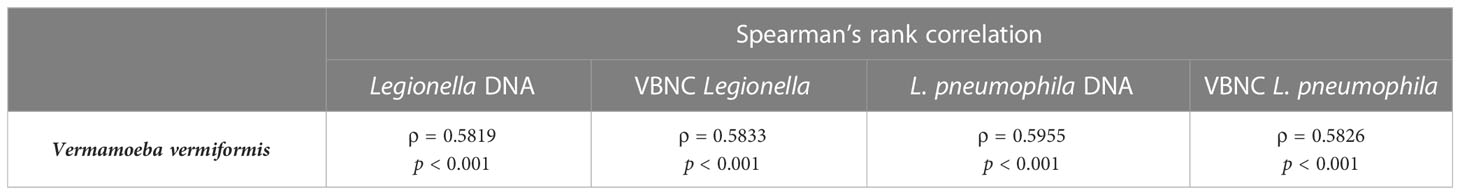
3.3 Relationship among Legionella spp., HPC, and FLAAll shower and hand basin water samples were classified into two groups based on the HPC levels i.e., low (10 to < 5 × 10³ CFU/L) and high (≥ 5 × 10³ CFU/L) contamination. Kruskal-Wallis analysis demonstrated that quantity of both Legionella spp. DNA and VBNC Legionella spp. were significantly (p < 0.001) higher in water samples with high levels of HPC load (Table 3; Figure 2). Similarly, water samples having greater levels of HPC load harbored significantly higher concentrations of L. pneumophila DNA (Kruskal-Wallis test, p < 0.01), VBNC L. pneumophila (Kruskal-Wallis test, p < 0.01), and V. vermiformis (Kruskal-Wallis test, p < 0.05) (Tables 3; Figure 2). Furthermore, all samples characterized as positive for Legionella spp./L. pneumophila (DNA, culturable, and VBNC cells) were also positive for either the V. vermiformis gene marker or culturable amoebae. Furthermore, Spearman’s analysis demonstrated both Legionella spp./L. pneumophila DNA and Legionella spp./L. pneumophila VBNC cells were positively correlated (p < 0.001) with V. vermiformis (Table 4). Overall, these results suggested that in hospital water system, high levels of HPC load and V. vermiformis are positively associated with both Legionella spp./L. pneumophila DNA and VBNC cells.
Table 3 Effect of flow regime (flushing duration one-month prior to sampling) and heterotrophic plate counts of hand basin and shower water microbes.
Figure 2 Relationship between the heterotrophic plate count and Legionella spp./Vermamoeba vermiformis. X-axis represents HPC level that is categorised into low (10 to < 5 × 10³ CFU/L) and high (≥ 5 × 10³ to 1.5 × 10⁵ CFU/L) contamination. Y-axis represents log10(GU/L) of Legionella spp., VBNC Legionella spp., L. pneumophila, VBNC L. pneumophila, and V. vermiformis. The p values are: **p ≤ 0.01, and ***p ≤ 0.001.
Table 4 Correlation between Legionella spp. and Vermamoeba vermiformis in hand basin and shower water samples.
3.4 Influence of flow regimes and on Legionella spp., HPC, and FLAThe total duration (hours) of flushing events for one month prior to sampling, was categorized into: low (0 to < 2 hours/month) and high (≥ 2 to 40 hours/month) flow regimes. The Kruskal-Wallis analysis indicated that the concentrations of Legionella spp. DNA (p < 0.01), L. pneumophila DNA (p < 0.01), VBNC Legionella spp. (p < 0.001), VBNC L. pneumophila (p < 0.001) and V. vermiformis DNA (p < 0.05), were all higher in low flow regimes compared with high flow regimes (Table 3; Figure 3). When the total duration (hours) of flushing events for only one week prior to sampling was examined, no association was observed with any of the microbial concentrations measured. The HPC load did not show any measurable difference in the low vs high flow regimes either one month or one week prior to sampling (Table 3). In contrast with the total flow duration, the total number of flow counts (number of flushing events) for either one week or one month prior to sampling was not associated with any significant change in any of the microbial concentrations measured. In conclusion, a month of reduced usage (< 2 hours water flushing per month) supports the proliferation of Legionella spp./L. pneumophila and V. vermiformis in hospital water system.
Figure 3 Relationship between intermittent water usage and the presence of Legionella spp./Vermamoeba vermiformis. X-axis represents total duration (hours) of flushing events recorded for one-month prior to sampling. Flushing was categorized into low; 0 to < 2 hours, and high flow regime; ≥ 2 to 40 hours. Y-axis represents log10(GU/L) of Legionella spp., VBNC Legionella spp., L. pneumophila, VBNC L. pneumophila, and V. vermiformis.
3.5 Influence of water temperature and on Legionella spp., HPC, and FLAThe water outlets (hand basins and showers) of the hospital water system received water from both the cold water supply and hot water supply (Supplementary Material; Figures S3, S5). The temperature data for each sample location were averaged over one week and one month prior to sample collection (Supplementary Material; Figures S3, S5). The average temperatures (mean ± SD) measured from the cold water supply were (21.78 ± 1.98°C per week and 22.01 ± 1.69°C per month), hot water supply (23.64 ± 3.15°C per week and 23.69 ± 3.08°C per month) and outlet water (23.74 ± 2.43°C per week and 23.76 ± 1.95°C per month). No relationships between microbial concentration and water temperatures were observed. This is likely due to the average water temperature being similar for both hot and cold water supplies, with increases in hot water temperature occurring through hot water usage having a limited effect on the overall average temperature due to the periods of stagnation and inactivation occurring in between usages (Supplementary Material, Figures S4, S6).
4 DiscussionIn this study, it was identified that 31.3% (n = 21/67) hand basin water, 18.9% (n = 10/53) shower water and 10.9% (n = 5/46) biofilm samples were positive for either Legionella spp. or L. pneumophila gene marker (Table 1). According to the literature, the majority of engineered water systems of hospital and healthcare facilities are contaminated with Legionella spp. or L. pneumophila. In Poland, 74.7% of water samples from hospitals and other large building structures tested positive for Legionella spp., and L. pneumophila sg2-14 was the most prevalent serogroup (Sikora et al., 2015). A similar study conducted in Hungary that examined water samples from healthcare facilities and other buildings showed that 60% samples were positive for Legionella spp. (predominantly L. pneumophila sg2-14) (Barna et al., 2016). A study conducted in 20 different hospitals in Spain reported that 37.2% of water samples were colonized with L. pneumophila sg1 and L. pneumophila sg2-14 (Sabrià et al., 2004). In Taiwan, 63% of samples collected from hospital water systems tested positive for Legionella spp. and L. pneumophila sg1 (Yu et al., 2008). Comprehensive national surveillance studies conducted in 13 different states of the USA reported that 70% of hospital water systems were contaminated with Legionella spp. (Stout et al., 2007). A recent study conducted in Australia detected 41% samples of water and biofilms from hospital and residential buildings were colonized with Legionella spp. (Nisar et al., 2022). The lower Legionella spp. prevalence in this study could be due to the fact this was a case study of a single hospital that has been proactive in their water quality risk management compared with other hospitals.
All previous studies on Legionella spp. in engineered water systems have either used standard culturing or a qPCR assay to detect Legionella spp, and none have screened for the presence of VBNC Legionella spp. In the present study, VFC+qPCR assay showed that all water and biofilm samples positive for Legionella spp./L. pneumophila gene marker also contained VBNC cells. The quantity of total Legionella spp. detected by qPCR assay was greater than VBNC cells, which clearly highlights that the hospital water system harbored both dead and VBNC Legionella spp. (Figure 1). Our findings suggest that the standard Legionella spp./L. pneumophila guidelines should include quantification of VBNC cells.
Currently, there is still much debate around the exact infective dose for Legionella spp. (Bartram et al., 2007). An analysis by Sikora et al. (2015) estimated that legionellosis outbreaks may occur sporadically when water is contaminated with 103 to 105 CFU/L and when Legionella spp. counts exceed 105 CFU/L an outbreak of legionellosis can occur (Sikora et al., 2015). However, these estimates are based on the number of culturable cells (CFU/L), so it is challenging to determine the relative risk associated with the concentrations of VBNC cells (GU/L). In contrast with culturable Legionella spp., VBNC cells infect with lower pathogenicity and take a longer time to infect amoebae (Nisar et al., 2023). Therefore, future research is needed to determine the infectious dose of VBNC Legionella spp. to understand the role of VBNC Legionella spp. in nosocomial infections and the public health risk posed by this concentration of VBNC Legionella spp. in engineered water systems.
In hospital water systems, Legionella infects and survives within protozoan hosts, including Acanthamoeba and V. vermiformis (Nisar et al., 2020a). In this study, it was identified that V. vermiformis (gene marker and culturable) was the most commonly identified amoebae associated with Legionella spp. prevalent in the water and biofilm samples (Table 4). This is supported by previous studies that have demonstrated V. vermiformis to be widely present in potable water (Kuiper et al., 2006; Nisar et al., 2020a). Similarly, microbiome analysis of potable water also showed V. vermiformis as the most prevalent protozoa (Delafont et al., 2013; Delafont et al., 2016). Water samples of dental units of Italian hospitals were found to be highly contaminated with V. vermiformis (60%) (Spagnolo et al., 2019). Similarly, a study conducted in hospitals of South Africa identified that 69% of samples were positive for V. vermiformis and 30.6% for Acanthamoeba (Muchesa et al., 2018). A recent study conducted in Australia examined water and biofilm samples from hospital and residential buildings showed the presence of FLA in 69% of the samples. It was also found that in all tested samples, V. vermiformis (55%) was the more frequently detected FLA (Nisar et al., 2022). In comparison with Acanthamoeba, V. vermiformis is more sensitive to disinfection treatments (Nisar et al., 2020a). Therefore, high levels of V. vermiformis could be attributed to decay and lower levels of residual chemical disinfectants in the hospital water system.
To our knowledge HPC loads have not been linked to any known legionellosis outbreak and the relationship between HPC levels and opportunistic premise plumbing pathogens is still unclear (Bartram et al., 2003). The SA Health, (2013) use HPC load as an indicator of water quality and recommend that if HPC load is ≥ 102 CFU/mL in warm water systems then the disinfection procedures for engineered water system should be considered. In this study it was found that the water samples with high HPC loads (≥ 5 × 10³ CFU/L) contained high quantities of both Legionella spp. and L. pneumophila (Figure 2; Table 3). These results are in accordance with a previous study conducted on engineered water systems of residential buildings, which also showed a positive relationship between HPC levels and concentrations of Legionella spp. (Ley et al., 2020). Similarly, it was also found that samples with high HPC loads harbored high levels of V. vermiformis (Figure 2; Table 3). The relationship between bacteria and FLA consists of three major types of interactions i.e., mutualism, parasitism, and predation (Shi et al., 2021). Generally, FLA are considered natural predators of bacteria, which could account for the high levels of V. vermiformis observed in the presence of high levels of HPC (Rodriguez-Zaragoza et al., 2005). It was also identified that all samples positive for Legionella spp./L. pneumophila were also positive for FLA. Furthermore, Spearman’s analysis demonstrated a strong positive correlation between Legionella spp./L. pneumophila and V. vermiformis. In engineered water systems, FLA exist in both trophozoite (metabolically active) and cyst (dormant) states (Zhang and Lu, 2021). The trophozoites support intracellular proliferation of Legionella spp. and transformation of VBNC Legionella spp. into a culturable state (Solomon et al., 2000; Shadrach et al., 2005; Berk et al., 2008; Watanabe et al., 2016; Boamah et al., 2017). Amoebae cysts protect intracellular Legionella spp. from prolonged chemical and physical disinfection treatments (Dobrowsky et al., 2016; Boamah et al., 2017). The significant role amoebae play in Legionella spp. survival in potable water systems suggests that guidelines for the control of Legionella spp. must consider acceptable limits of amoeba within these systems as a measure to control Legionella spp. concentrations.
Water stagnation within building distribution systems promotes the accumulation of biomass, decay of chemical disinfectants, and alters the water quality (Bedard et al., 2018). Therefore, this study investigated the effect of temporary stagnation induced by intermittent flushing and water usage on Legionella spp., with a special focus on VBNC Legionella spp. It was found that an increase in temporary stagnation once a month prior to sampling significantly (p < 0.01) increased the quantity of total Legionella spp./L. pneumophila and VBNC Legionella spp./L. pneumophila population; however, increased stagnation one week prior to sampling was not associated with increased risk (Figure 3; Table 3). This supports guidelines that recommend routine flushing of outlets to manage Legionella spp. within engineered water systems (Enhealth, 2015). To our knowledge, this is first study in which the effect of temporary stagnation, HPC load, and V. vermiformis on VBNC Legionella spp./L. pneumophila in hospital water systems has been investigated. This study averaged water temperatures across one week or one month prior to sampling for both the hot and cold water pipelines/outlets. As a result water temperatures were more similar to each other than anticipated. This is likely to explain the lack of a statistically significant difference in Legionella concentrations associated with different temperatures. Future research with a larger dataset is needed to explore the temperature relationship further.
5 ConclusionIn building plumbing systems, temporary stagnation arising through intermittent usage causes water quality to deteriorate. This study identified that temporary stagnation for over a month promotes the persistence of VBNC Legionella spp./L. pneumophila. Similarly, FLA and heterotrophic bacteria present in this temporary stagnant environment positively interact with Legionella spp./L. pneumophila. Therefore, temporary stagnation, FLA and heterotrophic bacteria must be managed for the proper control and prevention of LD. This study also showed that the standard microbiological culture method used to detection Legionella spp. returned a false negative result for 88% of the VBNC Legionella spp. positive samples. As all samples positive for VBNC Legionella spp. were also qPCR positive, this suggests that qPCR may be a more appropriate detection method for routine surveillance. However, future research is needed to investigate the concentrations of VBNC Legionella spp. that pose a risk to public health to enable interpretation of these results to inform improved Legionella spp. guidelines.
Data availability statementThe original contributions presented in the study are included in the article/Supplementary Material. Further inquiries can be directed to the corresponding author.
Author contributionsMN and HW conceived and designed research. MN performed the experiments. GB assisted in the flow cytometry. KR, MB, HW and RB provided technical assistance. JX and JH assisted in sampling and data collection. MN and HW drafted and edited the manuscript. HW, KR, MB, RB, GB, JX, and JH corrected and contributed to the manuscript. All authors approved of the final manuscript.
FundingThe authors declare that this study received no funding. Authors JH and JX are employed by Enware Pty Ltd. Enware Pty Ltd provided in-kind support that included JH and JX allocated time, access to the water flow and temperature data collected from their Smart Flow® monitoring system and access to water and biofilm samples for analysis.
AcknowledgmentsMN is the recipient of a doctoral scholarship by the Australian Government Research Training Program Scholarship (AGRTP). The experimental work was supported by the Flinders University Biofilm Research and Innovation Consortium.
Conflict of interestAuthors JH and JX are employed by Enware Pty Ltd.
The remaining authors declare that the research was conducted in the absence of any commercial or financial relationships that could be construed as a potential conflict of interest.
Publisher’s noteAll claims expressed in this article are solely those of the authors and do not necessarily represent those of their affiliated organizations, or those of the publisher, the editors and the reviewers. Any product that may be evaluated in this article, or claim that may be made by its manufacturer, is not guaranteed or endorsed by the publisher.
Supplementary materialThe Supplementary Material for this article can be found online at: https://www.frontiersin.org/articles/10.3389/fcimb.2023.1190631/full#supplementary-material
ReferencesBarna, Z., Kádár, M., Kálmán, E., Scheirich Szax, A., Vargha, M. (2016). Prevalence of Legionella in premise plumbing in Hungary. Water Res. 90, 71–78. doi: 10.1016/j.watres.2015.12.004
PubMed Abstract | CrossRef Full Text | Google Scholar
Bartram, J., Chartier, Y., Lee, J. V., Pond, K., Surman-Lee, S. (2007). Legionella and the prevention of legionellosis (United States: World Health Organization).
Bartram, J., Cotruvo, J., Exner, M., Fricker, C., Glasmacher, A. (2003). Heterotrophic plate counts and drinking-water safety (United States: World Health Organization).
Bedard, E., Laferriere, C., Deziel, E., Prevost, M. (2018). Impact of stagnation and sampling volume on water microbial quality monitoring in large buildings. PloS One 13, e0199429. doi: 10.1371/journal.pone.0199429
PubMed Abstract | CrossRef Full Text | Google Scholar
Berk, S. G., Faulkner, G., Garduno, E., Joy, M. C., Ortiz-Jimenez, M. A., Garduno, R. A. (2008). Packaging of live Legionella pneumophila into pellets expelled by Tetrahymena spp. does not require bacterial replication and depends on a Dot/Icm-mediated survival mechanism. Appl. Environ. Microbiol. 74, 2187–2199. doi: 10.1128/AEM.01214-07
PubMed Abstract | CrossRef Full Text | Google Scholar
Boamah, D. K., Zhou, G., Ensminger, A. W., O’connor, T. J. (2017). From many hosts, one accidental pathogen: the diverse protozoan hosts of Legionella. Front. Cell Infect. Microbiol. 7, 477. doi: 10.3389/fcimb.2017.00477
PubMed Abstract | CrossRef Full Text | Google Scholar
Cassell, K., Gacek, P., Rabatsky-Ehr, T., Petit, S., Cartter, M., Weinberger, D. M. (2019). Estimating the true burden of legionnaires’ disease. Am. J. Epidemiol. 188, 1686–1694. doi: 10.1093/aje/kwz142
PubMed Abstract | CrossRef Full Text | Google Scholar
Centers for Disease Control and Prevention. (2019). CDC Sampling procedure and potential sampling sites. (United States).
Centers for Disease Control and Prevention. (2022). Nationally notifiable infectious diseases and conditions, united states: weekly tables. (United States).
Delafont, V., Bouchon, D., Héchard, Y., Moulin, L. (2016). Environmental factors shaping cultured free-living amoebae and their associated bacterial community within drinking water network. Water Res. 100, 382–392. doi: 10.1016/j.watres.2016.05.044
PubMed Abstract | CrossRef Full Text | Google Scholar
Delafont, V., Brouke, A., Bouchon, D., Moulin, L., Héchard, Y. (2013). Microbiome of free-living amoebae isolated from drinking water. Water Res. 47, 6958–6965. doi: 10.1016/j.watres.2013.07.047
PubMed Abstract | CrossRef Full Text | Google Scholar
Dietersdorfer, E., Kirschner, A., Schrammel, B., Ohradanova-Repic, A., Stockinger, H., Sommer, R., et al. (2018). Starved viable but non-culturable (VBNC) Legionella strains can infect and replicate in amoebae and human macrophages. Water Res. 141, 428–438. doi: 10.1016/j.watres.2018.01.058
PubMed Abstract | CrossRef Full Text | Google Scholar
Dobrowsky, P. H., Khan, S., Cloete, T. E., Khan, W. (2016). Molecular detection of Acanthamoeba spp., Naegleria fowleri and Vermamoeba (Hartmannella) vermiformis as vectors for Legionella spp. in untreated and solar pasteurized harvested rainwater. Parasit Vectors 9, 539. doi: 10.1186/s13071-016-1829-2
PubMed Abstract | CrossRef Full Text | Google Scholar
Enhealth. (2015). Guideline for legionella control in the operation and maintenance of water distribution systems in health and aged care facilities (Australia: Australian Government).
Fields, B. S., Benson, R. F., Besser, R. E. (2002). Legionella and legionnaires’ disease: 25 years of investigation. Clin. Microbiol. Rev. 15, 506–526. doi: 10.1128/CMR.15.3.506-526.2002
PubMed Abstract | CrossRef Full Text | Google Scholar
Hayes-Phillips, D., Bentham, R., Ross, K., Whiley, H. (2019). Factors influencing Legionella contamination of domestic household showers. Pathogens 8, 27. doi: 10.3390/pathogens8010027
PubMed Abstract | CrossRef Full Text | Google Scholar
International Organization for Standardization. (2017). ISO11731:2017-05 water quality - enumeration of legionella. (Geneva, Switzerland).
International Organization for Standardization. (2018). ISO 5667-3:2018 water quality - sampling: preservation and handling of water samples. (Geneva, Switzerland).
International Organization for Standardization. (2019). ISO/TS12869:2019 water quality - detection and quantification of legionella spp. and/or legionella pneumophila by concentration and genic amplification by quantitative polymerase chain reaction (qPCR). (Geneva, Switzerland).
Kanarek, P., Bogiel, T., Breza-Boruta, B. (2022). Legionellosis risk-an overview of Legionella spp. habitats in Europe. Environ. Sci. pollut. Res. Int. 29, 76532–76542. doi: 10.1007/s11356-022-22950-9
PubMed Abstract | CrossRef Full Text | Google Scholar
Khodr, A., Kay, E., Gomez-Valero, L., Ginevra, C., Doublet, P., Buchrieser, C., et al. (2016). Molecular epidemiology, phylogeny and evolution of Legionella. Infect. Genet. Evol. 43, 108–122. doi: 10.1016/j.meegid.2016.04.033
PubMed Abstract | CrossRef Full Text | Google Scholar
Kirschner, A. K. T. (2016). Determination of viable Legionellae in engineered water systems: do we find what we are looking for? Water Res. 93, 276–288. doi: 10.1016/j.watres.2016.02.016
PubMed Abstract | CrossRef Full Text | Google Scholar
Kuiper, M. W., Valster, R. M., Wullings, B. A., Boonstra, H., Smidt, H., van der Kooij, D. (2006). Quantitative detection of the free-living amoeba Hartmannella vermiformis in surface water by using real-time PCR. Appl. Environ. Microbiol. 72, 5750–5756. doi: 10.1128/AEM.00085-06
PubMed Abstract | CrossRef Full Text | Google Scholar
Ley, C. J., Proctor, C. R., Singh, G., Ra, K., Noh, Y., Odimayomi, T., et al. (2020). Drinking water microbiology in a water-efficient building: stagnation, seasonality, and physicochemical effects on opportunistic pathogen and total bacteria proliferation. Environ. Sci: Water Res. Technol. 6, 2902–2913. doi: 10.1039/D0EW00334D
留言 (0)