


記住我


According to the World Health Organization, glioma is one of the most prevalent malignant tumors of the brain and is categorized as grades 1, 2, 3, or 4; grades 1 and 2 are low grade glioma (LGG), while grades 3 and 4 are high grade glioma (glioblastoma multiforme, GBM) (1, 2). 30% of all primary brain and spinal cord tumors are glioma, which make up more than 80% of all malignant brain tumors and are clinically very likely to be fatal (3). Glioma currently have a poor clinical prognosis upon presentation. Despite advancements in chemotherapeutic agents, radiation, and surgical methods for resecting tumors, the overall survival of glioma patients is still not encouraging (4). After conventional surgery, radiation and chemotherapy, glioma patients have a median survival period of about 14 months and an estimated 5-year survival rate of about 9.8% (5). So far, immunotherapy for glioma is the more effective treatment modality. Immune checkpoint inhibitor therapy allows effector T cells to reactivate and exert cytotoxicity on tumor cells through a combination of specific antibodies and checkpoint molecules (10.3389/fimmu.2020.578877). Therefore, we need to search for quality immune checkpoints to support the efficacy of immunotherapy for glioma.
Telomere is a region at the end of a chromosome that is composed of two parts, the repetitive TTAGGG DNA sequence and the shieldin complex (6). Telomeres ensure the stability of chromosomes, providing security, and are significant for cell division and certain diseases (7). In addition, telomere abnormalities can lead to many diseases and are closely associated with the development of many mental health problems and cancer (7, 8). A study elucidated polymorphisms in telomere length-related genes and found that some telomeric loci were associated with a high risk of liver cancer (9). It has been shown that the length of the telomere-related genes (TRGs) is associated with the development of glioma (10). Malignant glioma usually exhibit telomerase activity, although normal brain tissue hardly ever does (11). Malignant glioma cells may be capable of unrestricted proliferation and apoptosis inhibition due to abnormal telomerase reactivation (11).
In the research, we screened and correlated TRGs with the aim of identifying immune checkpoints associated with glioma immunotherapy to improve the efficacy of clinical glioma and improve patient survival.
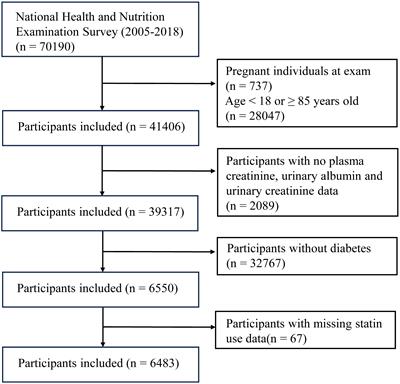
2 Materials and methods2.1 Preparation of dataThe TCGA-glioma and GEO-GSE74187 databases provided the RNA-seq data and clinical information for glioma (12). Data that was missing or had a survival time of less than 30 days was removed. TRGs were downloaded from TelNet (http://www.cancertelsys.org/telnet/; Table S1) (13).
2.2 Construction and validation of modelTo find TRGs that were differently expressed between normal and glioma samples (|logFC| >= 1 and P value< 0.05), the R package limma and wilcox tests were used (14). Prognostic TRGs were identified using univariate Cox analysis (P< 0.001), and a risk model was created using multivariate Cox analysis. Each patient with glioma had their risk score calculated using a formula: ∑i=1kβiSi. To validate this model, the GEO-GSE74187 dataset was used as an external validation set. To compare the survival rates of various groups, a Kaplan-Meier analysis was used. To evaluate the accuracy of survival prediction, the receiver operating characteristic (ROC) curves and the area under curve (AUC) were used.
Based on clinical characteristics, we divided the patients into several groups and investigated the survival rates of various groups within various groupings. The model was tested using univariate and multivariate Cox analyses to ensure that it was an accurate predictor of prognosis. The consistency index (C-index) was used to calculate the model’s accuracy. A nomogram was developed to predict the 1, 3, and 5-year survival rates of glioma patients using the model and clinical data. We found differentially expressed genes (DEGs) in different groups (|logFC > 1| and FDR< 0.05) and ran kyoto encyclopedia of genes and genomes (KEGG) and Gene Ontology (GO) enrichment analyses on these DEGs (P< 0.05) using clusterProfiler 4.0 (15).
2.3 Evaluation of immune landscapeThe number of gene mutations was determined using mutational analysis, and scores for tumor immune dysfunction and exclusion (TIDE) and tumor mutation burden (TMB) were computed to forecast immunotherapy response (16, 17). Additionally, we computed survival variations between various TMB groups and other groups. Immune cell infiltration was calculated using the EPIC, TIMER, MCP-COUNTER, XCELL, QUANTISEQ, CIBERSORT, and CIBERSORT-ABS algorithms (18–24). To evaluate the variations in immune function and look into the expression levels of several immunological checkpoint genes, we used a single-sample gene set enrichment analysis (ssGSEA).
2.4 Identification of anti-tumor drugsTo assess the anti-tumor medications often used in the clinical treatment of glioma, we calculated the half inhibitory concentration (IC50) of pharmaceuticals and compared the IC50 across various groups using the “pRRophetic” R package (10.1371/journal.pone.0107468).
3 Result3.1 Construction and validation of signatureDifferential expression analysis revealed 22 differentially expressed TRGs (Figure 1A), univariate Cox analysis revealed 19 prognostic TRGs (P< 0.001; Figure 1B), and multivariate Cox analysis produced a signature with 9 prognostic TRGs (Figure 1C). The findings of the survival analysis (P< 0.001; Figure 1D) and the validation set from GSE74187 (P = 0.011; Figure 1E) both indicated that the high-risk group had a shorter survival time. The signature was used to forecast glioma patients’ 1-, 3-, and 5-year survival rates, with the corresponding AUC values of 0.867, 0.909, and 0.867 (Figure 1F). Compared to other clinical features, the model’s AUC was greater, indicating that it is more trustworthy (Figure 1G).
Figure 1 (A) Differential expression analysis. (B) and (C) Univariate and multivariate Cox analyses. (D) and (E) The survival analysis from TCGA-glioma and GSE74187. (F) The AUC values for the model. (G) The AUC of the model was also higher than other clinical features.
Patients in the low-risk group had a longer survival time, according to the various clinical subgroups, suggesting that the model is applicable to patients with a range of clinical features (Figure 2A). In both univariate and multivariate Cox analyses, the risk score was shown to be an independent prognostic predictor (P< 0.001; Figures 2B). The C-index showed that the model performed better in predicting the prognosis of glioma than did traditional clinical criteria (Figure 3A). The correlation plot showed that the observed 1, 3, and 5-year survival rates and the anticipated rates agreed strongly (Figure 3B). We developed a nomogram using the signature and clinical characteristics that might be used to precisely forecast the survival of glioma patients (Figure 3C).
Figure 2 (A) According to the various clinical subgroups, patients in the low-risk group had a longer survival time. (B) It was discovered that the risk score was a standalone prognostic factor.
Figure 3 (A) The model performed better in predicting the prognosis of glioma than did traditional clinical criteria. (B) The observed survival rates demonstrated a strong agreement with the projected rates in the correlation plot. (C) A nomogram with signature and clinical characteristics.
3.2 Assessment of immunological landscapeWe found 633 DEGs between various risk groups to analyze the various molecular pathways between different groups (Table S2). Figures 4A, B show the results of the GO and KEGG analyses, while Tables S3, S4 give more information. In comparison to the high-risk group, the frequency of gene mutations was much greater in the low-risk group (Figures 5A, B). Lower TIDE scores (P = 0.019; Figure 5C) and higher TMB scores (P< 0.001; Figure 5D) in the high-risk group indicated that they were more likely to respond to immunotherapy. According to survival research, distinct TMB and risk groups had statistically different survival rates, suggesting that integrating TMB scores might improve the ability to predict the prognosis of glioma patients (Figures 5E, F).
Figure 4 (A, B) The GO and KEGG analyses for 633 DEGs.
Figure 5 (A, B) The specific genes that have been altered differed substantially between groups. (C) and (D) The high-risk group have a lower TIDE score and a higher TMB score. (E) High-TMB groups had considerably reduced survival rates. (F) The four groups’ survival rates varied greatly from one another.
The enrichment of CD4+ T cells, CD8+ T cells, fibroblasts, endothelial cells, macrophages M0, M1, and, M2, mast cells, myeloid dendritic cells, and neutrophils was favorably correlated with the risk score, but the enrichment of B cells and NK cells was negatively correlated with the risk score (Figure 6). The various risk groups showed statistically significant differences in all immunological activities (Figure 7A). The expression of several immune checkpoint-related genes, such as CTLA-4 (P< 0.001), PDCD1 (P< 0.001), LAG3 (P< 0.001), and CD274 (P< 0.001), differed significantly across the risk groups (Figure 7B).
Figure 6 The enrichment of CD4+ T cells, CD8+ T cells, fibroblasts, endothelial cells, macrophages M0, M1 and, M2, mast cells, myeloid dendritic cells, and neutrophils was favorably correlated with the risk score, but the enrichment of B cells and NK cells was negatively related to the risk score.
Figure 7 (A) The various risk groups showed statistically significant differences in all immunological activities. (B) The expression of immune checkpoint-related genes differed significantly across the risk groups. *** means P < 0.001.
3.3 Selection of anti-tumor drugsAlong with immunotherapy, we are looking for chemotherapeutic drugs for patients in different risk groups. Finally, in order to create individualized treatment plans for diverse individuals, we searched for numerous chemotherapeutic medications for patients in various groups (P< 0.001; Figure 8).
Figure 8 Identification of traditional chemotherapy medications.
4 DiscussionWith a low patient survival rate and a poor clinical prognosis, glioma has a high occurrence (25). The overall survival rate of glioma patients continues to be dismal despite the quick development of surgical resection methods, chemotherapy, and radiation (4). Therefore, to ensure that immunotherapy for glioblastoma is effective, we must discover superior immune checkpoints.
High-throughput sequencing data and computational biology are currently used extensively in the study of biomedicine (26, 27). Wang et al., for instance, identified biomarkers in several tumors using computational biology techniques like WGCNA, which gives us a methodologically sound foundation on which to examine the process of carcinogenesis (28–30). In the research, we first created a risk model linked to TRGs by discovering TRGs. After that, using this methodology to determine the risk score for glioma patients, we divided them into low- and high-risk groups. In order to confirm the validity of the model, we did univariate and multivariate Cox analyses on the patients in the high-risk group and discovered that they all had shorter survival rates than those in the low-risk group. As expected, the predictive accuracy of the risk model was high.
Then, we analyzed the immune infiltration in the high-risk and low-risk groups and found that the enrichment of CD4+ T cells, CD8+ T cells, fibroblasts, endothelial cells, macrophages M0, M1 and, M2, mast cells, myeloid dendritic cells, and neutrophils was favorably correlated with the risk score, but the enrichment of B cells and NK cells was negatively related to the risk score. CD8+ T cells are a common type of T cells, and the CD8+ T cell family establishes a neuronal-immune-cancer axis through midkine activation to enhance favorable conditions for the growth of low-grade glioma (31). In addition, in one study performed by Ge. et al, related discussions elucidated that macrophages, neutrophils and fibroblasts can be regulated by TP53I13, altering tumor immune infiltration and thus promoting glioma development and metastasis (32). The potential of neutrophils as therapeutic targets in cancer biology has now been extensively studied. Neutrophils play a complex role in cancer, including their ability to exert pro- or anti-tumor activity (33). However, further studies are needed to investigate their exact roles and mechanisms of action to develop targeted therapeutic approaches. Furthermore, although the degree of neutrophil infiltration correlates with glioma grade, the underlying mechanisms are unknown (33).
In addition, in our study, we also found some significant TRGs such as CTLA-4, PDCD1, LAG3, and CD274 (PD-L1). A critical part of the tumor immune response pathway is played by CTLA-4 (34). Although it has been shown that CTLA-4 positively correlates with immune-related proteins in glioma, excessive CTLA-4 expression is associated with a worse prognosis for glioma patients (35). An immunoglobulin superfamily cell surface membrane protein, encoded by the PDCD1 gene, is responsible for programmed cell death. Activated monocytes, NK cells, T cells, and B cells are the main cell types that express it. Additionally, B or T cell receptor signaling can cause PDCD1 expression, and tumor necrosis factor stimulation can further increase it (36). LAG3, an inhibitory receptor that is predominantly located on activated immune cells and is frequently co-expressed with PD-1 on depleted T cells, has emerged as a crucial immunomodulator target (37). CD274 (PD-L1) is considered a major prognostic biomarker for immunotherapy of many cancers. CD274 (PD-L1) is not only associated with decreased cytotoxic T lymphocytes and increased Tregs in glioma lesions, but also has an intrinsic oncogenic effect through interaction with Ras (10.3389/fphar.2018.01503). It has been shown that LAG3 is realized to be highly expressed in glioma patients, but the sample size is small and further experimental validation is needed (38). In addition, in addition to immunotherapy, we have studied a large number of drugs for different groups of patients in order to develop individualized treatment plans.
Although we tried to avoid errors as much as possible to make our experiments credible, there are still some shortcomings that need to be improved. First, due to database limitations, we were unable to accurately compare the corresponding checkpoint inhibitor IC50. In addition, we did not conduct simultaneous in vitro experimental validation, and further in-depth experiments are needed for this part. We believe that our risk model construction is reasonable and acceptable for further validation in future clinical trials based on the above analysis, validation, and previous relevant reports. Most importantly, the current data is limited and we need to collect more data from the clinic to expand the database for future studies.
ConclusionThe present study support that TRGs could predict the prognosis of glioma patients and help to find effective targets for glioma immunotherapy and can serve as a basis for effective individualized treatment of glioma patients.
Data availability statementThe datasets presented in this study can be found in online repositories. The names of the repository/repositories and accession number(s) can be found in the article/Supplementary Material.
Ethics statementThis study was reviewed and approved by the Ethics Committee of Hangzhou Ninth People's Hospital.
Author contributionsQX and TL designed the study. QX, TL, XZ, YD, and XF performed data analysis. QX and TL drafted and revised the manuscript. All authors read and approved the final manuscript.
FundingThis work was supported by the Health Science and Technology Program of Hangzhou (A20220002) and the Hainan Provincial Natural Science Foundation of China (No. 822RC860).
Conflict of interestThe authors declare that the research was conducted in the absence of any commercial or financial relationships that could be construed as a potential conflict of interest.
Publisher’s noteAll claims expressed in this article are solely those of the authors and do not necessarily represent those of their affiliated organizations, or those of the publisher, the editors and the reviewers. Any product that may be evaluated in this article, or claim that may be made by its manufacturer, is not guaranteed or endorsed by the publisher.
Supplementary materialThe Supplementary Material for this article can be found online at: https://www.frontiersin.org/articles/10.3389/fendo.2023.1145722/full#supplementary-material
Supplementary Table 1 | The TRGs.
Supplementary Table 2 | The 33 DEGs.
Supplementary Table 3 | The GO enrichment analysis.
Supplementary Table 4 | The KEGG enrichment analysis.
AbbreviationsTRGs, telomere-related genes; LGG, low grade glioma; GBM, glioblastoma multiforme; TRGs, telomere-related genes; DEGs, differentially expressed genes; KEGG, kyoto encyclopedia of genes and genomes; GO, gene ontology; TIDE, tumor immune dysfunction and exclusion; TMB, tumor mutation burden; ssGSEA, single-sample gene set enrichment analysis; IC50, half inhibitory concentration.
References1. Sung H, Ferlay J, Siegel RL, Laversanne M, Soerjomataram I, Jemal A, et al. Global cancer statistics 2020: GLOBOCAN estimates of incidence and mortality worldwide for 36 cancers in 185 countries. CA Cancer J Clin (2021) 71(3):209–49. doi: 10.3322/caac.21660
PubMed Abstract | CrossRef Full Text | Google Scholar
2. Louis DN, Perry A, Reifenberger G, von Deimling A, Figarella-Branger D, Cavenee WK, et al. The 2016 world health organization classification of tumors of the central nervous system: a summary. Acta Neuropathol (2016) 131(6):803–20. doi: 10.1007/s00401-016-1545-1
PubMed Abstract | CrossRef Full Text | Google Scholar
4. Ghotme KA, Barreto GE, Echeverria V, Gonzalez J, Bustos RH, Sanchez M, et al. Gliomas: new perspectives in diagnosis, treatment and prognosis. Curr Top Med Chem (2017) 17(12):1438–47. doi: 10.2174/1568026617666170103162639
PubMed Abstract | CrossRef Full Text | Google Scholar
8. Li SC, Jia ZK, Yang JJ, Ning XH. Telomere-related gene risk model for prognosis and drug treatment efficiency prediction in kidney cancer. Front Immunol (2022) 13:975057. doi: 10.3389/fimmu.2022.975057
PubMed Abstract | CrossRef Full Text | Google Scholar
9. Huang P, Li R, Shen L, He W, Chen S, Dong Y, et al. Single nucleotide polymorphisms in telomere length-related genes are associated with hepatocellular carcinoma risk in the Chinese han population. Ther Adv Med Oncol (2020) 12:1758835920933029. doi: 10.1177/1758835920933029
PubMed Abstract | CrossRef Full Text | Google Scholar
10. Saunders CN, Kinnersley B, Culliford R, Cornish AJ, Law PJ, Houlston RS. Relationship between genetically determined telomere length and glioma risk. Neuro Oncol (2022) 24(2):171–81. doi: 10.1093/neuonc/noab208
PubMed Abstract | CrossRef Full Text | Google Scholar
12. Yu X, Feng L, Liu D, Zhang L, Wu B, Jiang W, et al. Quantitative proteomics reveals the novel co-expression signatures in early brain development for prognosis of glioblastoma multiforme. Oncotarget (2016) 7(12):14161–71. doi: 10.18632/oncotarget.7416
PubMed Abstract | CrossRef Full Text | Google Scholar
13. Braun DM, Chung I, Kepper N, Deeg KI, Rippe K. TelNet - a database for human and yeast genes involved in telomere maintenance. BMC Genet (2018) 19(1):32. doi: 10.1186/s12863-018-0617-8
PubMed Abstract | CrossRef Full Text | Google Scholar
14. Ritchie ME, Phipson B, Wu D, Hu Y, Law CW, Shi W, et al. Limma powers differential expression analyses for RNA-sequencing and microarray studies. Nucleic Acids Res (2015) 43(7):e47. doi: 10.1093/nar/gkv007
PubMed Abstract | CrossRef Full Text | Google Scholar
15. Wu T, Hu E, Xu S, Chen M, Guo P, Dai Z, et al. clusterProfiler 4.0: a universal enrichment tool for interpreting omics data. Innovation (Camb) (2021) 2(3):100141. doi: 10.1016/j.xinn.2021.100141
PubMed Abstract | CrossRef Full Text | Google Scholar
16. Fu J, Li K, Zhang W, Wan C, Zhang J, Jiang P, et al. Large-Scale public data reuse to model immunotherapy response and resistance. Genome Med (2020) 12(1):21. doi: 10.1186/s13073-020-0721-z
PubMed Abstract | CrossRef Full Text | Google Scholar
17. Krøigård AB, Thomassen M, Lænkholm AV, Kruse TA, Larsen MJ. Evaluation of nine somatic variant callers for detection of somatic mutations in exome and targeted deep sequencing data. PloS One (2016) 11(3):e0151664. doi: 10.1371/journal.pone.0151664
PubMed Abstract | CrossRef Full Text | Google Scholar
18. Newman AM, Liu CL, Green MR, Gentles AJ, Feng W, Xu Y, et al. Robust enumeration of cell subsets from tissue expression profiles. Nat Methods (2015) 12(5):453–7. doi: 10.1038/nmeth.3337
PubMed Abstract | CrossRef Full Text | Google Scholar
19. Li T, Fan J, Wang B, Traugh N, Chen Q, Liu JS, et al. TIMER: a web server for comprehensive analysis of tumor-infiltrating immune cells. Cancer Res (2017) 77(21):e108–e10. doi: 10.1158/0008-5472.Can-17-0307
PubMed Abstract | CrossRef Full Text | Google Scholar
20. Dienstmann R, Villacampa G, Sveen A, Mason MJ, Niedzwiecki D, Nesbakken A, et al. Relative contribution of clinicopathological variables, genomic markers, transcriptomic subtyping and microenvironment features for outcome prediction in stage II/III colorectal cancer. Ann Oncol (2019) 30(10):1622–29. doi: 10.1093/annonc/mdz287
PubMed Abstract | CrossRef Full Text | Google Scholar
22. Finotello F, Mayer C, Plattner C, Laschober G, Rieder D, Hackl H, et al. Molecular and pharmacological modulators of the tumor immune contexture revealed by deconvolution of RNA-seq data. Genome Med (2019) 11(1):34. doi: 10.1186/s13073-019-0638-6
PubMed Abstract | CrossRef Full Text | Google Scholar
23. Tamminga M, Hiltermann TJN, Schuuring E, Timens W, Fehrmann RS, Groen HJ. Immune microenvironment composition in non-small cell lung cancer and its association with survival. Clin Transl Immunol (2020) 9(6):e1142. doi: 10.1002/cti2.1142
CrossRef Full Text | Google Scholar
24. Racle J, de Jonge K, Baumgaertner P, Speiser DE, Gfeller D. Simultaneous enumeration of cancer and immune cell types from bulk tumor gene expression data. Elife (2017) 6. doi: 10.7554/eLife.26476
PubMed Abstract | CrossRef Full Text | Google Scholar
26. Zhao Z, Zhang D, Yang F, Xu M, Zhao S, Pan T, et al. Evolutionarily conservative and non-conservative regulatory networks during primate interneuron development revealed by single-cell RNA and ATAC sequencing. Cell Res (2022) 32(5):425–36. doi: 10.1038/s41422-022-00635-9
PubMed Abstract | CrossRef Full Text | Google Scholar
27. Xu D, Zhi Y, Liu X, Guan L, Yu J, Zhang D, et al. WDR62-deficiency causes autism-like behaviors independent of microcephaly in mice. Neurosci Bull (2022). doi: 10.1007/s12264-022-00997-5
PubMed Abstract | CrossRef Full Text | Google Scholar
28. Wang Y, Yan K, Wang J, Lin J, Bi J. M2 macrophage Co-expression factors correlate with immune phenotype and predict prognosis of bladder cancer. Front Oncol (2021) 11:609334. doi: 10.3389/fonc.2021.609334
PubMed Abstract | CrossRef Full Text | Google Scholar
29. Wang Y, Yan K, Lin J, Li J, Bi J. Macrophage M2 Co-expression factors correlate with the immune microenvironment and predict outcome of renal clear cell carcinoma. Front Genet (2021) 12:615655. doi: 10.3389/fgene.2021.615655
PubMed Abstract | CrossRef Full Text | Google Scholar
30. Wang Y, Yan K, Wang L, Bi J. Genome instability-related long non-coding RNA in clear renal cell carcinoma determined using computational biology. BMC Cancer (2021) 21(1):727. doi: 10.1186/s12885-021-08356-9
PubMed Abstract | CrossRef Full Text | Google Scholar
31. Guo X, Pan Y, Xiong M, Sanapala S, Anastasaki C, Cobb O, et al. Midkine activation of CD8(+) T cells establishes a neuron-immune-cancer axis responsible for low-grade glioma growth. Nat Commun (2020) 11(1):2177. doi: 10.1038/s41467-020-15770-3
PubMed Abstract | CrossRef Full Text | Google Scholar
32. Ge X, Xu M, Cheng T, Hu N, Sun P, Lu B, et al. TP53I13 promotes metastasis in glioma via macrophages, neutrophils, and fibroblasts and is a potential prognostic biomarker. Front Immunol (2022) 13:974346. doi: 10.3389/fimmu.2022.974346
PubMed Abstract | CrossRef Full Text | Google Scholar
36. Miao Y, Wang J, Li Q, Quan W, Wang Y, Li C, et al. Prognostic value and immunological role of PDCD1 gene in pan-cancer. Int Immunopharmacol (2020) 89(Pt B):107080. doi: 10.1016/j.intimp.2020.107080
PubMed Abstract | CrossRef Full Text | Google Scholar
38. Mair MJ, Kiesel B, Feldmann K, Widhalm G, Dieckmann K, Wöhrer A, et al. LAG-3 expression in the inflammatory microenvironment of glioma. J Neurooncol (2021) 152(3):533–39. doi: 10.1007/s11060-021-03721-x
留言 (0)