
記住我


Chronic total occlusion (CTO) remains a significant challenge in the field of interventional cardiology due to the complexity of corrective procedures and the risk of associated complications.[1] Although many cases are asymptomatic, recent data suggest that CTO occurs in about 10–30% of patients with coronary artery disease undergoing coronary angiography.[2–5] Our previous work showed no statistically significant reduction of cardiac death after either successful percutaneous coronary intervention (PCI) or revascularization accomplished by coronary artery bypass graft surgery (CABG) or PCI vs. medical therapy in patients with CTO.[6,7] However, symptom improvement by CTO-PCI was gradually proved, and the risk of major adverse cardiovascular event (MACE) including unstable angina should be reassessed. In actual clinical practice, due to the high radiation exposure, complex technology, and procedural complications of complete percutaneous revascularization, some clinicians are more likely to perform incomplete PCI for non-CTO lesions or CTO lesions for patients with the multi-vessel disease (MVD), and poor revascularization of remaining lesions after incomplete PCI is very common. In addition, MVD, which coexisted in about 80% of CTO patients according to our previous report,[6] was always associated with a poorer prognosis as compared with single-vessel disease,[8] and whether complete PCI improved the prognosis for this subset was still not clear. Therefore, the present study aimed to investigate the clinical outcomes of complete versus incomplete PCI for patients with CTO and MVD.
Methods Ethics approvalThe study protocol was approved by the Institutional Review Board of Dalian Medical University (No. YJ-KY-FB-2017-01) and conducted by the tenets of the Declaration of Helsinki. Study participants have signed informed consent.
Patient populationA total of 11,007 patients underwent coronary angiography at the Department of Cardiology of the First Affiliated Hospital of Dalian Medical University from January 2016 to December 2018. Finally, 558 patients with CTO and MVD were included for analysis.
The inclusion criteria for this study were: (1) aged 18–80 years, (2) at least one CTO, and stenosis of ≥70% of at least one other vessel, as confirmed by coronary angiography, and (3) symptomatic angina and/or functional ischemia, which was assessed by cardiac magnetic resonance, dimensional echocardiography, or single-photon emission computed tomography (SPECT). The exclusion criteria included: (1) acute myocardial infarction (MI) within 3 months, (2) a history of cardiogenic shock or cardiopulmonary resuscitation (New York Heart Association functional classification of grade VI), (3) history of CABG, (4) severe renal insufficiency (estimated glomerular filtration rate [eGFR] <15 mL∙min-1∙1.73 m-2), and (5) current malignancy.
The study cohort included 558 patients who were divided into the optimal medical treatment (OMT) group (n = 86), incomplete PCI group (n = 327), or complete PCI group (n = 145). Baseline clinical, laboratory, and angiographic data were collected from the hospital database and medical records. A median follow-up of 21 months of the enrolled population was performed by reviewing medical records or telephone interviews.
Treatment strategyOMT included antiplatelet medication, beta-blockers, angiotensin-converting enzyme inhibitors/angiotensin II receptor blockers, nitrates, and aggressive lipid-lowering agents. The medication doses were maximized as allowed by heart rate, blood pressure, symptoms, and side effects. Coronary interventions were performed according to current standard guidelines.[19] All patients received loading doses of aspirin (300 mg) and clopidogrel (300–600 mg) before PCI unless antiplatelet therapy was administered beforehand. Aspirin treatment was continued indefinitely and clopidogrel was administered for at least 12 months after PCI.
Study definitions and outcomesCTO was defined as a complete obstruction of a coronary artery with an anterograde Thrombolysis In Myocardial Infarction (TIMI) flow grade of 0 for an estimated duration >3 months based on clinical history or previous angiography.[9] Successful PCI was defined as final residual stenosis of <20% with a TIMI flow grade of ≥2 after stent implantation, as assessed by visual estimation of angiograms. Complete PCI was considered as successful PCI of all vessels with both CTO and non-CTO lesions, while incomplete PCI was defined as revascularization of only a portion of significant lesions, no matter it was due to the failure of CTO lesions or non-CTO lesions. Chronic kidney disease (CKD) stages I–II were defined as eGFR ≥60 mL∙min-1∙1.73 m-2, while CKD stages III–V were defined as eGFR <60 mL∙min-1∙1.73 m-2. The primary outcome was MACE during follow-up, which was defined as a composite of all-cause death, recurrent MI, ischemia-driven repeat revascularization, unstable angina, and heart failure. Unstable angina was defined as the secondary outcome. MI was defined as clinical evidence of myocardial ischemia with an increase and/or decrease in cardiac troponin levels with at least one value above the 99th percentile of the upper reference limit, combined with any of symptom of ischemia, new ischemic changes on an electrocardiograph, development of pathological Q waves, imaging evidence of new loss of viable myocardium, or new regional wall motion abnormality in a pattern consistent with an ischemic etiology, or identification of a coronary thrombus by angiography or autopsy.[10] Periprocedural cardiac enzymes elevation was not included in the definition of MI. Ischemia-driven repeat revascularization was defined as a composite of target vessel revascularization (TVR) and non-TVR treated with PCI or CABG which was driven by ischemia, and scheduled staged PCI was not regarded as ischemia-driven repeat revascularization. Unstable angina was defined as angina required for rehospitalization and supported by evidence of ischemia such as electrocardiographic changes. Heart failure was defined as the breathlessness required for rehospitalization and supported by evidence of impaired cardiac function.
Statistical analysisContinuous variables were compared using the Student's t-test, one-way analysis of variance, Mann–Whitney U test or Kruskal–Wallis H test, as appropriate, and are presented as the mean ± standard deviation or median with interquartile range. Categorical data were tested using the chi-squared test or Fisher's exact test, and are presented as number and percentage. Survival with no adverse events was evaluated using Kaplan–Meier analysis and compared with the log-rank test. Covariates that were statistically significant by univariate analysis, or were clinically relevant, were included in multivariate models, including age, gender, hypertension, diabetes mellitus, smoking, previous MI, left anterior descending artery (LAD) involvement, left ventricular ejection fraction (LVEF), and eGFR. The adjusted Cox proportional hazard model was used to compare the risks of adverse cardiac events. Additionally, propensity score matching (PSM) was used to balance baseline characteristics between the complete and incomplete PCI groups as sensitivity analysis [Supplementary material, https://links.lww.com/CM9/B497]. A full non-parsimonious model was developed which included each of the variables listed in Table 1. PSM was conducted at a ratio of up to 1:2 using the nearest-neighbor matching algorithm with caliper widths of 0.1. All tests were two-tailed. A probability (P) value of <0.05 was considered statistically significant. All analyses were performed using IBM SPSS Statistics for Windows (version 26.0; IBM Corporation, Armonk, NY, USA) and R software (version 3.5; R Foundation for Statistical Computing, Vienna, Austria).
Table 1 - Baseline characteristics and related baseline medications in total and post-matched populations of patients with CTO and MVD. Variables Total population Post-matched populationOMT
(n = 86)
Incomplete PCI (n = 327) Complete PCI (n = 145) χ 2/F/H P values Incomplete PCI (n = 190)Complete PCI
(n = 122)
χ 2/t/Z P values Age (years) 63.9 ± 9.5 63.4 ± 10.0 62.4 ± 9.1 0.786§ 0.456 63.5 ± 10.0 62.7 ± 9.3 0.723** 0.470 Male 69 (80.2) 241 (73.7) 113 (77.9) 2.066|| 0.356 144 (75.8) 94 (77.0) 0.065|| 0.799 Hypertension 67 (77.9) 229 (70.0) 101 (69.7) 2.270|| 0.321 128 (67.4) 85 (69.7) 0.182|| 0.670 Diabetes mellitus 38 (44.2) 138 (42.2) 49 (33.8) 3.582|| 0.167 72 (37.9) 40 (32.8) 0.842|| 0.359 Smoking 38 (44.2) 152 (46.5) 50 (34.5) 5.959|| 0.051 75 (39.5) 47 (38.5) 0.028|| 0.867 Hyperlipidemia 72 (83.7) 272 (83.2) 126 (86.9) 1.064|| 0.587 163 (85.8) 106 (86.9) 0.075|| 0.784 Familial history of CAD 15 (17.4) 45 (13.8) 21 (14.5) 0.743|| 0.690 22 (11.6) 18 (14.8) 0.670|| 0.413 Previous MI 33 (38.4) 127 (38.8) 45 (31.0) 2.749|| 0.253 61 (32.1) 39 (32.0) 0.001|| 0.980 Previous PCI 27 (31.4) 110 (33.6)‡ 29 (20.0) 9.074|| 0.011 45 (23.7) 26 (21.3) 0.238|| 0.626 Previous CVA 5 (5.8) 29 (8.9) 10 (6.9) 1.138|| 0.566 14 (7.4) 9 (7.4) <0.001|| 0.998 PVD 2 (2.3) 8 (2.4) 3 (2.1) 0.063|| 0.969 5 (2.6) 3 (2.5) 0.009|| 0.925 TC (mmol/L) 4.5 (3.3–5.2)* 4.4 (3.5–5.0)‡ 4.9 (4.0–5.7) 19.847¶ <0.001 4.6 (3.7–5.5) 4.8 (3.9–5.6) -1.222†† 0.222 TG (mmol/L) 1.4 (1.1–2.1) 1.7 (1.2–2.2) 1.8 (1.2–2.5) 5.498¶ 0.064 1.8 (1.2–2.3) 1.8 (1.3–2.5) -0.479†† 0.632 HDL-C (mmol/L) 1.0 (0.9–1.2)* 1.0 (0.9–1.1)‡ 1.1 (1.0–1.2) 13.308¶ 0.001 1.0 (0.9–1.2) 1.1 (0.9–1.2) -1.048†† 0.295 LDL-C (mmol/L) 2.5 (1.7–3.2) 2.4 (1.8–3.0)‡ 2.8 (2.1–3.4) 14.109¶ 0.001 2.6 (2.0–3.2) 2.8 (2.1–3.4) -1.137†† 0.256 Creatinine (µmol/L) 78 (64–87) 75 (66–87) 72 (62–80) 5.995¶ 0.050 71 (65–85) 74 (65–81) -0.133†† 0.894 eGFR (mL∙min-1∙1.73 m-2) 87.8 ± 24.4 87.0 ± 22.5‡ 93.5 ± 21.9 4.281§ 0.014 89.8 ± 21.4 90.4 ± 20.3 -0.241** 0.809 Uric acid (µmol/L) 355 (293–420) 358 (301–429) 361 (310–415) 0.026¶ 0.987 360 (301–430) 360 (310–408) -0.143†† 0.886 LVEF (%) 57 (51–59)* 57 (54–59)‡ 58 (56–59) 12.510¶ 0.002 58 (55–59) 58 (55–59) -1.453†† 0.146 Number of CTOs 22.810|| <0.001 0.413|| 0.520 1 64 (74.4) 298 (91.1) 135 (93.1) 172 (90.5) 113 (92.6) ≥2 22 (25.6)*,† 29 (8.9) 10 (6.9) 18 (9.5) 9 (7.4) Location of CTO LAD 31 (36.0) 80 (24.5)‡ 53 (36.6) 9.242|| 0.010 61 (32.1) 39 (32.0) 0.001|| 0.980 LCX 27 (31.4) 132 (40.4)‡ 40 (27.6) 7.959|| 0.019 62 (32.6) 35 (28.7) 0.539|| 0.463 RCA 50 (58.1) 143 (43.7) 62 (42.8) 6.379|| 0.041 85 (44.7) 57 (46.7) 0.118|| 0.731 Proximal or mid CTO 72 (83.7)* 218 (66.7) 102 (70.3) 9.477|| 0.009 130 (68.4) 84 (68.9) 0.006|| 0.936 Collateral flow ≥ 2 (Rentrop grade) 63 (73.3)*,† 169 (51.7) 62 (42.8) 20.462|| <0.001 93 (48.9) 55 (45.1) 0.445|| 0.505 Number of diseased vessels 0.942|| 0.625 0.002|| 0.960 2 53 (61.6) 199 (60.9) 95 (65.5) 122 (64.2) 78 (63.9) 3 33 (38.4) 128 (39.1) 50 (34.5) 68 (35.8) 44 (36.1) Medication Aspirin 76 (88.4)*,† 318 (97.2) 143 (98.6) 17.885|| <0.001 187 (98.4) 120 (98.4) 0.002|| 1.000Clopidogrel or ticagrelor
80 (93.0)*,† 321 (98.2) 145 (100.0) 12.861|| 0.002 190 (100.0) 122 (100.0) – – ACEI/ARB 60 (69.8) 193 (59.0) 102 (70.3) 7.225|| 0.027 117 (61.6) 83 (68.0) 1.345|| 0.246 β-blocker 68 (79.1) 243 (74.3) 115 (79.3) 1.808|| 0.405 147 (77.4) 95 (77.9) 0.011|| 0.918 Statins 85 (98.8) 316 (96.6) 143 (98.6) 2.371|| 0.465 187 (98.4) 120 (98.4) 0.002|| 1.000 Nitrate 43 (50.0) 169 (51.7) 83 (57.2) 11.581|| 0.454 108 (56.8) 68 (55.7) 0.037|| 0.848Data are presented as n (%), mean ± standard deviation, or median (interquartile range). *OMT vs. complete PCI, P <0.05. †OMT vs. incomplete PCI, P <0.05. ‡Incomplete PCI vs. complete PCI, P <0.05. §F value. ||χ2 value. ¶H value. **t value. ††Z value. ACEI: Angiotensin converting enzyme inhibitor; ARB: Angiotensin II receptor blocker; CAD: Coronary artery disease; CTO: Chronic total occlusion; CVA: Cerebrovascular accident; eGFR: Estimated glomerular filtration rate; HDL-C: High-density lipoprotein cholesterol; LAD: Left anterior descending artery; LCX: Left circumflex artery; LDL-C: Low-density lipoprotein cholesterol; LVEF: Left ventricular ejection fraction; MI: Myocardial infarction; MVD: Multi-vessel disease; OMT: Optimal medical treatment; PCI: Percutaneous coronary intervention; PVD: Peripheral vascular disease; RCA: Right coronary artery; TC: Total cholesterol; TG: Total triglyceride; –: Not applicable.
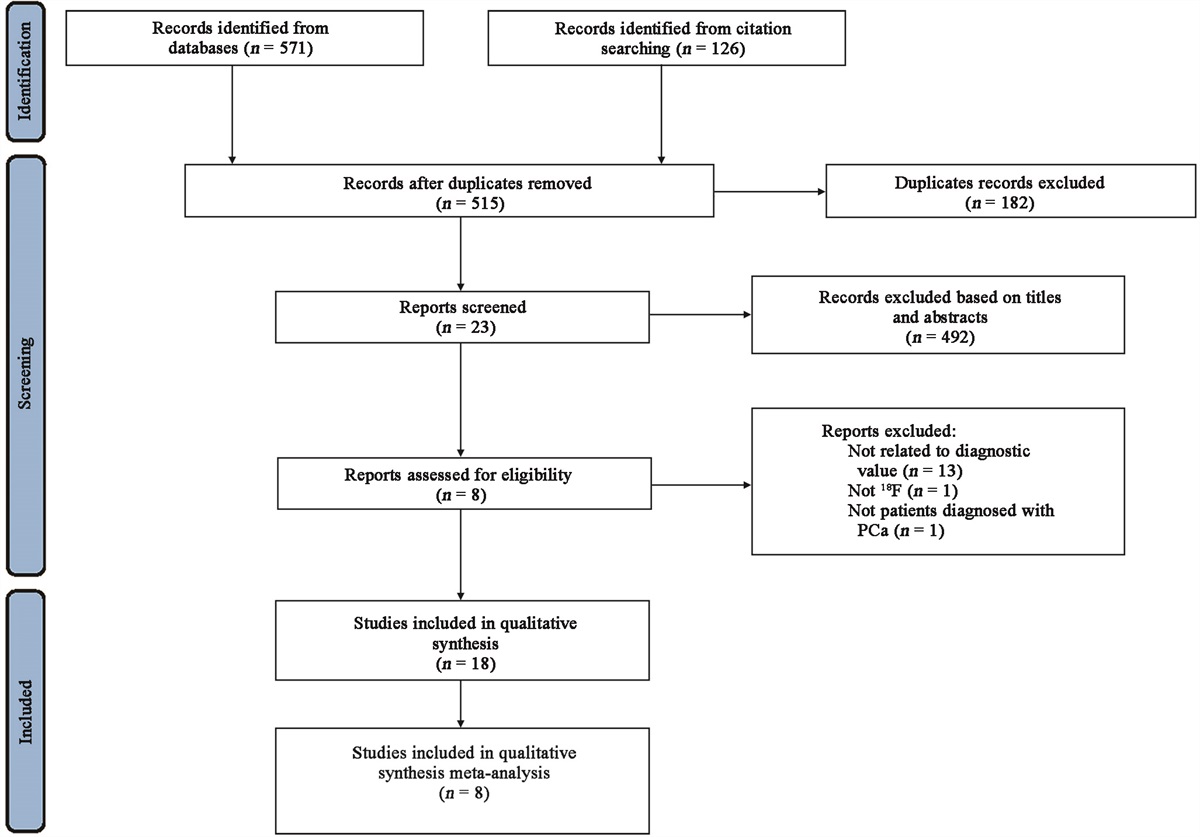
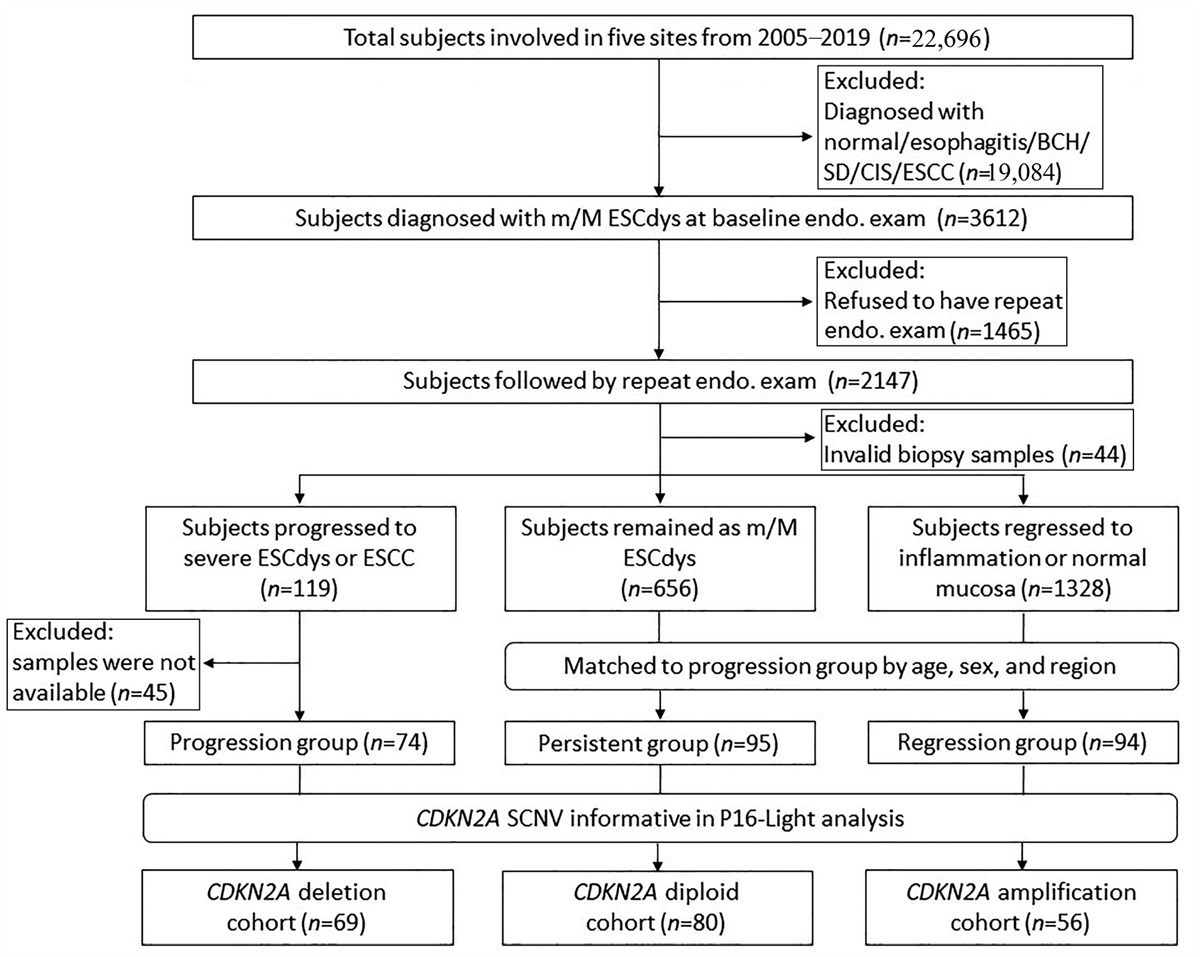
A total of 1099 patients were diagnosed with CTO and MVD. The prevalence of CTO and MVD was 9.98% [1099/11,007] in patients undergoing coronary angiography. After exclusion, 86 patients received the OMT, 327 patients received the incomplete PCI and 145 patients received the complete PCI group, according to the initial treatment strategy [Figure 1].
 Figure 1:
 Flow chart of inclusion and exclusion criteria, and grouping of study population. CABG: Coronary artery bypass graft surgery; CTO: Chronic total occlusion; eGFR: Estimated glomerular filtration rate; NYHA: New York Heart Association; OMT: Optimal medical treatment; PCI: Percutaneous coronary intervention.
The baseline, angiographic data and adverse events during hospitalization of all patients are shown in Table 1 and Supplementary Table 1, https://links.lww.com/CM9/B497. As compared with patients in the incomplete PCI group, those in the complete PCI group had a lower prevalence of previous PCI, and higher total cholesterol (TC), high-density lipoprotein cholesterol (HDL-C), low-density lipoprotein cholesterol (LDL-C), eGFR, and LVEF. Besides, patients in the complete PCI group were more likely to have CTO of the LAD, but less likely to have CTO of the left circumflex artery (LCX) as compared with those in the incomplete PCI group. According to the comparison with patients in the OMT group, those in the complete PCI group had a higher TC, HDL-C, and LVEF, lower rate of multiple CTOs and collateral circulation, and a higher rate of therapy with aspirin and adenosine diphosphate P2Y12 receptor antagonists (clopidogrel or ticagrelor) [Table 1]. In addition, patients in the complete PCI group were associated with lower risk of coronary dissection compared with incomplete PCI group [Supplementary Table 1, https://links.lww.com/CM9/B497].
After a PSM ratio of up to 1:2, 190 patients in the incomplete PCI group and 122 in the complete PCI group were retained for comparison [Table 1]. There was no significant difference in the baseline clinical or angiographic data after PSM.
Clinical outcomesAt a median follow-up period of 21 months (interquartile range 12–33 months), there were statistically significant differences among the OMT, incomplete PCI, and complete PCI groups on the rate of MACEs (43.0% [37/86] vs. 30.6% [100/327] vs. 20.0% [29/145], respectively, P = 0.016) and unstable angina (24.4% [21/86] vs. 19.3% [63/327] vs. 10.3% [15/145], respectively, P = 0.010) [Table 2, Figure 2]. Specifically, patients in the complete PCI group had a lower rate of MACE as compared with those in the incomplete PCI group (adjusted hazard ratio [HR] = 1.58; 95% confidence interval [CI] = 1.04–2.39; P = 0.031) and those in the OMT group (adjusted HR = 2.00; 95% CI = 1.23–3.27; P = 0.005). The rate of unstable angina was also lower in the complete PCI group as compared with the incomplete PCI group (adjusted HR = 1.98; 95% CI = 1.13–3.48; P = 0.017) and the OMT group (adjusted HR = 2.41; 95% CI = 1.24–4.67; P = 0.009) [Tables 2 and 3]. However, no significant difference was observed between OMT group and incomplete PCI group in terms of MACE or unstable angina [Supplementary Table 2, https://links.lww.com/CM9/B497].
Table 2 - Clinical outcomes in total population patients with CTO and MVD during follow-up, n (%). ItemsOMT
(n = 86)
Incomplete PCI
(n = 327)
Complete PCI
(n = 145)
χ 2 P values MACE 37 (43.0)* 100 (30.6) 29 (20.0) 7.900 0.016 All-cause death 5 (5.8)* 7 (2.1) 0 (0) 3.179‡ 0.204 Recurrent MI 4 (4.7) 13 (4.0) 6 (4.1) 1.347 0.510 Repeated revascularization 7 (8.1) 40 (12.2) 13 (9.0) 1.989 0.370 Unstable angina 21 (24.4)* 63 (19.3)† 15 (10.3) 8.034 0.010 Heart failure 4 (4.7) 13 (4.0) 4 (2.8) 0.983 0.612*OMT vs. complete PCI, P <0.05. †Incomplete PCI vs. complete PCI, P <0.05. ‡Wald chi-squared test value; CTO: Chronic total occlusion; MACE: Major adverse cardiovascular event; MI: Myocardial infarction; MVD: Multi-vessel disease; OMT: Optimal medical treatment; PCI: Percutaneous coronary intervention.
 Figure 2:
 Kaplan–Meier curves of (A) MACE and (B) unstable angina in all patients with CTO and MVD. CTO: Chronic total occlusion; MACE: Major adverse cardiovascular event; MVD: Multi-vessel disease; OMT: Optimal medical treatment; PCI: Percutaneous coronary intervention.
Table 3 - Cox analyses of the clinical outcomes in total population of patients with CTO and MVD during follow-up. Items OMT vs. complete PCI Incomplete PCI vs.
留言 (0)