
記住我


Prostate cancer (PCa) is a highly prevalent urological disease, with approximately 1.3 million cases diagnosed worldwide each year.[1] An estimated 700,000 out of 10 million patients diagnosed with PCa develop metastatic disease.[2,3] In 2022, approximately 125,646 cases of PCa were reported in Chinese mainland.[4] Owing to its high incidence rate and heavy disease burden, PCa has been a considerable focus of both basic and clinical research.[5,6] Accurate assessment of tumor stage, regional lymph node involvement, and distant metastasis is critical for the effective treatment of PCa. The majority of lymph node metastases from PCa occur in pelvic lymph nodes, which are available for extended pelvic lymph node dissection (ePLND).[7] The European Association of Urology (EAU) guidelines recommend ePLND as the most accurate method for lymph node staging in men with intermediate- or high-risk PCa when the risk of lymph node metastases exceeds 7%.[7] However, this is an invasive procedure that can lead to several complications, including lymph node enlargement, deep vein thrombosis, lower leg edema, blood loss, iliac vessel injury, ureteral injury, longer operative time, and longer hospital stay.[8,9] Therefore, the development of non-invasive diagnostic imaging techniques for lymph node staging remains a crucial unmet medical need.
While pre-surgical computed tomography (CT) or magnetic resonance imaging (MRI) co-treatment can be employed for lymph node staging, the accuracy of these procedures is low.[7] Targeted prostate specific membrane antigen positron emission tomography/computed tomography (PSMA PET/CT) has been increasingly used for PCa imaging within the last decade. Prostate specific membrane antigen (PSMA) is a transmembrane protein highly overexpressed on almost all PCa tumors.[10] Only 5–10% of primary PCa lesions are reported to be PSMA-negative.[11]68Ga-labeled PSMA imaging agents are currently the most commonly used for PET imaging of PCa patients. Systematic review and meta-analyses have shown sensitivity and specificity of 68Ga-PSMA for lymph node staging of PCa of 0.58–0.63 and 0.93–0.95, respectively.[12,13] Recently available 18F-labeled PSMA radiographic agents are undergoing clinical evaluation and have potential advantages over their 68Ga-labeled counterparts, such as long half-life, large batch size, and small positron range.[14–16] In addition, 18F-PSMA-1007 is minimally excreted by the urinary tract, which is an advantage in pelvic imaging.[14] Therefore, it is important to establish the diagnostic value of 18F-PSMA PET/CT in the setting of PCa.
This meta-analysis focused on three 18F-labeled PSMA ligands, specifically, 18F-PSMA-1007, 18F-rhPSMA-7, and 18F-DCFPyL. To date, a number of studies have been conducted on the accuracy of 18F-PSMA PET/CT in determining preoperative lymph node staging in PCa. However, no systematic reviews and meta-analyses have been reported and its diagnostic value is yet to be validated. The main objective of the current study was to establish the accuracy of 18F-PSMA PET/CT in lymph node staging of PCa.
Methods Literature searchThis systematic review and meta-analysis was conducted in accordance with the Preferred Reporting Items for Systematic Reviews and Meta-Analyses (PRISMA) statement and registered in the International Prospective Register of Systematic Reviews (No. CRD42023391101).[17] The search strategies were displayed in Supplementary Table 1, https://links.lww.com/CM9/B723. Studies in EMBASE, PubMed, Cochrane Library, and Web of Science electronic databases were searched from the time of database creation to October 1, 2022. We used PCa, 18F, lymph node, positron emission tomography/computed tomography, and prostate-specific membrane antigen as search terms and limited the language to English. We additionally performed a manual search using reference lists of key articles published in English. This process was performed independently by two researchers. Any disagreements were resolved by a third researcher.
Inclusion and exclusion criteriaStudies evaluating the accuracy of 18F-PSMA PET/CT for lymph node staging in intermediate/high-risk PCa were included. To be eligible, patients had to be diagnosed with PCa using a gold standard pathological biopsy. In addition, studies had to provide diagnostic performance metrics (true positives, true negatives, false negatives, and false negatives) to construct a 2 × 2 contingency table. Duplicate articles, low-quality studies, letters, reviews, case reports, animal studies, expert opinions, and editorials were analyzed and excluded separately. This process was performed independently by two researchers. Any disagreements were resolved by a third researcher.
Data extractionWe incorporated the following data from each article into the meta-analysis: author, publication year, study design, study population, patient recruitment time, ligand, dose, uptake time, lymph node dissection, patient age, preoperative prostate specific antigen (PSA), and patient population characteristics, i.e., high/medium risk. The number of true positives, true negatives, false negatives, and false negatives were additionally recorded. This process was performed independently by two researchers. Any disagreements were resolved by a third researcher.
Quality evaluationThe Quality Assessment of Diagnostic Accuracy Studies 2 (QUADAS-2) tool was used to assess the quality of included studies.[18] The risk of bias and applicability was additionally assessed. Signal questions were included to facilitate judgment, signifying low risk if all signal answers for a domain were "yes" and a "no" answer to any question indicating potential bias. Concerns about applicability were defined as "low", "high", or "unclear". This process was performed independently by two researchers. Any disagreements were resolved by a third researcher.
Statistical analysisThe Stata 17 (StataCorp LP, College Station, TX, USA) tool was employed for statistical analysis. Results were analyzed at both the patient and lesion levels. The Q test was used to verify the heterogeneity between the included studies. Differences between studies were considered significant at I2 >50%.[19] In case of heterogeneity, potential sources were investigated using meta-regression and subgroup analyses, which were performed on study design (prodesign), gold standard selection and description (samemth and reftest), diagnostic test to be assessed (index), and patient characteristics (subject). A bivariate model was utilized to calculate the pooled sensitivity, specificity, positive and negative likelihood ratio (PLR and NLR), diagnostic odds ratio (DOR) and 95% confidence interval (CI).[20] We calculated the area under the receiver operator characteristic curve (summary receiver operating characteristic [SROC], area under the curve [AUC]).[21] Deek's Funnel plot was generated to assess the publication bias.[22] Sensitivity analysis was conducted to assess the robustness of the obtained results. Data were considered statistically significant at P <0.05.
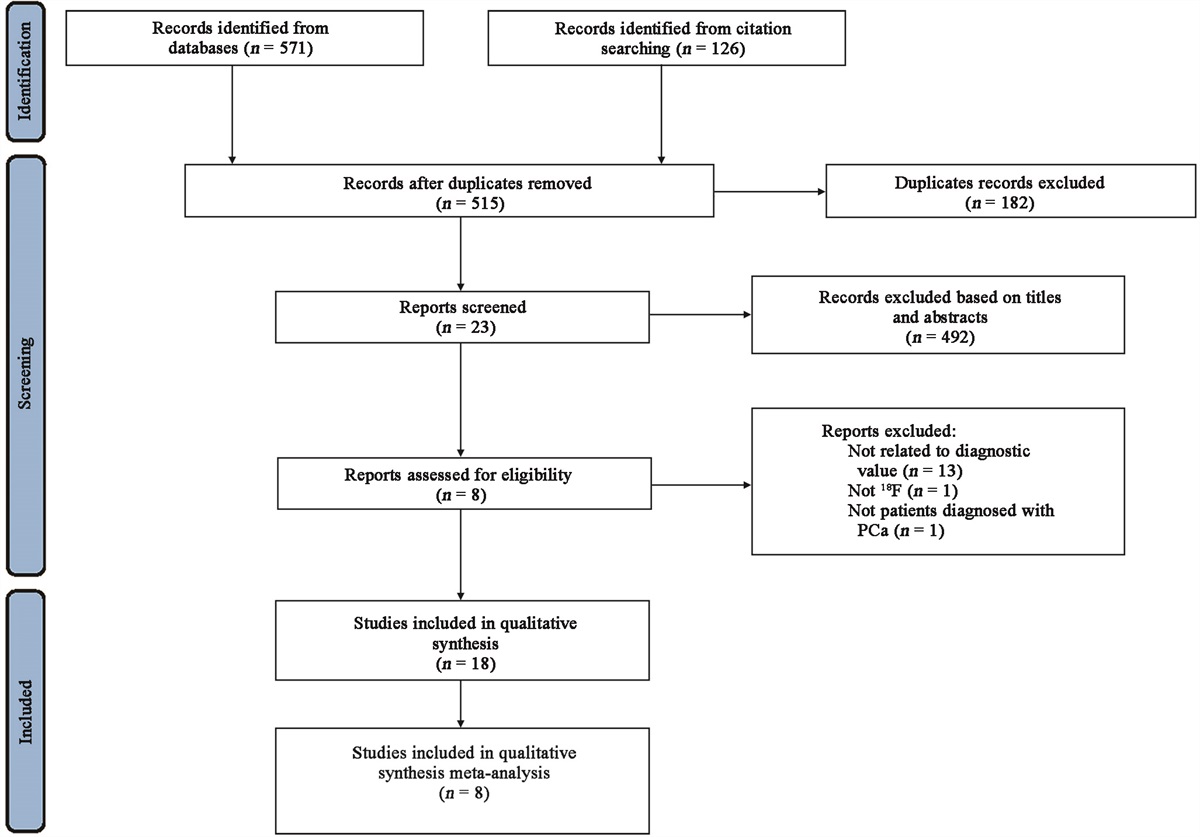
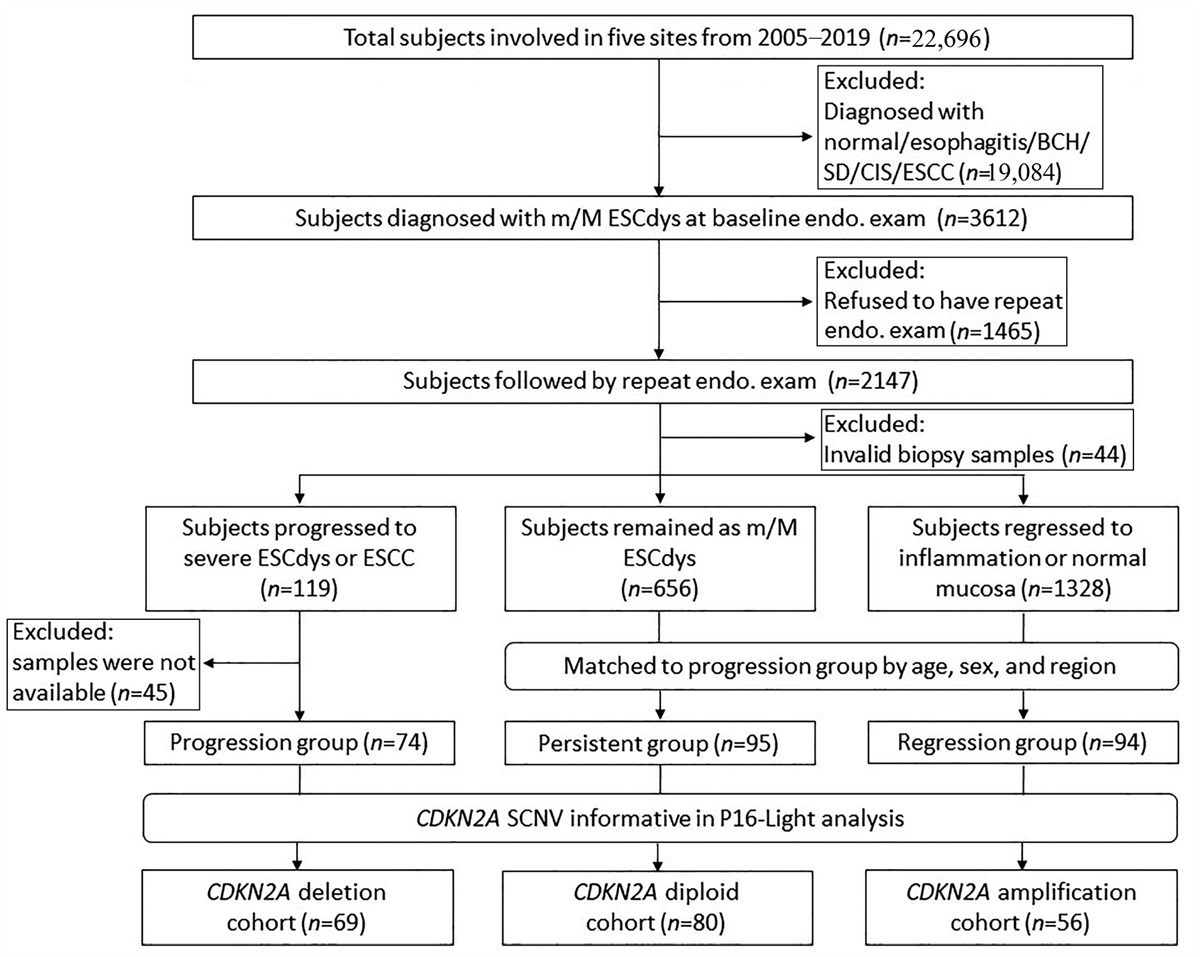
Results Literature searchA total of 697 articles were highlighted from an initial search of relevant online databases and reference lists. Among these studies, 182 duplicate records were excluded. After reviewing titles and abstracts, 492 articles were excluded. The full text of the remaining 23 articles was reviewed. Based on full-text analysis and assessment of eligibility, 13 articles that were unrelated to diagnostic value, 1 that did not assess the accuracy of 18F-PSMA PET/CT, and 1 that did not assess the accuracy of gold standard pathological biopsy for patients with PCa were further excluded. Ultimately, eight studies met the inclusion criteria for the present meta-analysis.[23–30] The literature search and selection procedure are presented in Figure 1.
 Figure 1:
 Flow diagram of the study selection process. PCa: Prostate cancer.
Characteristics of included studiesIn Table 1, basic data from studies included in this meta-analysis, published between 2018 and 2022, are presented. Among the eight included studies, seven had available data for patient-level analyses and six had available data for lesion-level analyses. A total of 734 individuals and 6346 lymph nodes were included for analysis. The included literature contained four prospective and four retrospective studies. Five studies were single center and three were multicenter. Three types of ligands were investigated: 18F-PSMA-1007, 18F-rhPSMA-7, and 18F-DCFPyL. Simultaneously, the dose, uptake time, lymph node dissection, age, PSA, patient characteristics, and other data on patients included in each study were obtained.
Table 1 - Characteristics of the included studies evaluating 18F-PSMA PET/CT for lymph node staging in medium/high risk prostate cancer in the meta-analysis. Author Year Country Study design Study population Recruiting time Ligand Dose (MBq) Uptake time (min) Lymph node dissection Age (years) PSA (ng/mL) Patient characteristics R. Hermsen[23] 2022 Netherlands Prospective Single center Feb. 2019 to June 2021 18F-PSMA-1007 252.0 (241.0–259.0)* 109.0 (98.0–129.0)* ePLND 68.1 (6.6)† 9.5 (6.5–15.3)* 35 intermediate risk and 64 high risk J. Ingvar[24] 2022 Sweden Retrospective Single center May 2019 to Aug. 2021 18F-PSMA-1007 4.0 (3.7–6.7)/kg‡ 120 (115–130)‡ ePLND 66.0 (42–76)§ 12.6 (2.2–86)§ 24 intermediate risk and 80 high risk M. Kroenke[25] 2020 Germany Retrospective Single center July 2017 to June 2018 18F-rhPSMA-7 327.7 (327) (306.5–363) (132–410)|| 82 (79.5) (70–87.25) (60–153)|| ePLND 67.7 (68) (65–73) (48–80)|| 18.1 (12.2) (7.3–22.4) (1.2–81.6)|| High-risk S. Malaspina[26] 2021 Finland Prospective Single center NA 18F-PSMA-1007 250 (246–256) (206–279)¶ 60 (60–60) (59–63)¶ PLND 72 (66–77) (52–87)¶ 12 (7–23) (3–2000)¶ 17 intermediate risk and 62 high risk B. H. E. Jansen[27] 2021 Netherlands Prospective Multicenter Oct. 2017 to Jan. 2020 18F-DCFPyL 311 (297–324)* 118 (112–123)* ePLND 67 (61–70)* 10.9 (7.2–20.8)* 43 intermediate risk and 74 high risk Michael A. Gorin[28] 2018 United States Retrospective Single center Mar. 2015 to Sep. 2016 18F-DCFPyL Approximately 333 Approximately 60 PLND 61 (49–75)‡ 9.3 (3.6–125.5)‡ High-risk Kenneth J. Pienta[29] 2021 United States Prospective Multicenter Nov. 2016 to July 2018 18F-DCFPyL 338 (237–389)‡ 74 (25–194)‡ ePLND 65 (46–84)‡ 9.7 (1.2–125.3)‡ High-risk K. Sprute[30] 2021 Germany Retrospective Multicentre July 2016 to Nov. 2019 18F-PSMA-1007 270 on average 90 (47–169)§ ePLND 69.5 (48–78)§ 10.5 (0.1–120.0)‡ NAData are shown as: *median (IQR), †mean±SD, ‡median (range), §mean (range), ||mean(median) (IQR) (range), ¶median (IQR) (range). 18F-PSMA PET/CT: 18F-prostate specific membrane antigen positron emission tomography/computerized tomography; ePLND: Extend pelvic lymph node dissection; IQR: Interquartile range; NA: Not available; PLND: Pelvic lymph node dissection; PSA: Prostate specific antigen; SD: standard deviation.
The literature QUADAS scale displayed that the included articles were of high quality. The research quality evaluation is presented in Table 2. In the patient selection domain, one study was rated as an unclear risk owing to no specific information (consecutive/random) on patient recruitment.[28] In the index test domain, one study was rated as unclear risk since it did not mention whether the index test results were interpreted without knowledge of the results of the reference standard.[30] In the reference standard domain, one study was rated as high risk since the reference standard was unblinded from PET results.[27] Two studies were rated as unclear risk due to no specific information on whether the reference standard results were interpreted without knowledge of the index test results.[23,30] In terms of flow and timing domain, five studies were rated as high risk, since the investigation by Sprute et al[30] did not utilize the same gold standard for all patients and in the other four studies, not all patients were included in the final analysis.[23,27–29]
Table 2 - Quality evaluation of the included studies evaluating 18F-PSMA PET/CT for lymph node staging in medium/high risk prostate cancer.[23–30] Author Year Risk of bias Applicability concerns Patient selection Index test Reference standard Flow and timing Patient selection Index test Reference standard R. Hermsen 2022 Low Low Unclear High Low Low Low J. Ingvar 2022 Low Low Low Low Low Low Low M. Kroenke 2020 Low Low Low Low Low Low Low S. Malaspina 2021 Low Low Low Low Low Low Low B. H. E. Jansen 2021 Low Low High High Low Low Low Michael A. Gorin 2018 Unclear Low Low High Low Low Low Kenneth J. Pienta 2021 Low Low Low High Low Low Low K. Sprute 2021 Low Unclear Unclear High Unclear Low Low18F-PSMA PET/CT: 18F-prostate specific membrane antigen positron emission tomography/computerized tomography.
The true positives, false positives, false negatives, and true negatives for each study are presented in Table 3. Following statistical analyses, I2 values >50% reflected high heterogeneity among the included studies. Therefore, a random-effects model was used to combine sensitivity and specificity.
Table 3 - The diagnostic performance metrics showed in the included studies evaluating 18F-PSMA PET/CT for lymph node staging in medium/high risk prostate cancer.[23–30] Author Year Patient level Lesion level Sample size TP FP FN TN Sample size TP FP FN TN R. Hermsen 2022 99 16 7 14 62 1188 8 26 54 1100 J. Ingvar 2022 104 7 3 19 75 2519 7 0 34 2478 M. Kroenke 2020 58 13 3 5 37 375 28 10 24 313 S. Malaspina 2021 79 27 1 4 47 NA NA NA NA NA B. H. E. Jansen 2021 117 7 6 10 94 468 8 10 15 435 Michael A. Gorin 2018 25 5 2 2 16 50 6 3 3 38 Kenneth J. Pienta 2021 252 25 4 37 186 NA NA NA NA NA K. Sprute 2021 NA NA NA NA NA 1746 84 8 34 162018F-PSMA PET/CT: 18F-prostate specific membrane antigen positron emission tomography/computerized tomography; FN: False negative; FP: False positive; TN: True positive; TP: True positive; NA: Not available.
At the patient level, pooled sensitivity and specificity were recorded as 0.57 (95% CI 0.39–0.73) and 0.95 (95% CI 0.92–0.97), respectively [Figure 2A,B]. The Youden index was 0.52. Pooled PLR and NLR were 11.2 (95% CI 6.6–19.0) and 0.46 (95% CI 0.31–0.68), respectively, and DOR was 25 (95% CI 11–54). The overall SROC curve, with an AUC of 0.94 (95% CI 0.92–0.96), is presented in Figure 3A.
 Figure 2:
 Forest plot of 18F-PSMA PET/CT for lymph node staging. (A,B) Sensitivity and specificity at the patient level. (C,D) Sensitivity and specificity at the lesion level. 18F-PSMA PET/CT: 18F-prostate specific membrane antigen positron emission tomography/computerized tomography.
 Figure 3:
 SROC curve. (A) Patient-level. (B) Lesion-level. AUC: area under the curve; SROC: Summary receiver operating characteristic.
At the lesion level, pooled sensitivity and specificity were recorded as 0.40 (95% CI 0.21–0.62) and 0.99 (95% CI 0.95–1.00), respectively [Figure 2C,D]. The Youden index was 0.39. Pooled PLRs and NLRs were 40.0 (95% CI 9.1–176.3) and 0.61 (95% CI 0.42–0.87), respectively, and the DOR was 66 (95% CI 14–311). The overall SROC curve, with an AUC of 0.86 (95% CI 0.83–0.89), is presented in Figure 3B.
Meta regression and subgroup analysisIn the Forest plot of included studies, samemth and subject had significant effects on sensitivity and predesign and reftests had significant effects on specificity at the patient level [Figure 4A]. These factors could represent sources of heterogeneity. At the lesion level, samemth and index had significant effects on specificity [Figure 4B]. Sensitivity analysis revealed that sensitivity and specificity were not significantly changed after excluding these studies, both at the patient and lesion level [Figure 5]. The Deek's Funnel chart suggested no publication bias at both the patient (P = 0.847, Figure 6A) and lesion level (P = 0.498, Figure 6B).
 Figure 4:
 Meta regression and subgroup analysis. (A) Patient-level. (B) Lesion-level. *P <0.05, †P <0.01, ‡P <0.001. CI: Confidence interval.
 Figure 5:
 Sensitivity analysis. CI: Confidence interval.
 Figure 6:
 Deek's Funnel plot to evaluate publication bias. (A) Patient-level. (B) Lesion-level.
DiscussionThe pioneering meta analysis evaluated the diagnostic efficacy of 18F-PSMA PET/CT in lymph node staging of intermediate-/high-risk PCa. 18F-PSMA PET/CT demonstrated moderate sensitivity and high specificity in lymph node staging of intermediate/high-risk PCa, supporting its clinical utility. The current gold standard for lymph node staging in intermediate/high PCa is ePLND. However, this method has a number of limitations and is associated with complications, such as lymph node enlargement, deep vein thrombosis, lower leg edema, blood loss, iliac vessel injury, ureteral injury, longer operative time, and longer hospital stay.[7–9] The clinical value of PLND is controversial, with a number of studies showing no oncological benefits,highlighting the requirement for an effective non-invasive diagnostic approach.[31–33]
Over the past decade, a variety of non-invasive imaging examinations have been developed. A meta-analysis
留言 (0)