
記住我
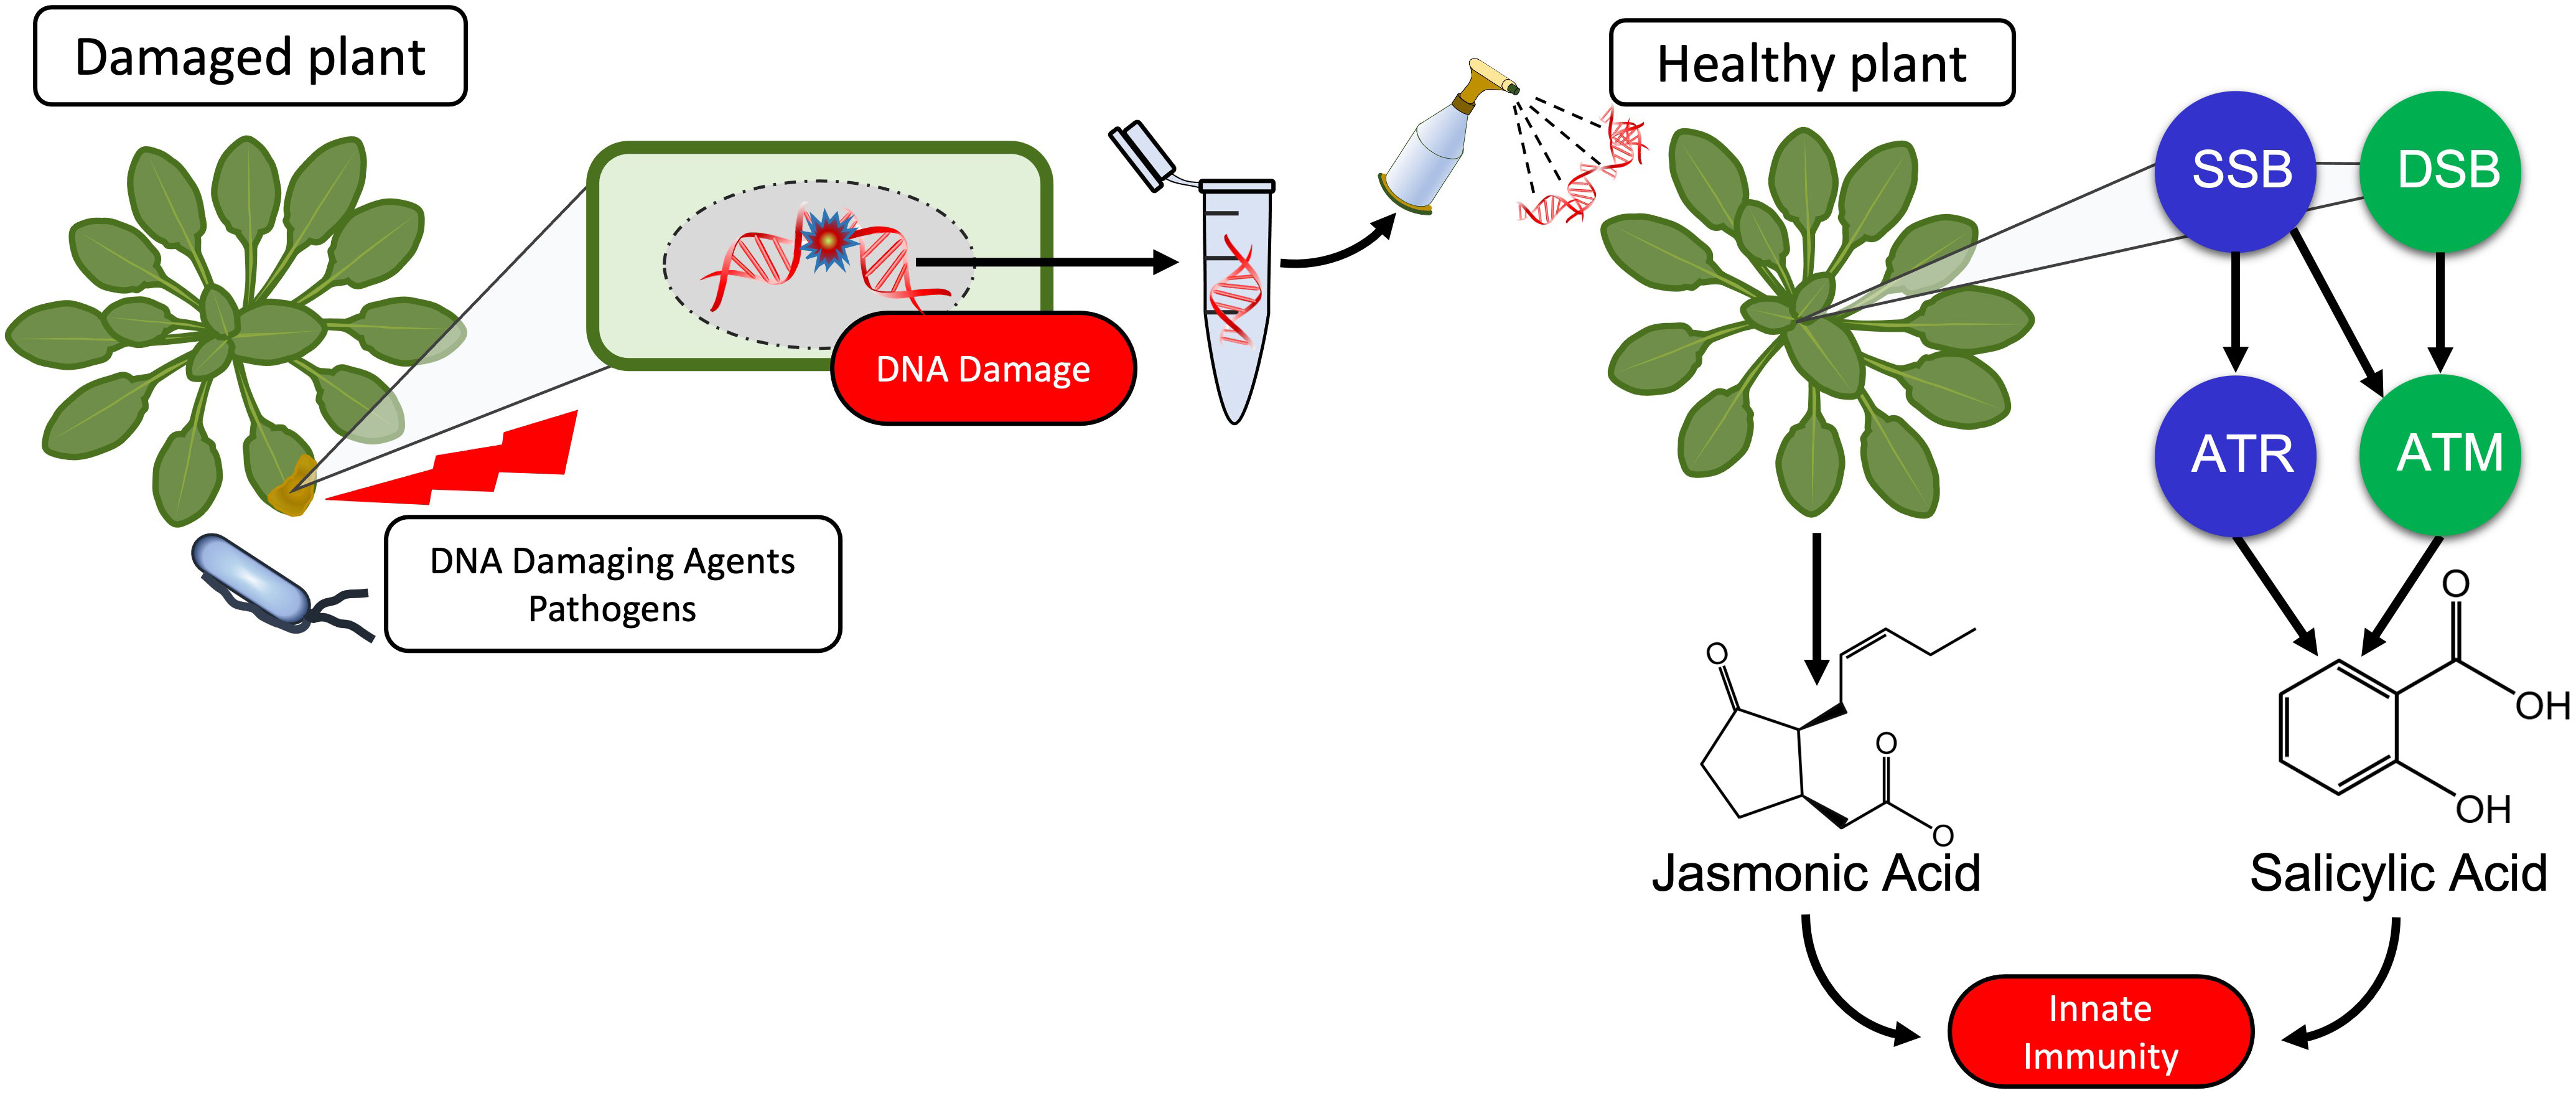
Graphical Abstract
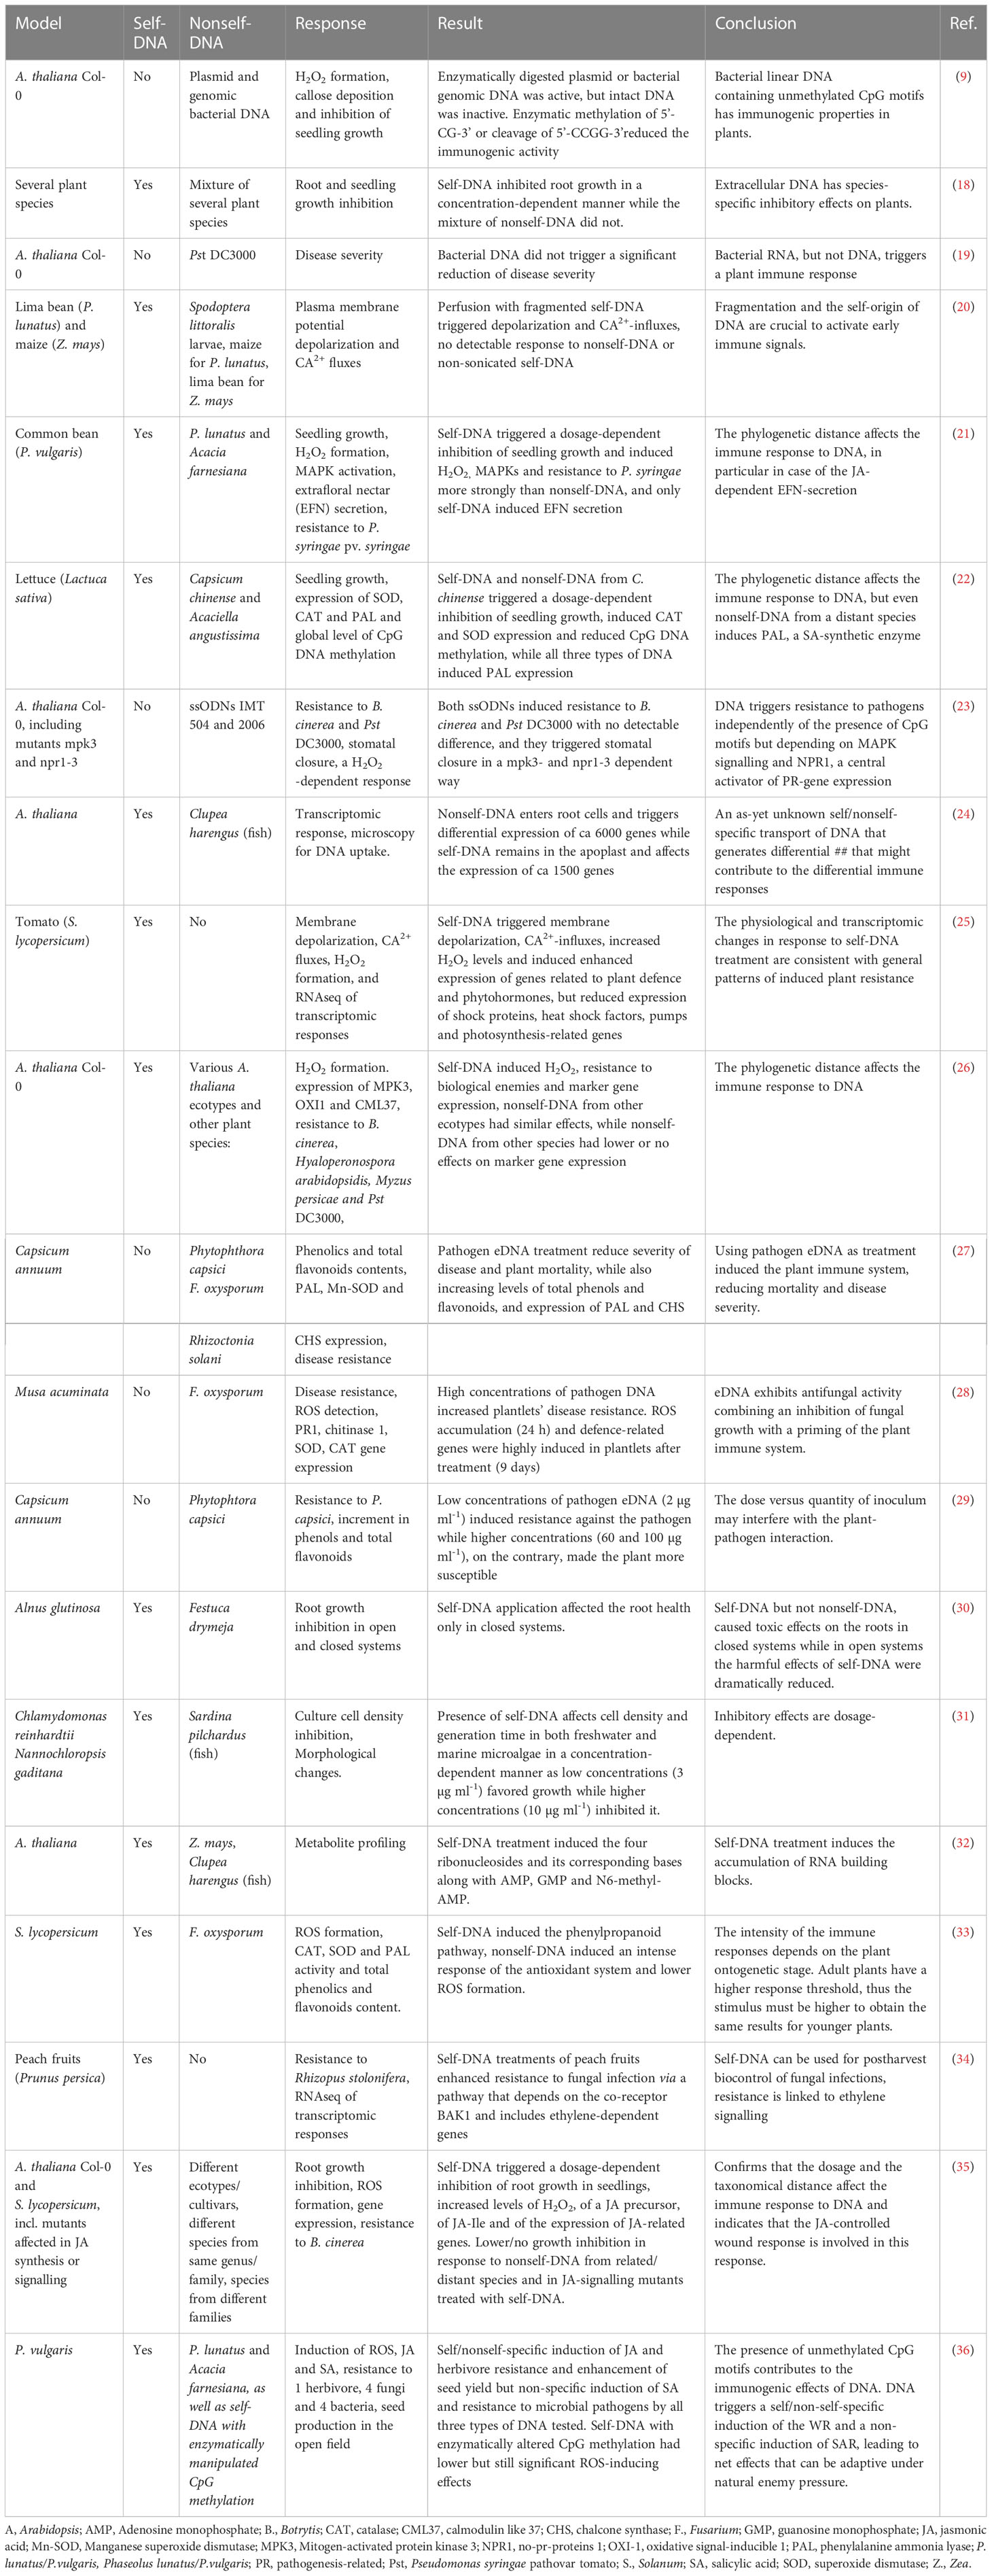
1 IntroductionThe immunogenic effects of DNA are known since Alick Isaacs’ group reported in 1963 on nonself-nucleic acids as a stimulus to produce interferon (1, 2) although it is worth to note that already Mechnikov in his Nobel Speech in 1908 had mentioned “surgeons who introduce … nucleic acid or other substance, with the object of bringing to the scene a protective army of phagocytes to ward the microbes off” (3). Since then, tremendous progress has been achieved in our understanding of how the mammalian immune system detects bacterial or viral nucleic acids as pathogen-associated molecular patterns (PAMPs) in order to mount an adequate immune response (4–9). “The dark side of DNA” (10) - immune responses to self-DNA – has only recently been considered feasible, violating the immunological paradigm of self-tolerance and thereby sparking controversy. Inappropriate activation of DNA sensors such as cyclic GMP-AMP synthase (cGAS) or Toll-like receptor (TLR 9) by self-DNA has been related to aberrant type I interferon signalling and ongoing inflammation in autoimmune and autoinflammatory disorders as well as in infectious (usually viral) diseases (11–15). Nevertheless, the preference of TLR9 for unmethylated CpG motifs and the expression of cGAS and other DNA sensors in the cytoplasm usually enables the mammalian immune system to limit activation by self-DNA to situations in which delocalized fragments of self-DNA are sensed as a ‘damage-associated molecular patterns’ (DAMPs): endogenous molecules that have an ‘all-day job’ in the intact cell but serve as danger signals when they appear in aberrant compartments (16). A search in Clarivate Web of Science™ (17) for ‘DNA sensing’ currently yields over 25,000 results (search term ‘DNA sensing’ in ‘topic’ performed on 29th of January 2023). By contrast, only a handful of studies over the last 15 years have investigated DNA-activated immunity in plants (Table 1).
Table 1 Reports on plant immune responses to exogenously applied DNA.
Treatments with plant DNA, genomic or plasmid bacterial DNA, or synthetic single stranded oligodeoxynucleotides (ssODNs), were shown to trigger early immune responses that are highly conserved between plants and mammals, including Ca2+ fluxes, membrane depolarization, the formation of reactive oxygen species (ROS) such as hydrogen peroxide (H2O2), or the activation of mitogen-activated protein kinases (MAPKs) (9, 20–22, 25, 27, 34, 35). The responses include massive transcriptomic reprogramming (24, 25, 35), and studies at the phenotypic level reported not only increased immunity (‘resistance’) to microbial pathogens, but also increased ‘defence’ to plant-specific pests such as leaf and sap-sucking herbivores (21, 23, 26, 27, 29, 33–36). Strikingly, stronger responses to self- in comparison to nonself-DNA were reported in most, although not all, of the studies that compared DNA from different sources. Even the ‘Mazzoleni-effect’ – a dosage-dependent inhibition of growth by self-DNA, but not nonself-DNA that has been described originally by the group of Stefano Mazzoleni – could subsequently be confirmed in different models, including a tree (Alnus glutinosa), freshwater and marine algae and the nematode, Caenorhabditis elegans (18, 21, 22, 30, 31, 35, 37, 38). Differential responses to self- versus nonself-DNA are significant even when nonself-DNA from closely related genotypes (species of the same genus or ecotypes of the same species) is used (21, 26, 31, 35, 36, 38).
Plants coordinate their responses to attack by biological enemies via two major signalling pathways: the jasmonic acid (JA)-dependent wound response (WR) and salicylic acid (SA)-dependent systemic acquired resistance (SAR). The WR is activated upon mechanical damage, feeding by herbivores or infection by necrotrophic pathogens that cause intensive tissue damage. Detection of these events depends on membrane-bound pattern recognition receptors (PRRs) that sense molecular nonself patterns from the herbivore (i.e., herbivore-associated molecular patterns, HAMPs) or DAMPs that are released upon cell disruption, including sucrose, glutamate, cell wall components such as oligogalacturonides, signalling peptides, extracellular ATP, high mobility group box proteins (HMGB) and – most likely - self-DNA (21, 39–44). Upon sensing of HAMPs or DAMPs, metabolic reprogramming allows for the induction of numerous JA-responsive mechanical, biochemical and chemical mechanisms that exert repellent, toxic or otherwise detrimental effects on enemies whose feeding habit exposes them to the intracellular contents of their host. In contrast, SAR is activated in response to biotrophic pathogens and sucking herbivores that generate only minor physical damage. Perception of these events also relies on PRR sensing of PAMPs and the subsequent sensing of effectors which lead to accumulation of ROS, phytoalexins, programmed cell death and the systemic induction of multiple SA-dependent pathogenesis-related (PR) proteins including PR1, chitinases, β-1,3-glucanases and thaumatin-like proteins. Both the WR and SAR usually lead to a systemic so-called ‘pattern-triggered immunity’ (PTI) even after local attack. Considering the different roles of DAMPs and PAMPs in the activation of PTI, it seems reasonable to assume that self- and nonself DNA is sensed as a DAMP or a PAMP respectively, similar to the roles that place DNA sensors such as cGAS and TLR9 inflammasome-forming DNA receptors at the centre of mammalian innate immunity to pathogens, cancer and damage by abiotic factors (6, 15, 45, 46).
Alternatively, exogenously applied DNA could trigger the DNA damage response (DDR): A highly conserved system enabling eukaryotes to detect and repair damage to their genomic, plastid and mitochondrial DNA resulting from the effects of external abiotic and biotic factors but also during vital processes including photosynthesis, oxidative phosphorylation and DNA transcription and synthesis (47–51). Pharmacological studies that link DNA damage to the resistance of pea plants to fungal pathogens date back to the early 1970s (52–54), reviewed in (55, 56). Since then, it has become increasingly evident that activation of the DDR and of innate immunity are closely related (57–62). Current knowledge does not provide sufficient evidence to favour one of the proposed models (DAMP/PAMP-triggered PTI versus DDR activation) over the other. In principle, PTI, being a mechanism which evolved for the perception of exogenous threats, could be considered more likely to respond in a self/nonself-specific way to exogenously applied DNA fragments than the DDR, which evolved to detect damaged self-DNA. However, on the one hand, an induction by DNA has been reported for traits that are typically controlled via WR as well as SAR. Further, more recent support for the PTI model comes from a study that linked resistance-induction by self-DNA in peach (Prunus persica) fruits to the brassinosteroid insensitive 1-associated receptor kinase 1 (BAK1) – a cytoplasmatic co-receptor that interacts with various PRRs of DAMPs and PAMPs (34) - and from two studies that reported self-DNA-induced JA-synthesis in A. thaliana and common bean (Phaseolus vulgaris) (35, 36). On the other hand, self-/nonself specific effects are mainly reported for early, not enemy-specific immune signals which have also been reported for the DDR, and as far as we know, no PRRs that could act as dsDNA receptors have been reported for plants or could be predicted by in silico approaches (4, 63–65). Therefore, the main goal of our present study was to investigate which of the before mentioned models provides the more promising framework to guide future research and to compare the effects of sonicated DNA to DNA fragments produced under more realistic scenarios. We hypothesized that the DDR, as the more conserved mechanism of sensing damaged DNA, should play a role in the innate immunity induction by fragmented DNA but perhaps not be sufficient to control the differential responses to DNA from different sources.
To characterise the self/nonself-specific immune response to DNA in the model plant, Arabidopsis thaliana Col-0, we treated Col-0 plants with sonicated self-DNA from other plants of the same ecotype, nonself-DNA from A. thaliana ecotype Cape Verde islands (Cvi-0) or nonself-DNA from broccoli (Brassica oleracea var. italica, ‘Br’) and quantified H2O2 as an early, nonspecific signal and the hormones, JA and SA, as later signals specifically involved in the WR or SAR, respectively. ROS including H2O2 are known as endogenous DNA-damaging factors that are generated during all basal metabolic processes that include oxidative phosphorylation, but they also serve as local defence against invading pathogens and play a central role as signals that trigger the local and in the form of the ROS-wave, systemic activation of innate immune responses (66, 67). Although ROS had originally been considered mainly in the context of SAR, more recent evidence demonstrates their role in WR. The cognate receptor of eATP, a well-established DAMP in plants, is a lectin-type receptor like kinase that upon sensing eATP activates the ROS-wave by inducing NADPH oxidase-dependent superoxide activation (68). The role of JA as the mobile signal in the WR and the essential role of SA in the systemic tissue response (although not as the mobile signal) are generally accepted. SA is important for SAR activation since the SA receptor, “NO pathogenesis-related protein 1 (NPR1)” serves as a transcription factor for PR1 expression (69, 70). In homeostasis, NPR1 is a cytoplasmic oligomer, but upon binding SA, NPR1 monomers are formed and translocated to the nucleus, where they bind to the PR1 promoter facilitating its expression (69). NPR1 also seems to be involved in coordinating the WR-SAR trade-off. However, doubts remain concerning to which precursors liberated from different substrates and two major biosynthetic pathways contribute to the accumulation of JA and SA in response to wounding and infection, respectively (71–78). Therefore, we opted for a quantification of the hormones themselves.
As a first step to elucidate a potential role for the DDR, we used T- DNA insertion lines of the two master kinases: Ataxia Telangiectasia Mutated (ATM) and ATM AND RAD3-RELATED (ATR) (47, 51, 62, 79, 80). Although neither of these kinases are directly involved in damage recognition, they associate with DNA binding proteins, recruit and/or activate additional proteins and thus, organise large protein complexes that are required for a rapid and efficient repair. While ATR is mainly activated by single-strand breaks (SSBs), ATM is activated by double-strand breaks (DSBs) (47, 51, 62, 79, 80).
In WT, JA increased in response to DNA from all three sources, although with self/nonself-specific quantitative differences, whereas SA and H2O2 increased only in response to DNA from the two A. thaliana ecotypes. Surprisingly, the atm and atr mutants were unaffected in the self/nonself-specific induction of JA, whereas both failed to respond to DNA with a detectable increase in H2O2 or SA. Interestingly, all three sources of DNA induced phenotypic resistance to Pst DC3000 in atr but not atm mutant lines. We interpret these results as a preliminary demonstration of a role for the DDR in the induction of SA by exogenous DNA, whereas a DDR-independent mechanism enables plants to perceive self-DNA as a DAMP to activate a JA-dependent wound response.
2 Materials and methods2.1 Plant material and bacterial strainsWild type Arabidopsis thaliana Col-0 plants were donated by Stefano Mazzoleni (Naples, Italy), T-DNA insertion lines atm-1 (SALK_040423C) and atr-2 (SALK_032841C) were acquired from European Arabidopsis Stock Centre, Nottingham, UK (NASC), A. thaliana ecotype Cape Verde islands (Cvi-0) were donated by Jean-Philippe Vielle-Calzada (Irapuato, Mexico) and Brassica oleracea seeds were purchased from Rancho Los Molinos (Tepoztlán, Morelos, Mexico). We used A. thaliana Col-0 as sources of self -DNA and A. thaliana Cvi-0 and B. oleraceaas sources of non-self-DNA. A. thaliana plants were grown in a growth chamber with a photoperiod of 16 h/8 h light/dark at 23°C with 70% relative humidity for 3 week in a substrate composed of 3:1:1 (v:v:v) of Sunshine Mix #3 (Sungro horticulture Agawam, MA, USA), vermiculite (Sungro) and perlite (Termolita, Santa Catarina, Mx). B. oleracea plants were cultivated in the same substrate in a greenhouse under natural light and photoperiod conditions at an average temperature of 28°C (day) and 20°C (night). T-DNA insertion lines were genotyped using the protocol recommended by NASC (81) and the primers listed in Supplementary Figure S5. PCR conditions using a C1000 Thermal cycler (Biorad, Hercules, CA, USA) were as follows: initial denaturalization at 94°C for 3 min, followed by 30 cycles as follows: 94°C for 30 s, 55°C (for atr samples) or 58°C (for atm samples) for 30 s, 72°C for 2 min and a final extension at 72°C for 10 min.
Pseudomonas syringae pv. tomato DC3000 (Pst DC3000) were donated by John Délano-Frier (Irapuato, Mexico) and Pseudomonas syringae pv. glycinea carrying vector pVSP61 [Psg (–)] or the vector pV288 containing the effector avrRpt2 [Psg (+)] were donated by Andrew F. Bent (Madison, WI, USA) (82). These strains were cultured at 28°C with peptone-yeast-glycerol agar (NYGA) (83) containing 25 µg ml-1 kanamycin (Sigma-Aldrich, St. Louis, MO, USA).
2.2 Extraction and preparation of DNAThe extraction of DNA from leaves of A. thaliana Col-0, A. thaliana Cvi-0 and B. oleracea was based on a method reported by Healey & col (84). A total of 20 ml of cetyltrimethylammonium bromide (CTAB) buffer (1.5% CTAB, 100 mM Tris-HCl pH 8, 20 mM EDTA pH 8, 1.4 M NaCl and 2% β-mercaptoethanol in water, all from Sigma-Aldrich) were added per 5 g of ground tissue in 50 ml tubes, shaken on a vortex and heated to 65°C for 30 min in a water bath. Then, 20 ml of 24:1 chloroform:isoamyl alcohol (Karal, Leon, Gto, Mexico) was added and shaken on a vortex. The tubes were centrifuged at 3000 g for 5 min at 4°C and the supernatant was transferred to a new 50 ml tube. Next, 20 ml of precooled isopropanol and 2 ml of ammonium acetate 7.5 M (Karal, Leon, Gto, Mexico) were added to the supernatant, which was kept at –20°C. After 1 h, the tubes were centrifuged at 3000 g for 20 min at 4°C, the supernatant was discarded, and the pellet was dried for 5 min at room temperature before washing by adding 5 ml of 70% ethanol (Karal, Leon, Gto, Mexico) and shaking. After further centrifugation at 3000 g for 10 min at 4°C, the supernatant was discarded, the pellet was dried for 5 min and re-suspended in 1 ml of sterile distilled water for subsequent purification using a Maxi DNA purification Kit (Qiagen, Hilden, Germany). The DNA was quantified using a NanoDrop 2000 spectrometer (Thermo Fisher Scientific, Waltham, MA, USA). To obtain fragments shorter than 1000 bp, a solution of 500 μg ml–1 of DNA in sterile distilled water was sonicated using a CP505 ultrasonic processor (Cole Parmer, Vernon Hills, IL, USA) for 3:30 min at 55% of amplitude and using pulse mode (1 s pulse ‘On’ and a 1 s pulse ‘Off’). The successful fragmentation of DNA was verified by gel electrophoresis on a 2.2% agarose gel using ethidium bromide staining (Thermo Fisher) (Supplementary Figure S1).
2.3 Quantification of responding signals2.3.1 ROS (H2O2) levelsTo characterise the ROS response to exogenous DNA fragments, two initial experiments were carried out. In the first one, we treated plants with fragmented self-DNA at 5 µg ml−1 or 50 µg ml− 1 in 0.05% v v−1 Tween 20 and sampled at 0, 5, 10, 15, 30, 45 and 60 min after treatment, in the second one, we treated plants with 0, 0.005, 0.05, 0.5, 5 or 50 µg ml−1 self-DNA and sampled at 15 min after treatment. The rosettes of 15 plants were cut off at the base, pooled in groups of three rosettes to give 5 biologically independent replicates per time point and ground in liquid nitrogen. Subsequently, we added 0.1% trichloroacetic acid (250 µl) (Sigma-Aldrich), 250 µl of potassium phosphate buffer 10mM, pH 5.8 and 500 µl of sodium iodide 1M (both from JT Baker, Phillipsburg, NJ, USA) to 150 mg of ground tissue, samples were shaken and incubated at 4°C for 10 min in the dark. After centrifugation at 12,000 g for 15 min at 4°C, 200 µl of supernatant were placed in microplate wells and incubated in the dark for 20 min at room temperature. Hydrogen peroxide quantification (85) was carried out using NaI (JT Baker) instead of KI and absorbance was measured at 350 nm in a µQuant microplate reader (BioTek Instruments, Winooski, VT, USA). Samples and blanks were compared to a calibration curve obtained using H2O2 at concentrations of 0–250 nmol ml-1. To visually detect the accumulation of ROS, after 15 min, leaves were stained with 3,3-diaminobenzidine (Sigma-Aldrich) as described previously (86). For subsequent experiments DNA was applied at 5 µg ml−1 self-DNA and samples were taken at 15 min after treatment.
2.3.2 Quantification of JA and SATo quantify the levels of JA and SA, fragmented self and nonself-DNA (5 µg ml−1 in 0.05% v v−1 Tween 20, Sigma-Aldrich) was sprayed on both sides of the rosette leaves of each plant until the leaf surface was soaked. Samples for JA analysis were collected at 0, 5, 10, 15, 30, 45 or 60 min after treatment and those for SA analysis at 0, 12, 24 or 48 h as described above to yield 5 biologically independent replicates per time point.
The extraction of JA was carried out as described in (87). 0.5 ml of ethyl acetate and 20 µl of 0.1 mg ml-1 (9,10- H2)-dihydrojasmonic acid as an internal standard (both from Sigma-Aldrich) were added to 250 mg of tissue, shaken and kept at 4°C overnight. After centrifugation at 14000 g for 15 min at 4°C, the supernatant was collected, and the pellet was re-extracted with 0.5 ml of ethyl acetate and centrifuged. The supernatants were combined and evaporated in a miVac concentrator (GeneVac, Warminster, PA, USA) with gaseous nitrogen. The residue was derivatized by adding 100 µL of N´N´-disopropylethylamine, 100 µl of chloroform and 10 µl of pentafluorobenzyl bromide (Sigma-Aldrich) at 60°C under an extraction hood (88). After 30 min, the resultant liquid was cooled on ice and evaporated with gaseous nitrogen. The residue was re-suspended with 100 µl of HPLC grade methanol (Sigma-Aldrich) and used for JA quantification.
The extraction of SA was based on published methods (89, 90). In brief, 750 µl of 90% methanol and 250 ng ml-1 of ortho-anisic acid (as internal standard, Thermo Fisher) were added to 250 mg of ground tissue and extracted at 4°C overnight. After centrifugation at 13000 g for 15 min at 4°C, the supernatant was collected, the pellet was re-extracted with 750 μl of 90% methanol, and both supernatants were combined and evaporated in a miVac Concentrator plus (GeneVac) for 4 h. The residue was re-suspended with 500 μl of trichloroacetic acid 5% and centrifuged at 4000 g for 10 min at 4°C. The supernatant was mixed with two volumes of ethyl acetate-hexane (1: 1 v v-1, Sigma-Aldrich) and incubated at room temperature for 10 min. The organic phase was recovered and dried with gaseous nitrogen. The residue was derivatized by mixing with 20 µl of pyridine (JT Baker) and 80 μl of N,O-bis(trimethylsilyl)trifluoroacetamide (BSTFA; Sigma-Aldrich) and incubated at 80°C for 1 h, using an extraction hood. The resulting mixture was used for SA quantification using gas chromatography.
Both hormones were quantified using gas chromatography - electronic impact ionization mass spectrometry (GC-EIMS) in a 7890A Gas Chromatograph equipped with a DB-1MS UI column (60 m × 0.25 mm × 0.25 µm) coupled to a MSD 5973 mass spectrometer (Agilent Technologies, Santa Clara, CA, USA) in SIM mode, using ions 141, 181, 390 and 392 m z–1 for JA and 73, 135, 267 and 282 m z–1 for SA. An injection volume of 1 µl of sample was used in the splitless mode. For JA, the operating conditions (91) were an injector temperature of 200°C and an initial oven temperature of 150°C for 3 min, which was then ramped at 4°C min–1 to 300°C, with the final temperature maintained for 20 min. For SA we used an injector temperature of 200°C and an initial oven temperature of 150°C for 3 min, which was then ramped at 4°C min–1 to 260°C, with the final temperature maintained for 25 min. Helium was used as a carrier gas with a constant flow of 1 ml min–1 and standard curves were prepared using pure compounds (JA, Sigma-Aldrich; SA, JT Baker) to quantify the respective amounts of JA and SA based on peak areas with reference to the internal standard.
2.4 In situ DNA fragmentation by pathogens and DNA-damaging agents2.4.1 Generation and elution of in situ damaged DNATo elucidate whether the effects of sonicated DNA are similar to those of naturally damaged DNA, we inoculated Col-0 plants with one of three bacterial strains: virulent Pst DC3000 and Psg (+) or the non-virulent Psg (–) (82, 92). The two virulent bacteria, Pst DC3000 and Psg avrRpt2 + have been reported to inflict damage to the DNA of their host plant (93). For inoculation, bacteria were resuspended in 10 mM MgCl2 (Sigma-Aldrich). After adjusting the bacterial suspension following an established protocol (A.F. Bent, personal communication) by quantifying optical density at 600nm (where od 0.1 = bacterial density of 108 cells) in a µQuant microplate reader (BioTek Instruments, Winooski, VT, USA) A. thaliana Col-0 plants were inoculated by spraying the rosette with a suspension of 108 colony forming units (CFUs) ml-1 in 10 mM MgCl2. Alternatively, the plants were syringe infiltrated with 100 µl of an aqueous solution of a DNA-damaging agent (56, 59, 93–95): 0.6 µg ml-1 bleomycin (Sigma-Aldrich), 100 µM SA (Sigma-Aldrich), or 80 mM H2O2 (Jaloma, Guadalajara, Jal, Mexico).
Damaged DNA was retrieved from bacteria-inoculated plants after 7 days and from plants infiltrated with SA, bleomycin and H2O2 after 24 h, 12 h or 3 h, respectively, adapting a method developed to quantify the leakage of NAD(P) from leaf disks floating on water (96). Thirty leaf discs of 6 mm diameter were harvested from 10 individual plants per treatment and pools of 10 leaf disks were placed in test tubes with 600 µl CTAB buffer. After shaking for 10 minutes, the buffer was recollected in a microcentrifuge tube and the leaked DNA was precipitated with 400 µl of isopropanol and 60 µl of ammonium acetate 7.5 M (Karal Leon, Gto, Mexico) and quantified using a NanoDrop 2000 spectrometer (Thermo Fisher Scientific, Waltham, MA, USA). To control for any artefacts resulting from DNA fragmentation during this process, we applied a mechanical stress control. For this we collected leaf discs from untreated plants, placed them in the buffer and gently pressed them repeatedly between a plastic stick and the tube, avoiding visible tissue disruption.
2.4.2 Analysis of fragmentation and H2O2-inducing properties of eluted DNATo evaluate the in situ fragmentation caused by the beforementioned treatments in comparison with the pattern observed in sonicated DNA, the DNA was visualized on a 2.2% agarose gel using ethidium bromide staining and the signal intensity of the fragments that fell within a size range of < 1000 bp in each lane was estimated using Image Lab (Biorad). To test these fragments for their ROS-inducing activities, we treated Col-0 plants with the eluted DNA and sampled these plants 15 min later to quantify H2O2-levels as described in section 2.3.1.
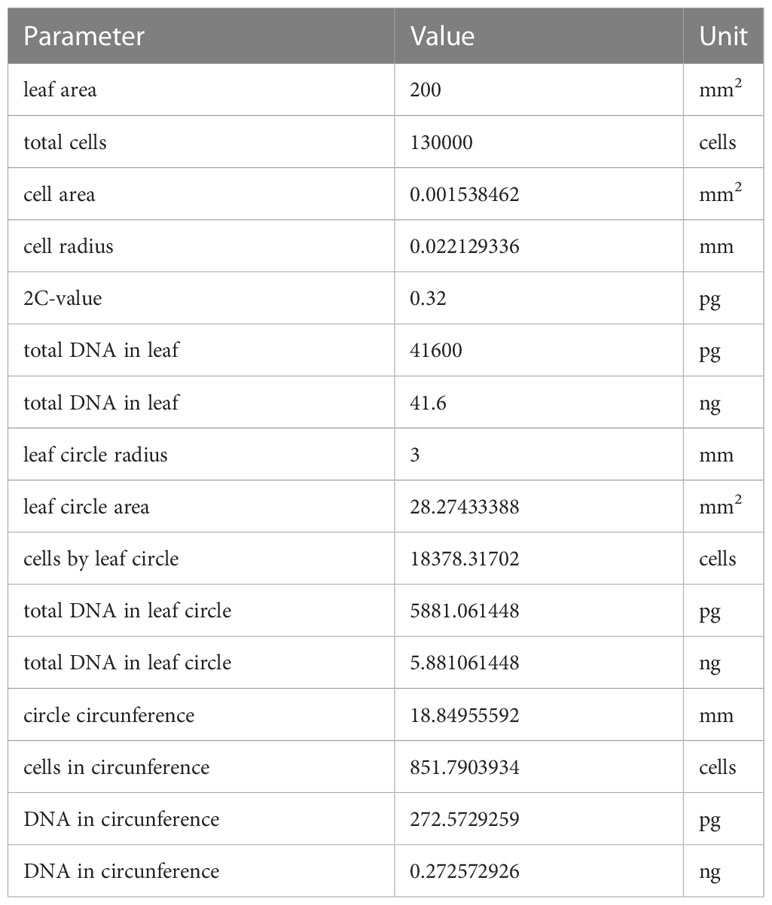
2.4.3 Estimation of total DNA amountThe expected total amount of DNA was calculated based on assuming a total number of 130,000 cells in a leaf with an area of 200 mm2 (97) and a 2C-value of 0.32pg (98). Based on these assumptions, we calculated an area of 0.0015 mm2 and a radius of 0.022 mm for the average cell, which translates to a total number of 18,400 cells in the entire leaf disc and of 850 cells in the circumference, with an expected total amount of 5.88 ng DNA in the entire disc and of 0.27 ng in the circumference (Table 2).
Table 2 Parameters and calculated values to estimate the expected total amount of DNA in leaf discs of 6mm.
2.5 Testing for TLR9-like responses2.5.1 Immunostimulatory oligonucleotidesTo determine importance of CpG motifs (23), the ODNs IMT504 (5’-CATCATTTTGTCATTTTGTCATT-3’) and 2006 (5’- TCGTCGTTTTGTCGTTTTGT-3’) and their complementary sequences (IMT504c: 5’- AATGACAAAATGACAAAATGATG-3’; 2006c: 5’-ACAAAACGACAAAACGACGA-3’) were purchased from Sigma Aldrich and used as single stranded DNA (ssDNA). To generate double stranded DNA (dsDNA), each ODN was annealed with its complementary sequence in a C1000 Thermal cycler (Biorad) by heating to 95°C for 3 minutes and cooling to room temperature.
2.5.2 Generation of CpG-methylated DNAIn order to obtain DNA with completely methylated CpG motifs, sonicated DNA of Col-0, Cvi-0 or Br was used as substrate for the CpG DNA methyltransferase from Spiroplasma sp. strain MW1 (M.SssI, Thermo Scientific #EM0821) (99). Methylation was performed according to the product manual. To evaluate the degree of methylation, non-fragmented DNA was treated with M.SssI and aliquots of 1 µg µl–1 of the product were digested with each of two restriction enzymes, MspI (Thermo-Scientific #ER0541) and HpaII (Invitrogen INVN093-6), according to the product manuals (Supplementary Figure S2).
2.5.3 Generation of unmethylated DNATo generate unmethylated DNA, genome amplification was performed using 15-mer random primers and non-fragmented DNA of Col-0, Cvi-0 or Br as a template for amplification via PCR in a C1000 Thermal cycler (Biorad), using the following conditions: initial denaturalization at 94°C for 2 min followed by 50 cycles as follows: 94°C for 1 min, alignment ramping from 28 to 55°C (0.1 °C s-1), 55°C for 4 min, extension at 68°C for 30 s and a final extension at 68°C for 8 min. PCR products were separated by gel electrophoresis on a 2.2% agarose gel.
2.6 Statistical analysesAll statistical analyses and plots were performed using R version 4.2.0 (100) with Rstudio version 2022.12.0.353 (101) as integrated development environment. Global data from each experimental set was tested by either one- or two-way analysis of variance (ANOVA), when significant differences were found (p < 0.05) a Tukey test was performed. For the dose response curve analyses, we used the drc package (102), while the tidyverse (103), multcompView (104), ggbeeswarm (105), ggtext (106), ggrepel (107) and rstatix (108) packages were used for creating the plots and general data wrangling. R scripts used for the statistical analyses and for creating the figures are available at GitHub as IsaacVegaM/PAPER_Vega_2023_exDNA_DDR.
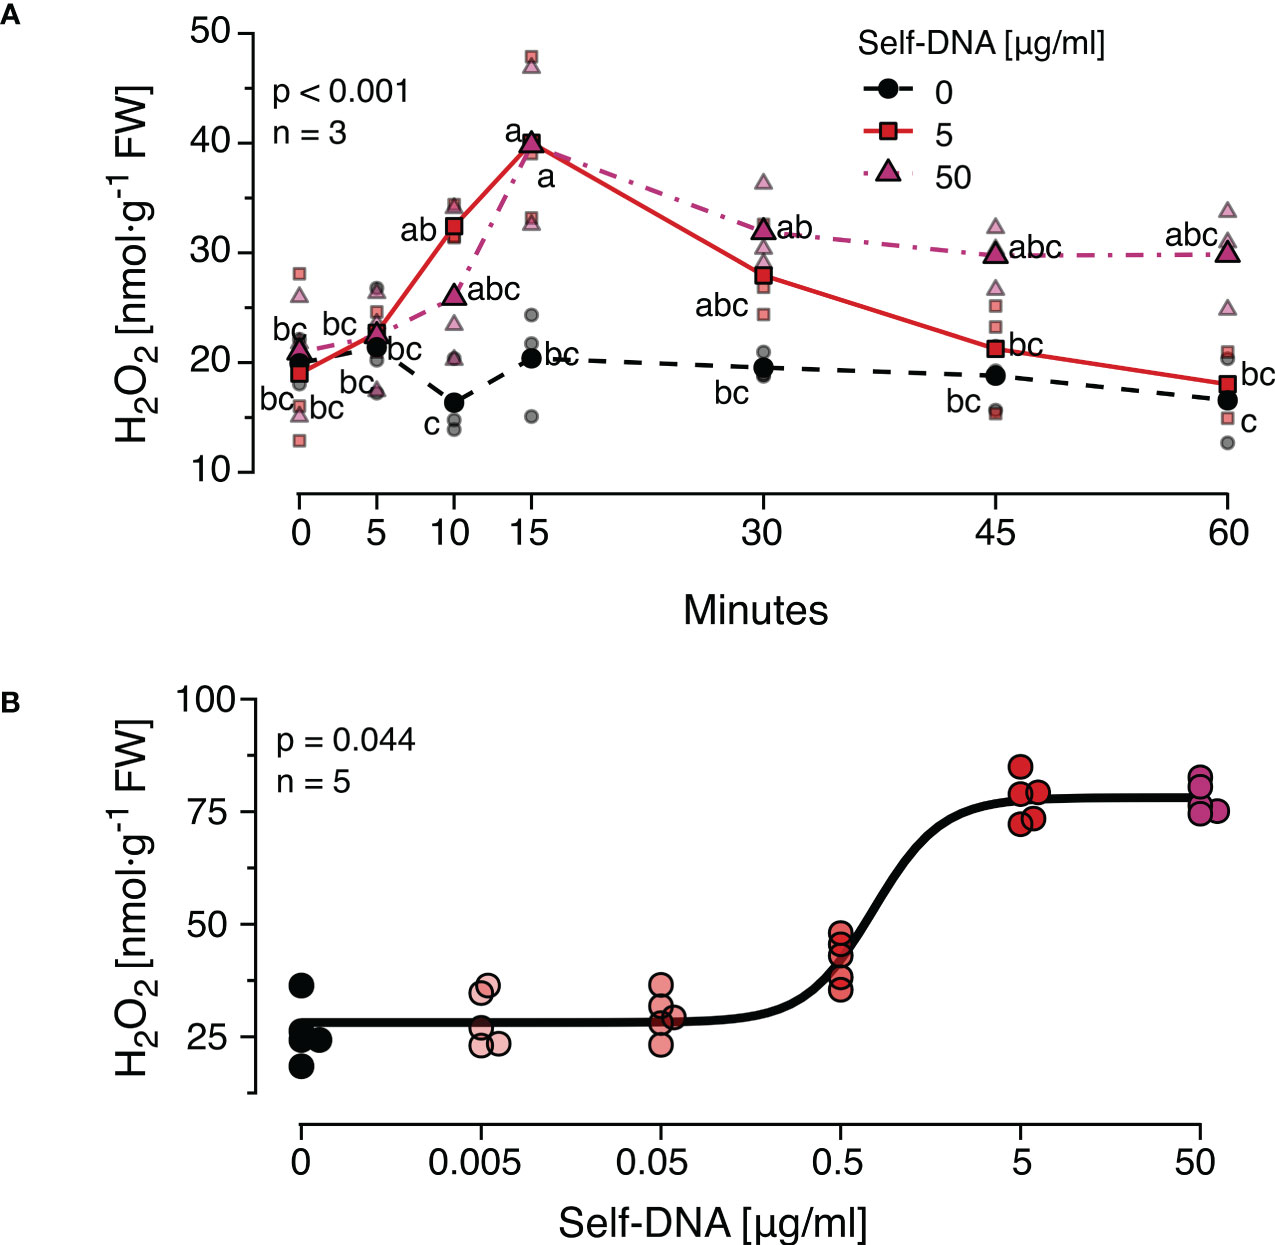
3 Results3.1 The ROS response to DNA is time- and dosage-dependentEarlier studies observed dosage-dependent effects of DNA on immune signals and seedling growth and revealed certain species-specific differences in the timing of the responses. Therefore, we first characterised the time course of H2O2 levels after treatment with different concentrations of self-DNA. We observed that H2O2 levels started to increase at 10 min, reached peak values at 15 min and returned to a base level at 60 min after treatment with 5 µg·ml-1 DNA but not 50 µg·ml-1 DNA (Figure 1A). Both DNA concentration and time after treatment had highly significant effects on H2O2 levels that were subject to a significant interaction (Figure 1A, see Supplementary Datasheet 1 for details). Based on these results, 15 min after treatment was selected as a standard sampling time for H2O2 quantification in all subsequent experiments.
Figure 1 The Arabidopsis thaliana ROS response to exogenous DNA. The level of ROS in [nmol H2O2 g-1 leaf fresh weight] was determined at different time points (A) or 15 min (B) after treating A. thaliana Col-0 plants with a solution of self-DNA in 0.05% v v−1 Tween 20. Controls (black symbols) were treated with 0.05% v v−1 Tween 20 in water. Different DNA concentrations are indicated as different saturations of red, symbols represent individual data points. In (A) dotted lines represent means and different letters indicate statistically significant differences at each time point among plants treated with different concentrations (p < 0.05, post hoc Tukey tests; p < 0.001 for time and for concentration, and p = 0.002 for the interaction according to two-way ANOVA, n = 3 biologically independent replicates per concentration and time point). In (B) the line shows the result of a log-logistic dose-response model adjusted to estimate the effective dose to trigger effects in 50% (ED50) of the individuals (n = 5 biologically independent replicates per concentration). See Supplementary Datasheet 1 for detailed results of statistical analyses.
In a second experiment, the threshold concentration of DNA required to trigger a significant ROS response was determined. Self-DNA was applied at the beforementioned concentrations and additionally at 0.5, 0.05 and 0.005 µg·ml-1 and H2O2 levels were quantified 15 min later (n = 5 independent biological replicates for each concentration, Figure 1B). Using a log-logistic dose-response model we determined 0.74 and 5.15 µg·ml-1 as the effective doses that cause 50% and 99% responses (ED50 and ED99) respectively (Supplementary Datasheet 1). Based on these data, we selected 5 µg·ml-1 of DNA as a standard concentration for all subsequent experiments.
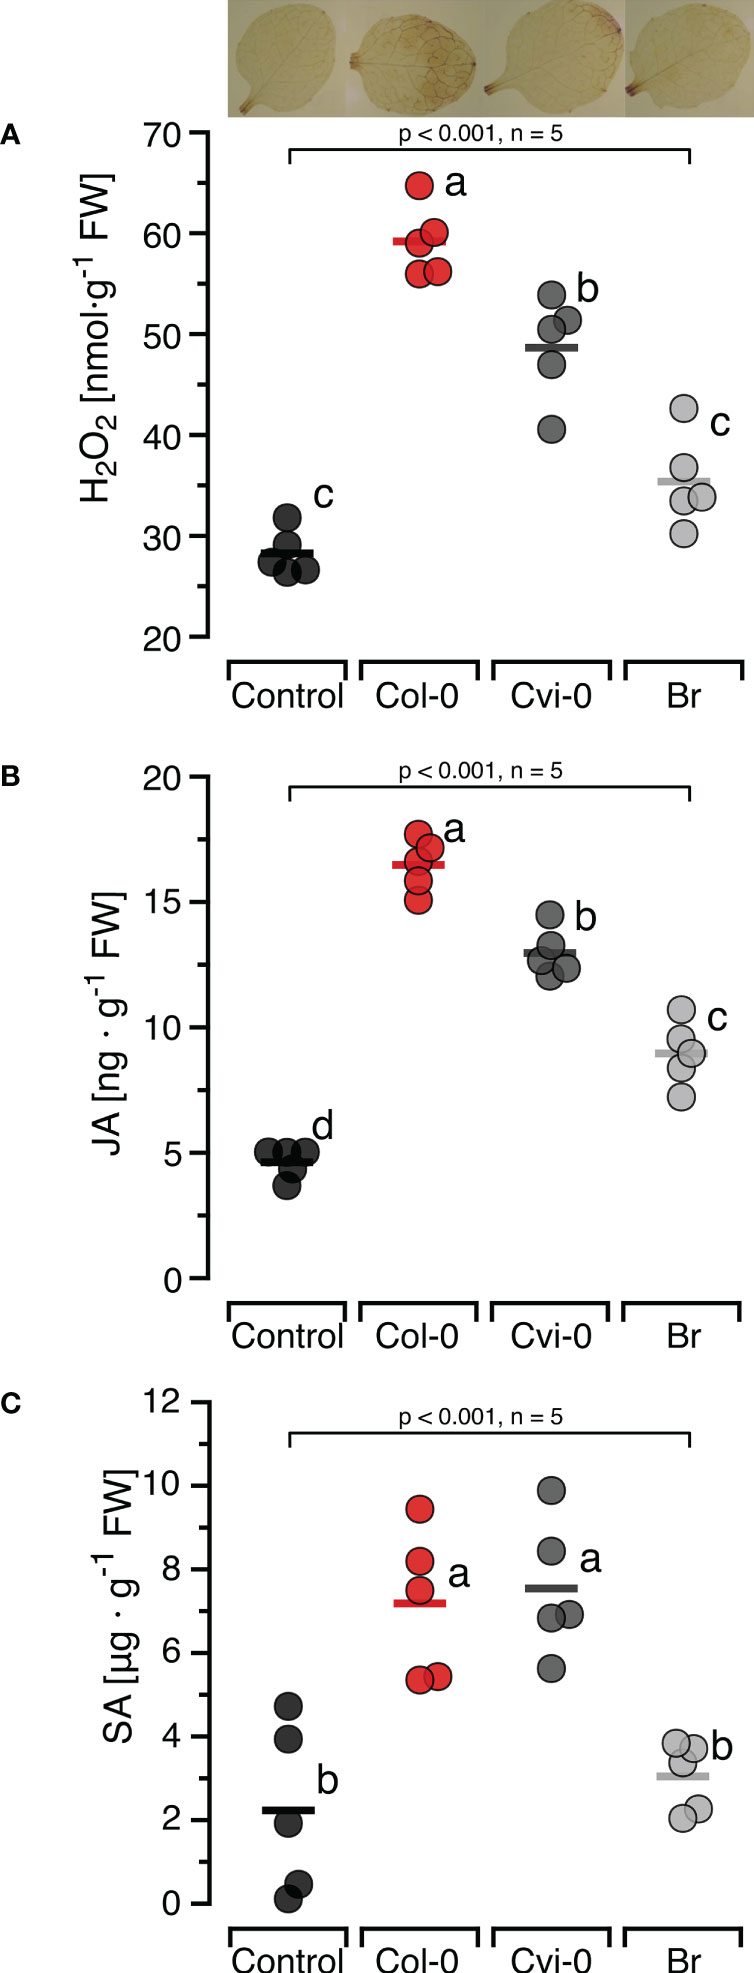
3.2 Self/nonself DNA specific induction of H2O2 and defence hormonesTo confirm the self/nonself specific effects of DNA on H2O2 formation previously reported in other models and investigate whether this specificity also applied to the induction of the two major defence hormones, we first characterised the induction of JA and SA by self-DNA over time (Supplementary Figure S3) and selected 30 min as the sampling time for JA and 24 h for SA. Subsequently, we treated Col-0 plants with self-and nonself-DNA. DNA treatment had a significant and species-specific effect on the levels of H2O2, JA and SA at the respective sampling time (Figure 2). Post hoc Tukey analysis revealed that JA was induced by DNA from all three species, although with species-specific differences, while H2O2 and SA were induced by self-DNA and by nonself-DNA from A. thaliana Cvi-0, but not by broccoli DNA (Figure 2).
Figure 2 Self-nonself-specific induction of H2O2 and defence hormones by exogenous DNA. The levels of ROS [in nmol H2O2 g-1 leaf fresh weight], jasmonic acid [in ng JA g-1 leaf fresh weight] and salicylic acid [in µg SA g-1 leaf fresh weight] were determined at 15 min (H2O2, A), 30 min (JA, B) and 24 h (SA, C) after treating Arabidopsis thaliana Col-0 plants with 5 µg·DNA ml-1 in 0.05% v v−1 Tween 20 of self-DNA (red symbols), nonself-DNA from A. thaliana ecotype Cape Verde islands (Cvi-0, dark grey symbols), or nonself-DNA from broccoli (Br, Brassica oleracea, light grey symbols). Controls (black symbols) were treated with 0.05% v v−1 Tween 20 in water. In all three panels, circles represent individual data points, horizontal lines indicate means, and different letters indicate statistically significant differences among plants treated with DNA from different origins (p < 0.05, post hoc Tukey tests). The p-values shown in the figure indicate the treatment effect on H2O2, JA and SA, according to separate one-way ANOVAs, n = 5 biologically independent replicates). See Supplementary Datasheet 1 for detailed results of statistical analyses.
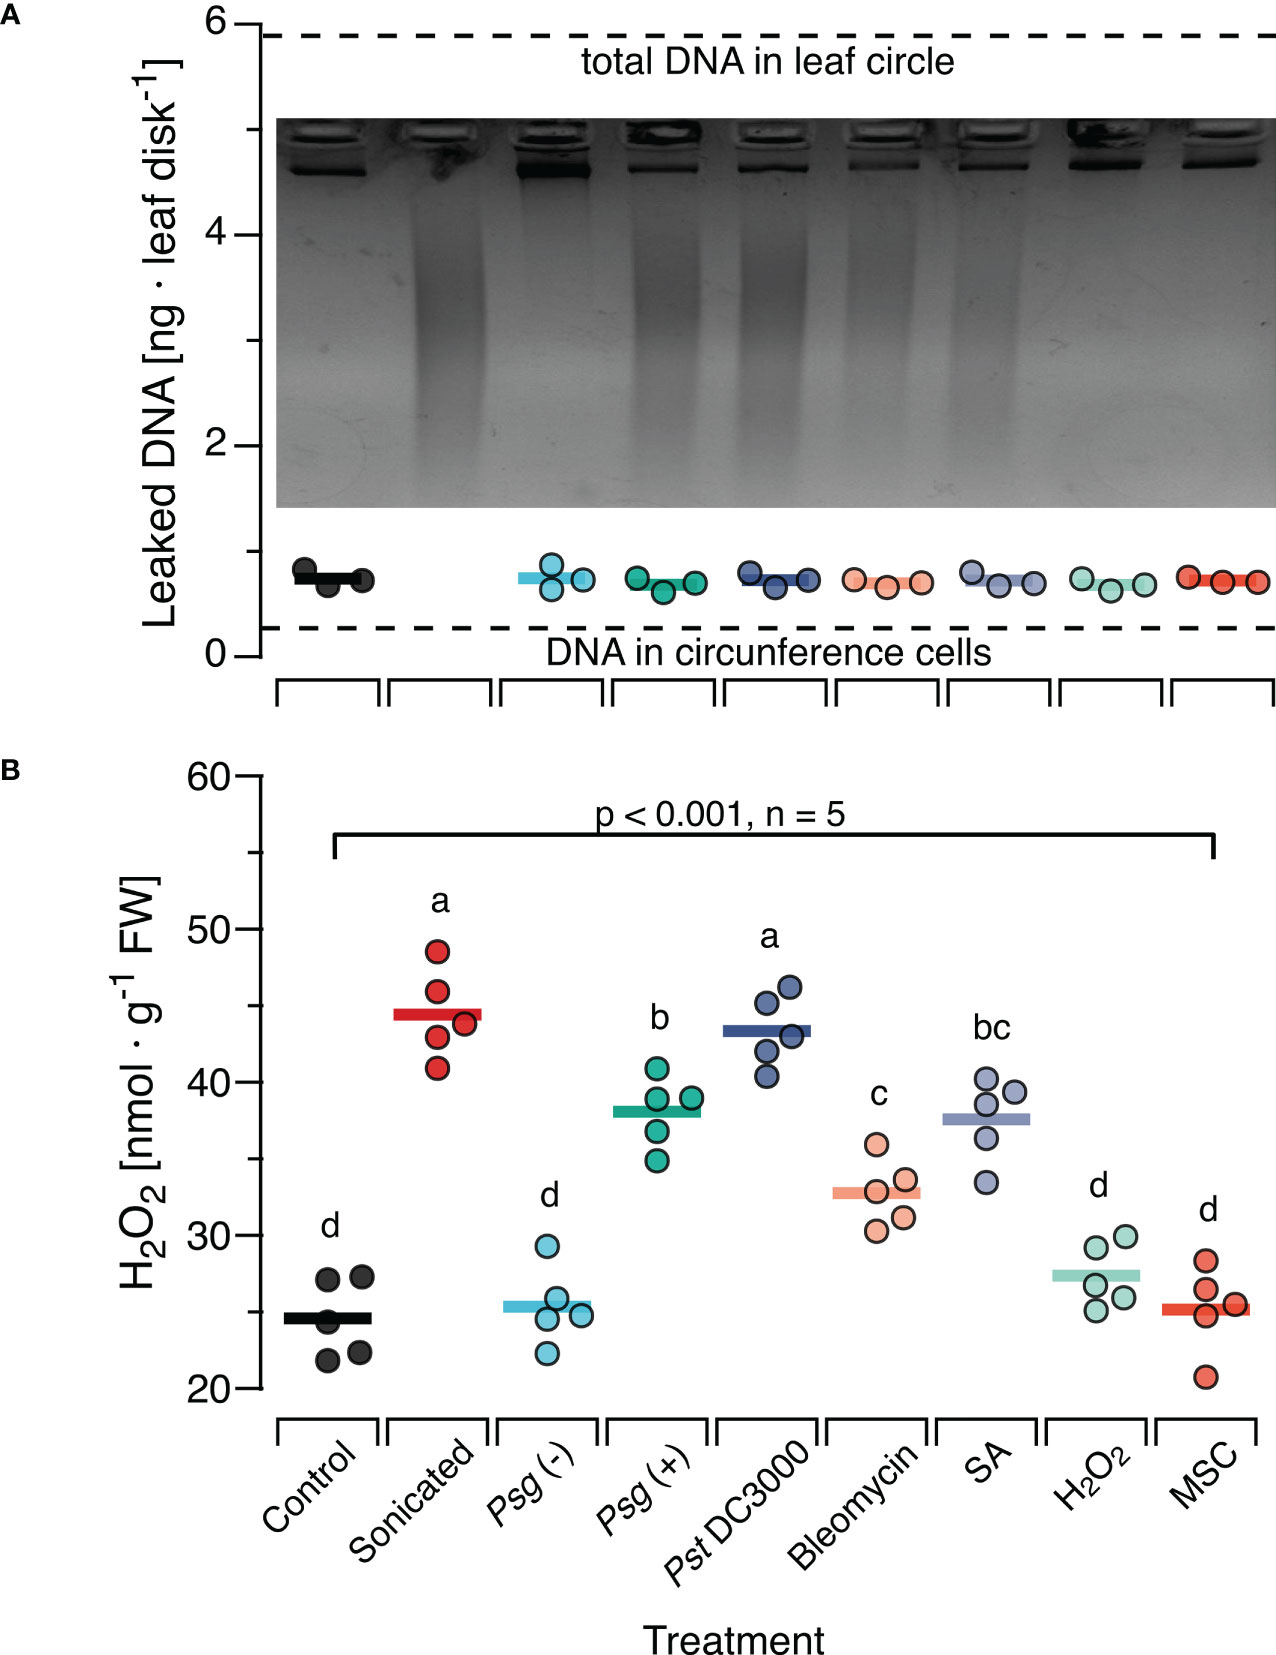
3.3 In situ damage generates ROS-inducing DNA fragmentsTo investigate whether the effects of sonicated DNA on H2O2 levels are comparable to those elicited by naturally damaged DNA, we treated Col-0 plants with each of three bacterial pathogens or with DNA-damaging agents and collected the complete (fragmented and non-fragmented) DNA from subsequently excised leaf discs. This method yielded on average 0.8 ng DNA per leaf disc, with no statistically significant differences among treatments (Figure 3A). Based on our estimation, the total amount of DNA would have been ca 5.8 ng in the entire disc and 0.03 ng in the circumference (dotted lines in Figure 3A). Gel-electrophoresis of the recovered DNA revealed a strong fragmentation of DNA in leaves that had been inoculated with either of the two virulent bacterial strains, Pst DC3000 and Psg (+) or infiltrated with Bleomycin or SA. An analysis with Image Lab (Biorad) confirmed that most of the fragments fell within a size range of < 1000 bp, in the same range as in sonicated DNA. In contrast, we retrieved significantly lower levels of fragmented DNA from leaves inoculated with the nonvirulent Psg (–) strain or infiltrated with H2O2 and from non-treated leaves subjected to the mechanical stress control (Inset in Figure 3A; Supplementary Figure S4).
Figure 3 In situ damage by virulent bacteria or DNA-damaging molecules generates fragments with ROS-inducing activity. Arabidopsis thaliana Col-0 plants were pre-treated with pathogenic bacteria or DNA-damaging molecules and the DNA retrieved from leaf discs was analysed by gel electrophoresis for fragmentation (A) and for ROS-inducing activity (B). Pre-treatments were inoculation with a suspension of 108 bacterial cells of: Psg (–), avirulent Pseudomonas syringae pv. glycinea carrying vector pVSP61; Psg (+), virulent Pseudomonas syringae pv. glycinea carrying vector pV288 with effector avrRpt2; Pst DC3000, Pseudomonas syringae pv. tomato DC3000; or infiltration with 100µl of: Bleomycin, 0.6 µg ml-1 of bleomycin; SA, 100 µM salicylic acid; H2O2, 80 mM hydrogen peroxide. Control, leaf disks from plants with no prior treatment, MSC, mechanical stress control. (A) The mean amount of DNA [ng DNA per leaf disc] retrieved from 10 discs pooled from at least three individual plants is shown as circles that represent individual data points. We detected no significant effect of the pre-treatment on the amount of retrieved DNA (p = 0.908 according to one-way ANOVA, n = 3 biologically independent replicates). Dotted lines represent the estimated quantity of DNA in the cells of the circumference and the entire leaf disc, respectively. The photo shows a 2.2% agarose gel stained with ethidium bromide that was used to visually analyse the DNA for fragmentation. (B) The levels of ROS [in nmol H2O2 g-1 leaf fresh weight] were determined 15 min after treating Col-0 plants with a solution of 5 µg·DNA ml-1 in 0.05% v v−1 Tween 20 of the retrieved DNA. No additional treatment for fragmentation was used except for the sonicated DNA that served as a positive control. In both panels, circles represent individual data points, horizontal lines indicate means, and different letters in (B) indicate statistically significant differences among treatments (p < 0.05, post hoc Tukey tests). The p-value shown in (B) indicates the treatment effect on H2O2 according to one-way ANOVA, n = 5 biologically independent replicates. See Supplementary Datasheet 1 for detailed results of statistical analyses.
In a subsequent experiment, we used this DNA to treat Col-0 plants. We sampled leaves 15 min later and observed a highly significant effect of the previous treatment on the H2O2-levels in the DNA-treated leaves (p < 0.001, One-Way ANOVA, n = 5 biologically independent replicates, see Supplementary Datasheet 1 for details). We detected a significant induction of H2O2 by DNA from Pst DC3000 infected or Psg (+) infected plants and by DNA from plants previously infiltrated with Bleomycin or SA (p < 0.05, post hoc Tukey tests, n = 5 biologically independent replicates, Figure 3B, see Supplementary Datasheet 1 for details). In fact, we found no statistically significant difference (p =0.99) between the H2O2-inducing effect of DNA from Pst DC3000- infected leaves and of sonicated DNA. In contrast, DNA from plants inoculated with the avirulent Psg avrRpt2+, infiltrated with H2O2 or from mechanically damaged leaves had no statistically significant effect on H2O2 levels (p =0.99, p = 0.71, p = 0.99, respectively).
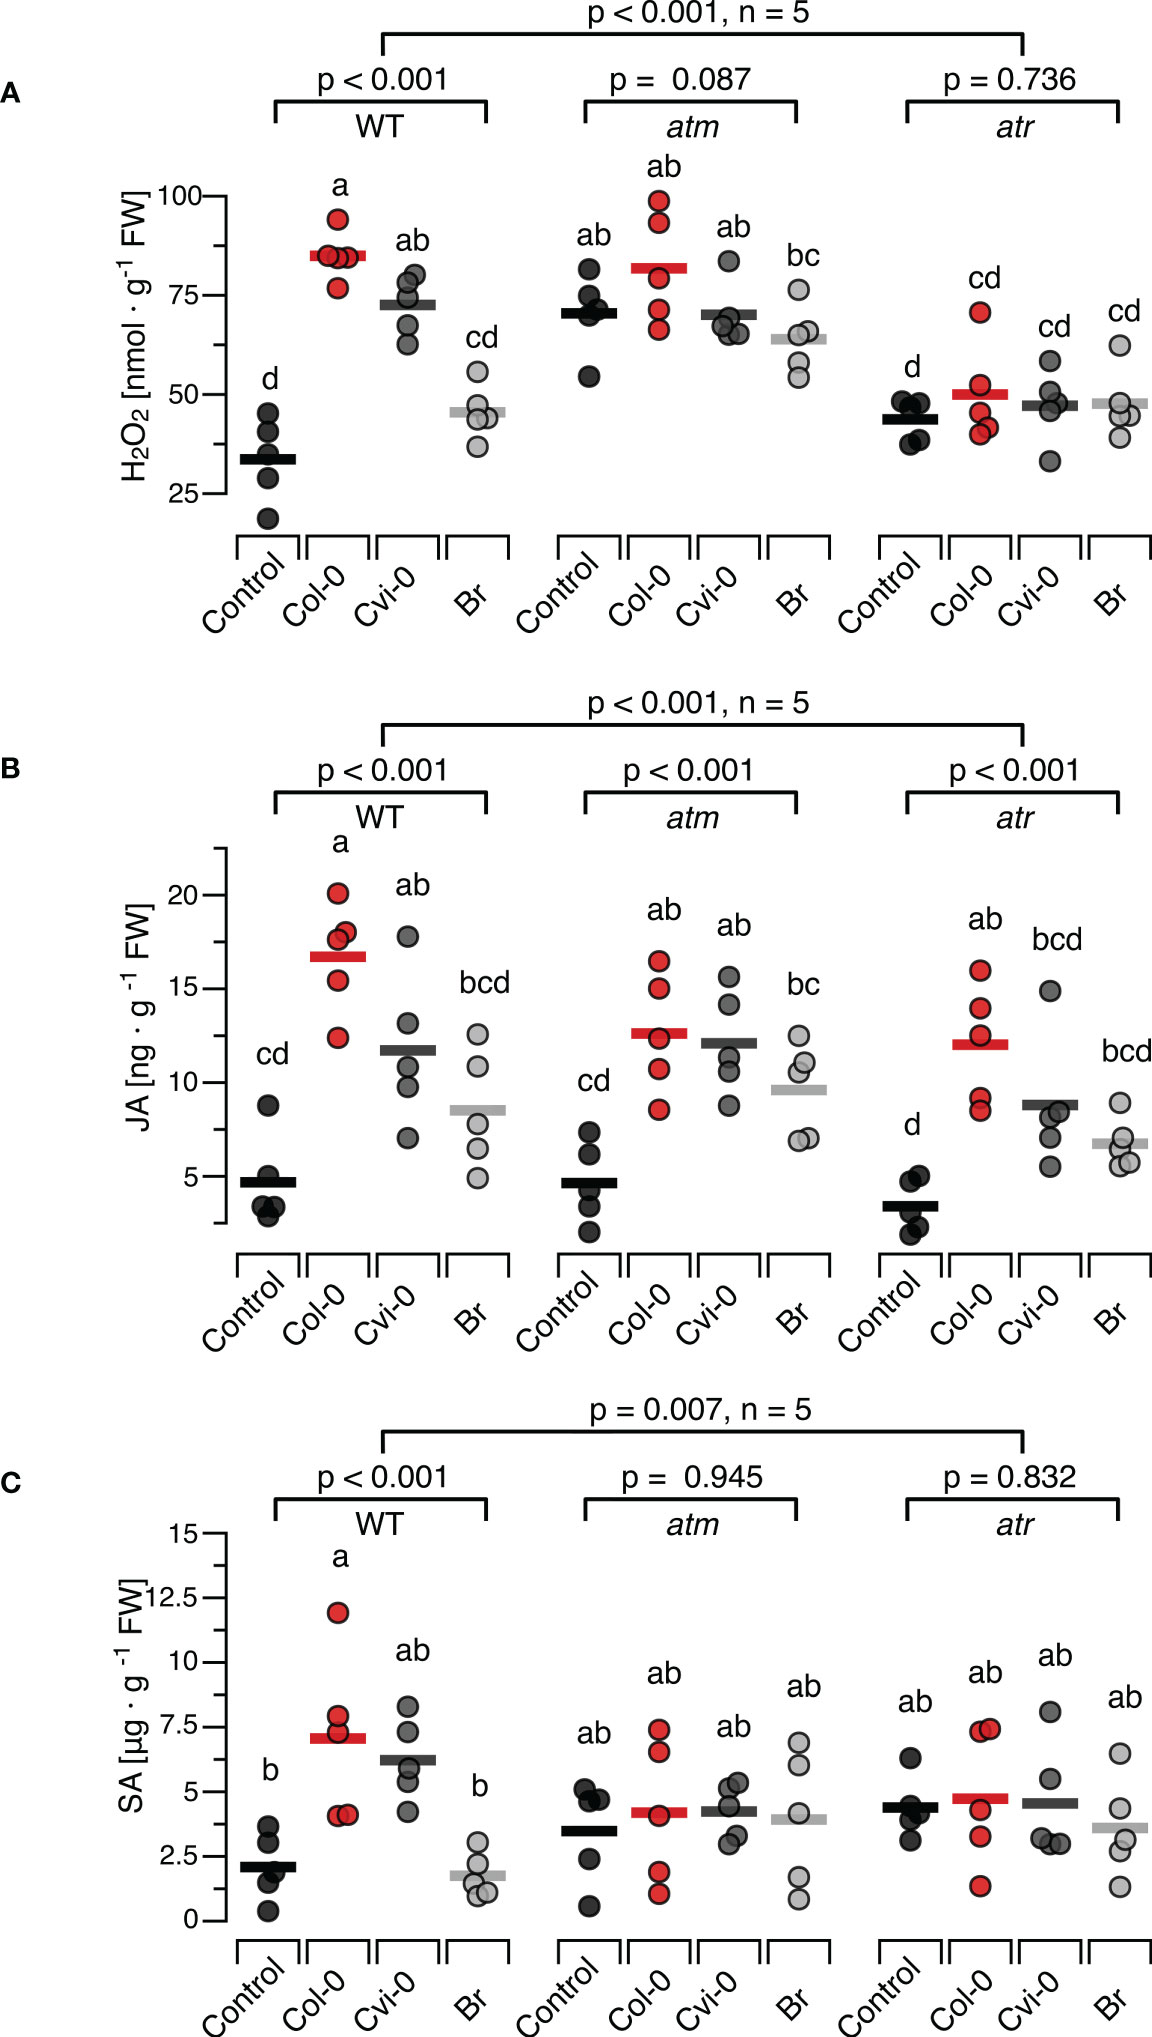
3.4 Effects of DNA on H2O2, defence hormones and resistance in the atm and atr mutant linesTo investigate whether central steps of the DNA-damage response are involved in induction of H2O2, JA or SA by exogenously applied DNA, T-DNA insertion lines atm-1 (SALK_040423C) and atr-2 (SALK_032841C) confirmed via genotyping to be homozygous (Supplementary Figure S5). We treated these plants with self and nonself-DNA from the before mentioned three sources, quantified H2O2 levels 15 min later and observed significant differences between the responses of the mutants and the wild type plants (p < 0.001 for DNA treatment, genotype and the treatment genotype interaction, Two-Way ANOVA, n = 5 biologically independent replicates, see Supplementary Datasheet 1 for details). We could detect no statistically significant effects of DNA treatment on H2O2 levels in the atm or the atr plants (p = 0.087 and 0.736, respectively, One-Way ANOVA, n = 5 biologically independent replicates, see Supplementary Datasheet 1 for details). Intriguingly however atm plants but not atr plants, were characterized by higher baseline H2O2 levels than WT plants (Figure 4A). In fact, Tukey post hoc tests revealed that the H2O2 levels in the atm plants, including untreated controls, were significantly higher than in WT control plants and not statistically different from self-DNA treated WT plants. In contrast, we could not detect any statistically significant differences when comparing the H2O2 levels in untreated WT control plants with those in atr plants in any of the treatment groups (Figure 4A; Supplementary Datasheet 1).
Figure 4 Arabidopsis DDR mutant lines atm and atr show self/nonself-specific JA induction by DNA but no induction of H2O2 and SA. The levels of ROS [in nmol H2O2 g-1 leaf fresh weight], jasmonic acid [in ng JA g-1 leaf fresh weight] and salicylic acid [in µg SA g-1 leaf fresh weight] were determined at 15 min (H2O2, A), 30 min (JA, B) and 24 h (SA, C) after treating Arabidopsis thaliana Col-0 wildtype (WT) plants or T-DNA insertion lines of Ataxia Telangiectasia Mutated (ATM) and ATM AND RAD3-RELATED (ATR) with a solution of 5 µg·DNA ml-1 in 0.05% v v−1 Tween 20 of self-DNA (red symbols), nonself-DNA from A. thaliana ecotype Cape Verde islands (Cvi-0, dark grey symbols), or nonself-DNA from broccoli (Br, Brassica oleracea, light grey symbols). Controls (black symbols) were treated with 0.05% v v−1 Tween 20 in water. Circles represent individual data points, horizontal lines indicate means, and different letters indicate statistically significant differences among plants treated with DNA from different origins (p < 0.05, post hoc Tukey tests, n = 5, see Supplementary data sheet 2 for detailed results of statistical analyses). The p-values shown in the figure indicate the treatment effect on H2O2, JA and SA, according to separate two-way ANOVAs, and according to separate one-way ANOVAS for each genotype (n = 5 biologically independent replicates in all cases, see Supplementary Datasheet 1 for details).
Whereas the ROS response to DNA in atr and atm mutants clearly differed from the response in WT, we observed a seemingly normal induction of JA by exogenously applied DNA in the mutants (Figure 4B). In fact, we observed a highly significant treatment effect on JA in the entire dataset and also when analysing each genotype with individual ANOVAs, while we detected only marginally significant differences among the mutants and the WT (Figure 4B, p = 0.012 for genotype and p = 0.453 for the interaction). By contrast, none of the mutants showed a detectable induction of SA (Figure 4C, p = 0.945 for atm and P = 0.832 for atr). In fact, even with post hoc tests comparing the SA levels in atm or atr plants of any of the treatment groups with those in untreated controls of the WT, we detected no significant differences (Figure 4C: p > 0.05 in all cases, see Supplementary Datasheet 1 for details).
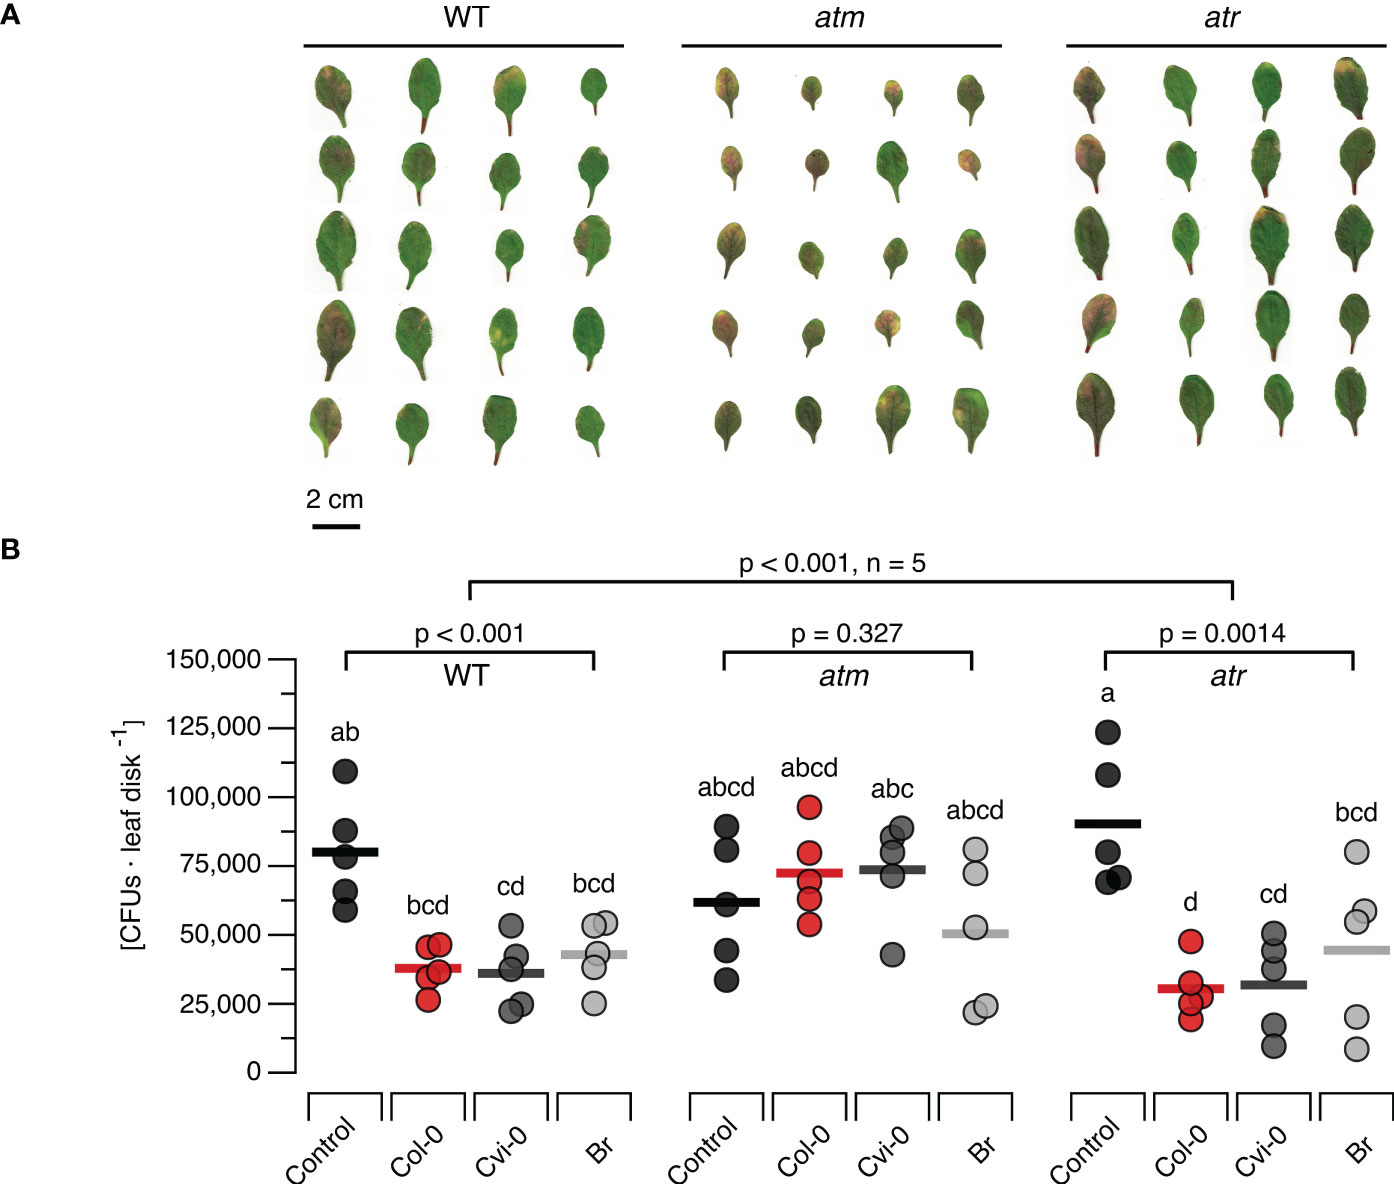
To study the effects of DNA treatment on the resistance to bacterial pathogens we treated WT, atm and atr plants with each of the three types of DNA and challenged them 48 h later with Pst DC3000. Common disease symptoms like chlorosis (yellowing due to the loss of chlorophyll) and necrosis (browning due to premature cell death) were recorded and determined visually (Figure 5A) and bacterial densities were quantified as CFUs (Figure 5B) seven days post infection. In WT plants previously treated with different sources of DNA we could observe mild severity of both chlorosis and necrosis in comparison to the control treatment. The atm and atr mutants suffered from slightly stronger symptoms (a mix of chlorosis and necrosis symptoms) than the wildtype. However, while atm mutants previously treated with DNA still showed clear disease symptoms independently of the type of DNA, DNA treatment of atr mutants strongly reduced the severity of the symptoms, similar to levels as seen in treated WT. In summary, the evaluation of disease symptoms revealed that DNA-treatment triggered a significant resistance induction that did not depend on the source of the DNA in WT and atr plants, but not in atm plants. The overall analysis of CFU numbers confirmed a highly significant treatment effect (p < 0.001) but marginally significant effects of the genotype (p = 0.021) with a significant (p = 0.002) interaction. Moreover, individual ANOVAs confirmed a significant effect for the WT and for atr, while no significant effect of DNA treatment on CFU numbers could be detected for atm (p = 0.327, Figure 5B). Intriguingly, post hoc tests did not allow to detect significant differences among WT or atr plants treated with the different types of DNA and thereby confirmed that DNA induces resistance to Pst DC300 in a self/nonself-independent way (Figure 5B).
Figure 5 Arabidopsis DDR mutant line atm but not atr is affected in the immunity to a bacterial pathogen. Disease symptoms like chlorosis (yellowing due to the loss of chlorophyll) and necrosis (browning due to premature cell death) (A) and bacterial density [in colony forming units, CFUs, per leaf disc] (B) are shown seven days after inoculating Arabidopsis thaliana Col-0 wildtype (WT) plants or T-DNA insertion lines of Ataxia Telangiectasia Mutated (ATM) and ATM AND RAD3-RELATED (ATR) with a suspension of 108 bacterial cells of Pseudomonas syringae pv. tomato DC3000. Inoculation was performed two days after treating the plants with a solution of 5 µg·DNA ml-1 in 0.05% v v−1 Tween 20 of self-DNA (red symbols), nonself-DNA from A. thaliana ecotype Cape Verde islands (Cvi-0, dark grey symbols), or nonself-DNA from broccoli (Br, Brassica oleracea, light grey symbols). Controls (black symbols in B) were treated with in 0.05% v v−1 Tween 20 in water 2 days before inoculation. Circles in (B) indicate individual data points, horizontal lines indicate means, and different letters indicate statistically significant differences among plants treated with DNA from different origins (p < 0.05, post hoc Tukey tests). The p-values in (B) indicate the treatment effect on CFU numbers according to two-way ANOVA and according to separate one-way ANOVAS for each genotype (n = 5 biologically independent replicates in all cases, see Supplementary Datasheet 1 for details).
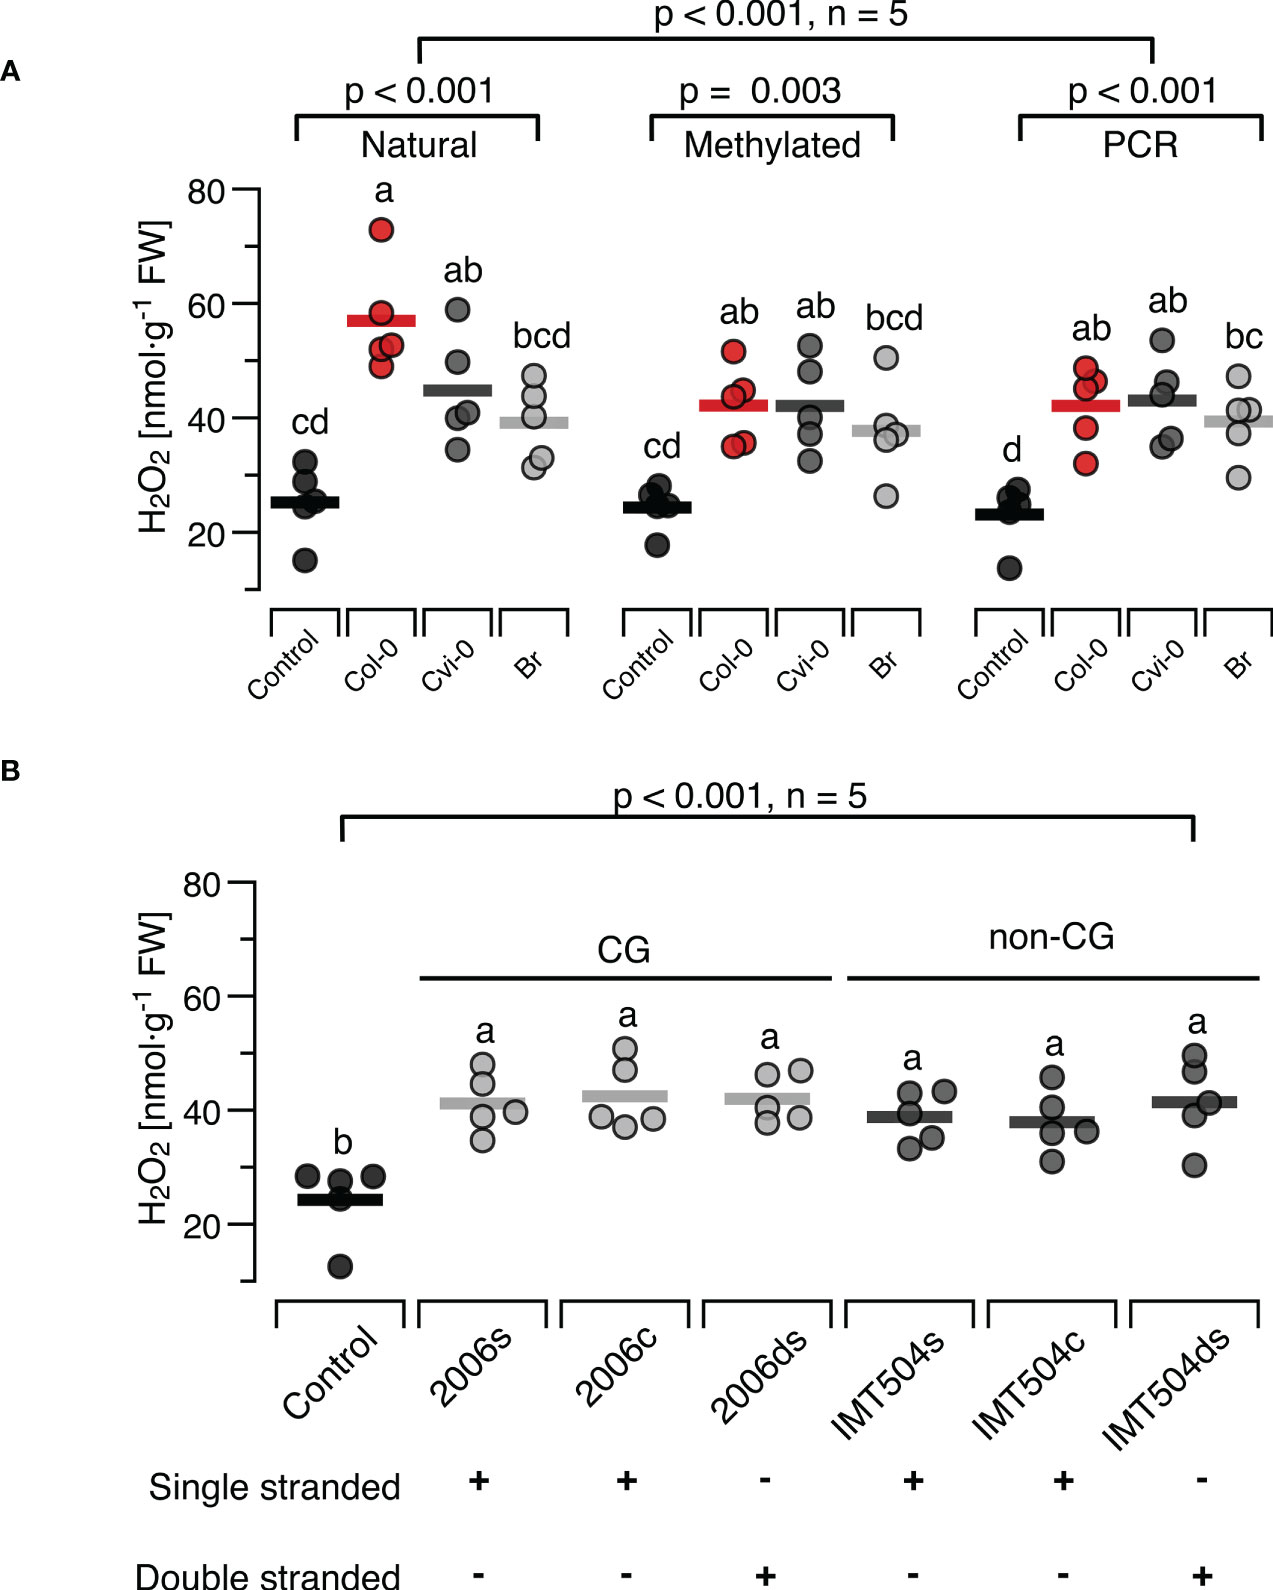
3.5 H2O2 -inducing properties are maintained in synthetic DNA and DNA with different CpG contentIn the mammalian immune system, TLR9 binds preferentially to DNA that is rich in unmethylated CpG motifs while all other dsDNA sensors known so far bind DNA in a sequence-independent way (6, 7, 64, 109). Since the few studies that tested for a role of the unmethylated CpG motif in the immune response of plants show inconclusive results, we aimed at providing further evidence, by taking two independent approaches. First, we compared the H2O2-inducing properties of DNA with completely methylated CpG motifs (generated from natural self-or nonself-DNA that was treated with M.SssI, Supplementary Figure S2) versus completely unmethylated DNA (produced by a PCR with 15-mer random primers from natural DNA of all three species as templates). In both cases, the manipulated DNA had a significant effect on H2O2 levels, but with no detectable differences between DNA produced from the three different sources (Figure 6A). In fact, the treatment effect was significant in the complete experimental design and also when analysing the effects of natural DNA, methylated DNA and PCR-generated DNA separately, but post hoc tests identified significant differences only between controls and DNA-treated plants, while we could detect no significant effects for comparisons among methylated DNAs from different sources (p > 0.99, Figure 6A, see Supplementary Datasheet 1 for details).
Figure 6 Presence and methylation of CpG motifs have minor effects on ROS-inducing properties of DNA. The level of ROS in [nmol H2O2 g-1 leaf fresh weight] was determined at 15 min after treating Arabidopsis thaliana Col-0 plants with 5 µg·ml-1 DNA with different degrees of CpG methylation (A) or with synthetic oligodeoxynucleotides (ODNs), the CpG-containing 2006 and the CpG-free IMT504 (B). In (A), self-DNA from Col-0 plants (red symbols), nonself-DNA from A. thaliana ecotype Cape Verde islands (Cvi-0, dark grey symbols) or nonself-DNA from broccoli (Br, Brassica oleracea, light grey symbols) was used in its ‘natural’ state (only sonicated), after complete cytosine methylation in the CpG motif using the methyltransferase M.SssI, or served as template for genome amplification using 15-mer random primers. In (B) the CpG-containing ODN 2006 (5’- TCGTCGTTTTGTCGTTTTGT-3’) and the CpG-free ODN IMT504 (5’-CATCATTTTGTCATTTTGTCATT-3’) as well as their complementary sequence (2006c and IMT504c) were applied either as single-stranded (ss)ODNs or as annealed double stranded (ds)ODNs. Different letters indicate statistically significant differences (p < 0.05, post hoc Tukey tests, n = 5 biologically independent replicates in all cases). The p-values in (A) indicate the treatment effect on according to two-way ANOVA and according to separate one-way ANOVAS for DNA of each methylation status, and in (B) the treatment effect according to one-way ANOVA (n = 5 biologically independent replicates in all cases, see Supplementary Datasheet 1 for details).
In the second approach we used the CpG- containing ODN 2006 and the CpG-free ODN IMT504 and observed a significant effect on H2O2 levels (Figure 6B). However, the H2O2-inducing effect was independent of whether we applied the ODNs or their complementary sequence (IMT504c and 2006c) either as single-stranded (ss)ODNs or as annealed double stranded (ds)ODNs. In fact, post hoc tests identified only the differences between the control condition and the treated plants to be significant, but they did not show any significant differences between the different treatments (p > 0.85 for all pairwise comparisons, Figure 6B).
4 Discussion4.1 Plant DNA triggers self/nonself-specific activation of immune signalling in ArabidopsisThe accumulation of fragmented DNA in the cytoplasm or the extracellular space is a signal of danger. Mammals and plants respond to this danger with an activation of innate immunity. Our present study confirms earlier reports that plants exhibit a self/nonself-specific response to DNA from related species at a particularly fine taxonomic resolution: A. thaliana plants of ecotype Col-0 responded to treatments with self-DNA from other Col-0 plants with significantly stronger increases in the levels of H2O2 and JA than after treatments with nonself-DNA from another ecotype of the same species (Figure 2). In general terms, an immune response to ‘self’ contradicts the classical immunological paradigm as expressed in the title of Charles Janeway’s seminal publication “The immune system evolved to discriminate infectious nonself from noninfectious self” (110) but rather, provides strong empirical support for Polly Matzinger’s statement “The immune system is more concerned with entities that do damage than with those that are foreign” (111). Both perspectives provided the framework for important immunological breakthroughs, from the discovery of PRRs guided by the Janeway paradigm to providing the explanation of pro-inflammatory self-molecules as DAMPs, which were predicted by Matzinger and discovered empirically by Walter Land in 1994 (112, 113) and since then are increasingly being identified as drivers of important beneficial as well as detrimental functions of the immune system (44, 114, 115).
Our knowledge on the mechanisms that control DAMPs-triggered plant immunity is still very limited and few receptors have been identified so far (41, 116–118). Considering the opportunities provided by the mutants and multiple other genetic and molecular tools existing for Arabidopsis thaliana for future research into response to DNA we characterised the dose-response relations and the time course the ROS-response to self-DNA, and identified 5µg DNA ml-1 as a concentration that in 99% of cases should induce a significant H2O2 accumulation that reaches peak – and likely maximum – levels at 15 min (Figure 1). The levels of JA peaked at 30 min and those of SA at 24 h (Figure 2; Supplementary Figure S3). Subsequent treatments revealed self/nonself-specific effects of DNA on H2O2 and both hormones and in all cases, strongest effects were triggered by self-DNA (Figure 2), similar to earlier observations, although with minor differences between species (20–22, 26, 35, 36). The response times and levels reached by the three signals fall clearly within the standard kinetics of the three signals (119–121).
4.2 Infection and DNA-damaging agents generate ROS-inducing DNA fragmentsIn spite of numerous reports that associate infection or herbivore feeding with damage to the host’s DNA, it remains unknown whether the release of self-DNA fragments is a common outcome of an attack by herbivores or pathogens. Moreover, doubts remained as to which degree the exogenous application of sonicated plant DNA causes effects that are comparable to those when DNA is damaged in situ in more realistic scenarios. Therefore, we aimed to compare the ROS-inducing properties in situ-damaged DNA to the effects of sonicated DNA.
To this end, we challenged Col-0 plants with various pathogenic bacteria or treated them with H2O2, SA or bleomycin (a radiomimetic drug that triggers DSBs (94, 122, 123)). Aiming to collect only DNA that had leaked into the apoplast we followed a method developed to study extracellular NAD+ a SAR-triggering DAMP (96). The results revealed the presence of massive amounts of DNA fragments in a size range between ca 100 bp and 1000 bp obtained from leaves previously infected with Pst DC3000 or Psg (+) or treated with Bleomycin or SA. In contrast, infection with Psg (–) and treatment with H2O2 did not cause major fragmentation of plant DNA, at least in terms of generating visible amounts of fragments in our assay. For the bacteria, this pattern confirms earlier reports that characterised the first two strains as virulent bacteria that inflict intensive damage to their host´s genomic DNA, whereas Psg (–) exhibits a very low level of virulence although it can reproduce in Arabidopsis (92, 93, 124, 125). Similarly, our results confirm for bleomycin and SA, but not H2O2, that the in situ effects of widely used DNA-damaging agents comprise the generation of fragments within the same size range as sonication. At the first glance, the lack of massive DNA fragmentation upon H2O2, treatment seems counterintuitive. While the role of SA as a DNA-damaging agent that had been proposed by the group of Xinnian Dong (59) has later been questioned by a study that reported damage-induced SA to be involved in subsequent repair (93), the role of oxidative stress as a DNA-damaging factor can be considered as generally accepted (126–128). However, studies using a wide variety of experimental models from the plant and animal kingdom identify SA and H2O2 as ‘double-edged swords’ that act as DNA damaging agents but also serve as signals to induce adequate countermeasures (129–132). Considering that most of the involved processes are dosage-dependent, follow different kinetics and are likely to interact via diverse direct and indirect mechanisms, it should not come as a surprise that the net outcome quantified at any single time point yields seemingly contrasting results.
Originally, the motivation for this experiment was to demonstrate the leakage of DNA fragments from intact cells into the apoplast. We reasoned that our method would allow the recovery of leaked DNA from most cells in the leaf disc, whereas in a scenario in which DNA release requires mechanical disruption of cells, only DNA from cells in the circumference would be retrieved. To this end, we estimated the total amount of DNA in the leaf disc versus the circumference. Comparison of the average amount of DNA retrieved from each leaf disc to these hypothetical values indicates that the retrieved DNA had most likely had been released only from the cells in the circumference that were mechanically damaged when cutting out the leaf discs. Thus, further work will be required to provide una
留言 (0)