
記住我

Our previous lipidomic profiling studies have identified other prognostic ceramides that could enhance the performance of the 3LS [5, 7]. Variations in LC-MS platforms and methodology can influence lipid quantitation, where a biomarker model may perform differently under an alternative platform or methodology. Therefore, in addition to the lipids of the 3LS, we included other ceramides as candidates and developed a targeted LC-MS assay to measure them simultaneously—Cer(d18:1/18:0), Cer(d18:1/22:0), Cer(d18:1/24:0), Cer(d18:1/24:1), Cer(d20:1/24:0), Cer(d20:1/24:1) and PC(16:0/16:0)(S2). SM(d18:2/16:0) was not available for purchase either as a standard (for method development and calibration curves) or as a stable isotope internal standard. We trialled an alternate isoform (SM(d18:1/16:0)) but encountered over-saturation of the LC-MS and problems with reliability during assay development (data not shown). SM(d18:1/16:0) was removed from subsequent analysis. Ceramides are closely associated with risk factors of atherosclerosis such as cholesterol and triglycerides, and these factors may influence assay performance [16]. Thus total cholesterol, HDL and triglycerides were also selected as candidates, and their plasma levels were measured separately by established clinical assays.
The LC-MS assay was developed according to NPAAC guidelines (S2), with linearity for all candidate lipids (mean coefficients of determination 0.973–0.998 (Table S2.4.1)). Inter-assay and intra-assay variability was low, with percentage coefficient of variation <10% for all lipids except Cer(d20:1/24:0) and Cer(d20:1/24:1)(<13%), reflecting their low endogenous concentration (S2.6).
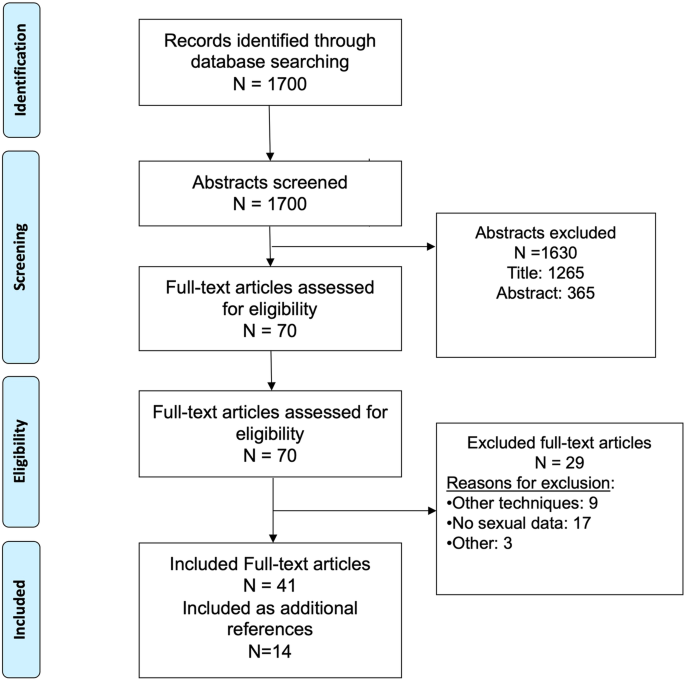
Study cohortsThe characteristics of the Discovery (105 men) and Validation (183 men) cohorts are summarised in Fig. 1, Table S2.2.1. Plasma from the Discovery cohort were obtained at baseline of taxane treatment, which was first line treatment for almost all participants. In contrast, plasma from the Validation cohort were obtained at baseline of ARSI for 70% of the men and 71% of them were first line.
Fig. 1: Patient cohorts and analysis strategy.
mCRPC metastatic castration-resistant prostate cancer, LC-MS Liquid Chromatography-Mass Spectrometry, LASSO least absolute shrinkage and selection operator.
Comparison between targeted and high-throughput assaysNone of the lipids display collinearity with each other, except for Cer(d18:1/24:0) and Cer(d18:1/22:0) with Pearson’s R = 0.76 (S5), thus both lipids were never together in the same model during model development.
When the Discovery cohort plasma samples were analysed on the targeted assay, three lipids were associated with OS (p < 0.05): Cer(d18:1/24:0), Cer(d18:1/24:1) and Cer(d20:1/24:1). Similar associations were observed when the plasma were analysed on the high-throughput assay, where Cer(d18:1/24:0), Cer(d18:1/24:1), total cholesterol and triglycerides were associated with OS (p < 0.05) (Table 1).
Table 1 Univariable Cox regression of log2 transformed lipid species concentrations as measured on the targeted and high-throughput assays, in the Discovery and Validation cohorts.Within the Validation cohort, five lipids were associated with OS (p < 0.05): Cer(d18:1/18:0), Cer(d18:1/24:0), Cer(d20:1/24:1), total cholesterol and HDL. Similar associations were observed when measured on the high-throughput assay, where Cer(d18:1/18:0), Cer(d18:1/24:1), Cer(d20:1/24:1) and total cholesterol were associated with OS (Table 1).
Model development (Discovery cohort)Twelve models consisting of different combinations of candidate lipids were derived (Table 2, S6). Ceramide ratios were included to account for noise reduction and LC-MS variance. Furthermore, ceramide ratios were reported as robust indicators of cardiovascular risk and are less dependent on clinical characteristics [17]. Models 5 and 6 had the highest C-statistic (0.660) and were selected for further evaluation. The optimal cut-points of the risk scores that defines if a person has good or poor prognosis for models 5 and 6 were −1.1903 and −0.817 respectively (S7).
Table 2 Details of each of the prognostic models investigated.Patients classified as poor prognosis by either model had significantly shorter OS than patients classified as good prognosis (model 5: median OS 12.0 months vs. 24.2 months, HR 3.75 [95% confidence interval (CI) 2.29–6.15], p < 0.001; model 6: median OS 12.2 months vs. 26.4 months, HR 3.62 [2.21–5.94], p < 0.001). The HR of Model 5 was higher than Model 6, therefore, Model 5 was chosen as the optimal model and designated as “PCPro”. The Cox proportional hazards assumptions for PCPro were verified by residuals analysis (S8).
PCPro performance within the Validation CohortPCPro classified 50 of 183 men (27%) as poor prognostic (PCPro-positive) in the Validation cohort. Median OS of the PCPro-positive group was significantly shorter than the PCPro-negative group (13.0 vs 25.7 months, HR = 2.13 [95% CI 1.46–3.12], p < 0.001) (Fig. 2).
Fig. 2: Kaplan-Meier survival analysis of overall survival by PCPro in the Discovery and Validation cohorts.
A Survival in the Discovery cohort, B Survival in the Validation cohort, C Survival in those treated with ARSI in the Validation cohort, D Survival in those treated with taxane chemotherapy in the Validation cohort, E Survival in those treated with first line treatment in the Validation cohort, and F Survival in those treated with second line treatment in the Validation cohort. ARSI androgen receptor signalling inhibitor, HR hazard ratio, mo months, OS overall survival.
Sub-group analysis by therapy showed that for those treated with an ARSI, median OS was significantly shorter for PCPro-positive men compared to PCPro-negative men (12.3 vs 31.5 months, HR = 2.36 [95% CI 1.47–3.80], p < 0.001). Although OS was shorter amongst those treated with taxanes who were PCPro positive compared to PCPro negative, it was not statistically significant (median OS 16.6 vs 20.3 months, HR = 1.67 [95% CI 0.88–3.18], p = 0.12).
Sub-group analysis by treatment line showed that for men on first or second-line therapy, those who were PCPro-positive had shorter OS than men who were PCPro-negative (first-line: median OS 19.0 vs 27.2 months, HR = 1.89 [95% CI 1.18–3.02], p = 0.008; second-line: median OS 9.7 vs 21.8 months, HR = 2.60 [95% CI 1.33–5.07], p = 0.005).
Analyses of progression-free survival (PFS) by cohort, therapy or treatment line showed that men who were PCPro-positive had shorter PSA-PFS or radiographic-PFS compared to men who were PCPro-negative (p < 0.05, S9).
Comparison of model to 3LS and clinicopathological factorsA high percentage of PCPro-positive patients have the 3LS (Discovery cohort: 68%; Validation cohort: 70%). The ROC AUC of the ability of PCPro to predict 3LS was 0.869 for the Discovery cohort and 0.751 for the Validation cohort (S10).
When PCPro was modelled with clinicopathological factors in multivariable Cox regression, PCPro was an independent predictor of OS (p < 0.05) in both the Discovery and Validation cohorts. Alkaline phosphatase was an additional independent predictor in the Discovery cohort and haemoglobin and albumin were additional independent predictors in the Validation cohort (S11). In bivariable Cox regression analysis, PCPro was an independent predictor of OS whereas diabetes status was not. PCPro was not associated with the presence of diabetes (S11.3). Other cardiovascular risk factors including age, weight, BMI and statin-use were not associated with OS (S11).
留言 (0)