
記住我


Improvements in health care information technology have led to an increase in virtual care, which may encompass a range of phone, video, chat, and email.1,2 Virtual care is convenient for both the patient and health care provider, and is clinically effective across a range of health modalities.3,4 Virtual encounters can maintain continuity of care when in-person encounters are not feasible, result in similar patient satisfaction compared with in-person encounters, can be cost-effective, reduce administrative burden, and improve patient-provider communication.5–9 Specifically, in primary care virtual care’s acceptance is growing among patients and health care providers especially for commonly diagnosed and uncomplicated infections.10–13
Urinary tract infections (UTIs) are one of the most common bacterial infections that result in >10 million outpatient encounters each year14 with >50% of women experiencing a UTI in their lifetime.15,16 Often, UTIs can be diagnosed based on patient history, patient-reported symptoms, and generally without the need of a urine culture.17,18 In addition, patients prone to UTIs can usually safely identify UTI symptoms and initiate treatment themselves.19,20 Based on the common occurrence and uncomplicated nature of diagnosing most UTIs, remote monitoring and treatment of UTIs may be appropriate and acceptable for most patients.21–23
While the acceptability to use virtual care was increasing before the onset of COVID-19, the COVID-19 pandemic and the Centers for Disease Control and Prevention’s (CDC) encouragement to use virtual care services to deliver care24 significantly increased virtual care utilization.10,25 While reports show virtual encounters increased, and at times were higher than in-person encounters from 2020 to 2021, the impact of virtual encounters on ancillary services orders and order fulfillments, such as orders for medications or laboratory tests, are still poorly understood. Given the acceptability of using virtual care for diagnosing and treating of UTIs,22,23,26 our study aimed to evaluate and compare the rate of ancillary service orders and order fulfillments in incident UTI diagnoses between virtual and in-person encounters.
METHODS SettingOur multisite study involved 3 integrated health care systems: Kaiser Permanente (KP) Colorado (KPCO), KP Georgia (KPGA), and KP Mid-Atlantic States (KPMAS). Each of these KP regions is nonhospital based (is not affiliated with a KP-owned hospital) and follows KP’s integrated health care model. As of early 2020, KPCO served >575,000 (86% White race, 4% Black or African-American race, and 16% Hispanic ethnicity) in the Boulder and Denver Colorado area, KPGA served >300,000 members (43% White race, 50% Black or African-American race, and 5% Hispanic ethnicity) in the Atlanta-metropolitan area; and KPMAS served >750,000 members (36% White race, 39% Black or African-American race, and 15% Hispanic ethnicity) in the Baltimore-Washington DC, tri-state area.
Before 2019 and the COVID-19 pandemic, all 3 KP sites were utilizing virtual care. KPCO implemented scheduled telephone encounters and synchronous chat, and KPGA and KPMAS both implemented scheduled telephone and video encounters. In March 2020 at the onset of the COVID-19 pandemic, the CDC encouraged all health care systems to utilize virtual care for health care encounters and 8 KP regions, including KPCO, KPGA, and KPMAS transitioned to a “Virtual First” ambulatory care model.24 The transition of “Virtual First” and the need to enhance KP’s virtual platform was a national and regionally led effort that provided all regions the ability and resources to increase telehealth availability to their members.
Study Design and Data SourcesThe retrospective cohort study was conducted using data across KPCO, KPGA, and KPMAS from January 2019 to June 2021. To account for the pandemic-induced rapid shift in virtual care and KP’s “Virtual First” approach, we categorized the January 2019–June 2021 period in to 3 eras: Prepandemic (January 2019–March 2020), COVID-19 Era 1 (April 2020–June 2020), and COVID-19 Era 2 (July 2020–June 2021). These eras were chosen as whole months to best represent the availability and level of access to care and services during the COVID-19 pandemic. Prepandemic time period reflects the level of access KP members had before to any COVID-19 considerations were necessary. COVID-19 Era 1 represents the first 3 months that many health care clinics and businesses had significantly limited in-person interactions, and broad “stay at home” mandates were implemented in each of the 3 regions. COVID-19 Era 2 represents the time period when clinics and businesses were beginning to re-open. Data sources included the electronic health records and the Virtual Data Warehouse for each site.27,28 We included all adult primary care (APC) encounters that were completed with a medical doctor. Nurse only visits were excluded from analyses. APC encounters that were procedure-only, or had a nonvirtual modality comparison (such as a blood pressure follow-up assessment or wellness visit) were excluded from the retrospective cohort. We developed a common data model to identify APC encounters with a primary qualifying International Classification of Diseases, 10th Revision (ICD-10) diagnosis for UTI, and the UTI-specific ancillary services, separately, at all 3 sites. We excluded any UTI-based encounter if that member completed an encounter for the same condition within 30 days prior. The study was reviewed and approved by the Institutional Review Board (IRB) at KPGA, the IRB of record for the project.
VariablesOur primary outcomes were ancillary service orders and order fulfillments. UTI-specific ancillary services included any UTI-antibiotic, UTI-second-line antibiotic, urine culture, urine analysis, or computed tomography/magnetic resonance imaging (CT/MRI). An order for an ancillary service was identified if it was placed within 5 days of the incident UTI encounter. Ancillary service order fulfillment was affirmed if the order was completed by the patient within 30 days. Orders and order fulfillments were dichotomized (yes/no) for analyses.
The primary exposure variable was encounter modality, dichotomized as either virtual or in-person encounter. Scheduled telephone encounters, scheduled video encounters, and synchronous chat were classified as a virtual encounter for KPCO and KPGA, and scheduled telephone encounters and scheduled video encounters were classified as a virtual encounter for KPMAS. All other APC encounters included in the cohort were classified as in-person encounters.
Patient-level covariates included were age at the time of encounter, sex, race and Hispanic ethnicity, Charlson Comorbidity Index,29,30 encounter year, encounter quarter, Area Deprivation Index,31 distance to primary care clinic, health insurance, high-deductible plan (yes/no), and prior use of mail-order prescriptions. Race/ethnicity was categorized across the more populated groups across the KP sites and was defined as Hispanic (yes/no) or Non-Hispanic Black, Non-Hispanic Asian, Non-Hispanic White, Non-Hispanic Other known, and Unknown. The Charlson Comorbidity Index was categorized as no comorbidities, 1 comorbidity, or ≥2 comorbidities with no comorbidities serving as the reference group.
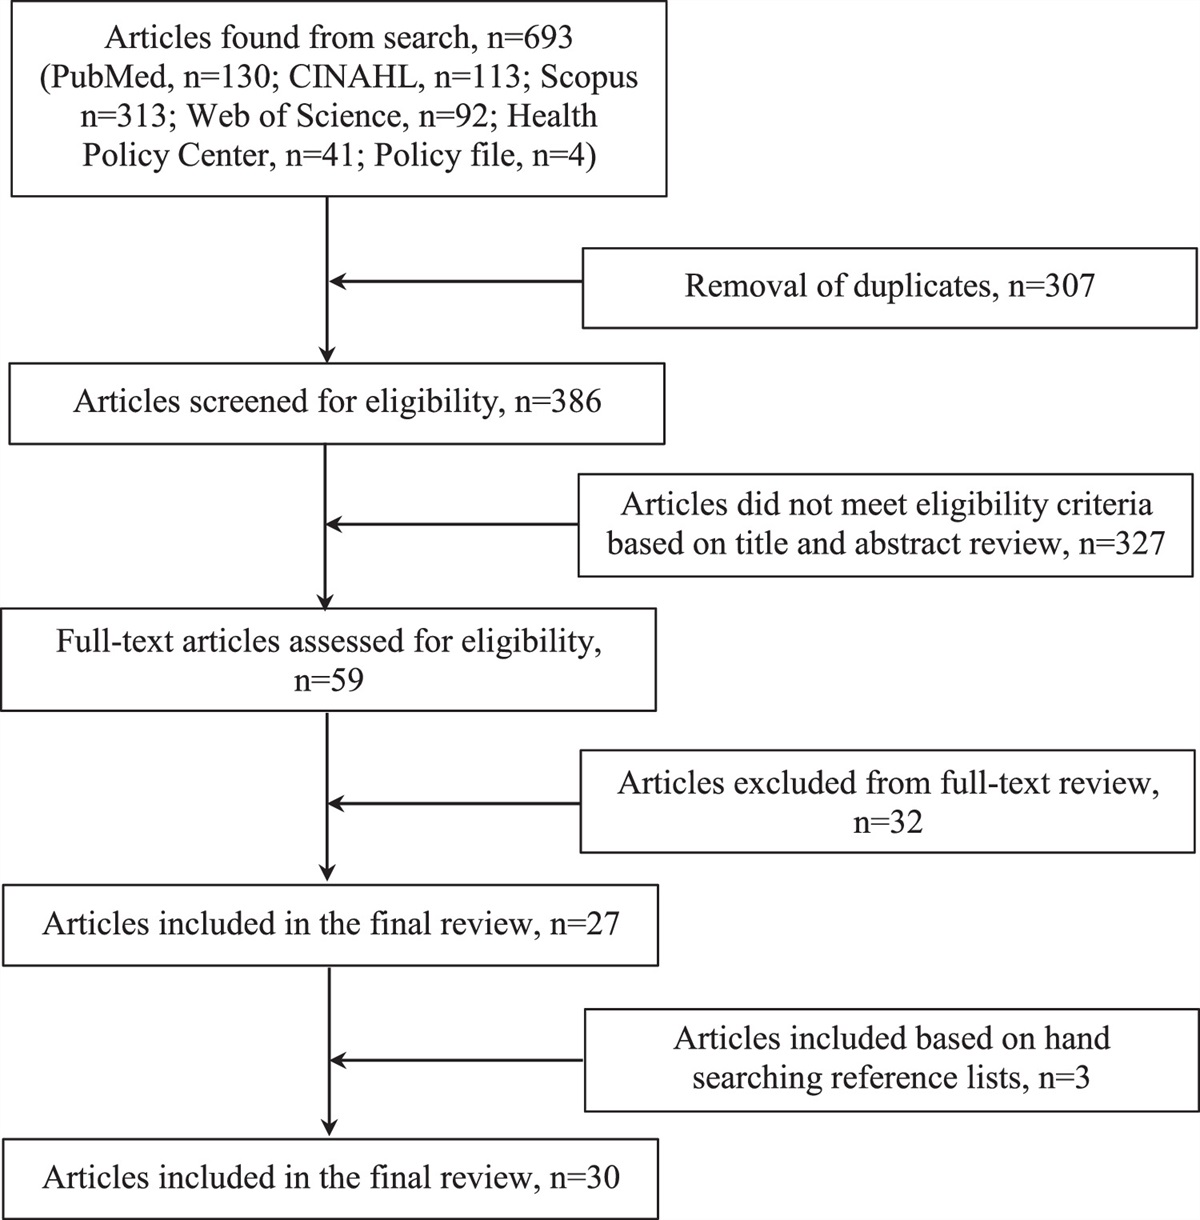
Statistical AnalysesAnalyses were conducted for each KP site separately. Figure 1 reports the flow diagram for the final APC UTI cohort for each KP site. Descriptive statistics report the APC UTI encounters by encounter modality. χ2 comparison test compared the frequency of virtual versus in-person encounters for each of the patient covariates within the KP sites. Analyses were focused on comparing virtual versus in-person encounters for ancillary service orders and order fulfillments. Inverse probability treatment weighting (IPTW) was used to weight the virtual and in-person encounters, creating estimates balanced across the 2 groups on each of the patient covariates.32–34 Logistic regression with stabilized average treatment effect without truncation was used to calculate the IPTW. Outcomes were compared between UTI encounters completed virtually and in-person and were weighted by the IPTW to reduce possible confounding due to differences in covariate distributions. Results are presented as weighted percentages of ancillary service orders and order fulfillments for both virtual and in-person encounters. Separate weights were constructed for each outcome. SAS Enterprise Guide, v8.2 was used to conduct all statistical analyses with statistical significance assessed at α=0.05.
 FIGURE 1:
 Flow diagram of for each of the three integrated healthcare systems reporting the selection of adult primary care (APC) encounters with an incident urinary tract infection (UTI) diagnosis code. The flow diagrams show the participating healthcare systems: Kaiser Permanente Colorado (A), Kaiser Permanente Georgia (B), and Kaiser Permanente Mid-Atlantic States (C).
RESULTSOur study and common data model identified 169,513 APC encounters with an ICD-10 UTI diagnosis code (KPCO=42,502; KPGA=40,803; KPMAS=86,181), with 73.1% (n=123,907) being incident UTI encounters (Fig. 1). Within KPCO, we identified 18,705 UTI incident encounters occurring in the prepandemic (January 2019–March 2020) era with 27.6% (n=5156) encounters being virtual, 3158 UTI encounters (72.8% virtual) during COVID-19 Era 1 (April 2020–June 2020), and 12,785 UTI encounters during COVID-19 Era 2 (July 2020–June 2021) with 40.7% (n=5205) completed virtually. KPGA had similar proportions of UTI encounters and virtual encounters completed, as KPCO, across eras. KPMAS had 4202 and 20,277 encounters during COVID-19 Era 1 and Era 2, respectively, with 67.7% and 34.1% being virtual encounters. Across all the KP sites, there were a total of 45,172 UTI incident encounters during the COVID-19 Era 2 (July 2020–June 2021), 39.1% were virtual encounters, an increase from 13.4% during the prepandemic era.
To provide an understanding of the population demographics each site was serving before the COVID-19 pandemic, Table 1 reports the patient characteristics across the 3 KP sites for patients completing a UTI encounter between January 2019 and March 2020 (prepandemic era). In KPCO, a higher percentage of members completing virtual encounters were members age 65 years and older (29%), females (93.6%) and patients within the lowest area deprivation quartile (62.8%). In KPGA members self-reporting as Black (43.2%) or White (43.4%) comprised the majority of virtual encounters for a UTI diagnosis. Males (22.3%) and members with a Charlson Comorbidity Index of 1 (16%) were less likely to complete a virtual encounter compared with individuals with a Charlson Comorbidity Index of 0.
TABLE 1 - Patient Characteristics of Patients Diagnosed With Incident Urinary Tract Infections (UTIs) Before COVID-19 Onset, January 2019–March 2020, Stratified Across Kaiser Permanente (KP) Sites KP Colorado KP Georgia KP Mid-Atlantic States Encounter mode Encounter mode Encounter mode Patient/encounter characteristics at time of encounter Virtual mode In-person mode P Virtual mode In-person mode P Virtual mode In-person mode P No. incident UTI encounters 5156 13,549 2126 16,246 1928 29,649 Age group (y) 19–34 1207 (23.4) 2066 (15.2) <0.0001 482 (22.7) 3410 (21) <0.0001 256 (13.3) 6693 (22.6) <0.0001 35–49 1177 (22.8) 2132 (15.7) 645 (30.3) 3837 (23.6) 422 (21.9) 6150 (20.7) 50–64 1278 (24.8) 3256 (24) 614 (28.9) 4749 (29.2) 550 (28.5) 8061 (27.2) ≥65 1494 (29) 6095 (45) 385 (18.1) 4250 (26.2) 700 (36.3) 8745 (29.5) Sex Female 4824 (93.6) 9962 (73.5) <0.0001 1990 (93.6) 13,214 (81.3) <0.0001 1498 (77.7) 22,599 (76.2) 0.1398 Male 332 (6.4) 3587 (26.5) 136 (6.4) 3032 (18.7) 430 (22.3) 7050 (23.8) Race/ethnicity Hispanic 911 (17.7) 2492 (18.4) <0.0001 69 (3.2) 854 (5.3) 0.0001 273 (14.2) 5242 (17.7) <0.0001 Non-Hispanic Black 160 (3.1) 556 (4.1) 918 (43.2) 7136 (43.9) 691 (35.8) 11,822 (39.9) Non-Hispanic Asian 108 (2.1) 402 (3) 72 (3.4) 702 (4.3) 212 (11) 2846 (9.6) Non-Hispanic White 3704 (71.8) 9323 (68.8) 922 (43.4) 6475 (39.9) 651 (33.8) 8416 (28.4) Non-Hispanic Other known 173 (3.4) 485 (3.6) 17 (0.8) 111 (0.7) 90 (4.7) 1208 (4.1) Unknown 100 (1.9) 291 (2.1) 128 (6) 968 (6) 11 (0.6) 115 (0.4) Charlson Comorbidity classes 0 (none) 3310 (64.2) 6961 (51.4) <0.0001 1544 (72.6) 9870 (60.8) <0.0001 1084 (56.2) 18,260 (61.6) <0.0001 1 872 (16.9) 2264 (16.7) 307 (14.4) 2637 (16.2) 308 (16) 4587 (15.5) ≥2 974 (18.9) 4324 (31.9) 275 (12.9) 3739 (23) 536 (27.8) 6802 (22.9) Area Disadvantage Index Lowest quartile 3236 (62.8) 7677 (56.7) <0.0001 586 (27.6) 4095 (25.2) 0.0039 1073 (55.7) 14,678 (49.5) <0.0001 Lower mid-quartile 1686 (32.7) 5096 (37.6) 770 (36.2) 5618 (34.6) 455 (23.6) 8214 (27.7) Upper mid-quartile 178 (3.5) 574 (4.2) 476 (22.4) 3975 (24.5) 253 (13.1) 4354 (14.7) Highest quartile 56 (1.1) 202 (1.5) 294 (13.8) 2558 (15.7) 147 (7.6) 2403 (8.1)When assessing the weighted percentages of virtual encounters completed for each of the ancillary service orders across eras, KPCO and KPGA experienced a significant decrease in virtual encounters between the prepandemic and COVID-19 Era 1 for urine cultures (KPCO: prepandemic=31.9%, Era 1=25.4%, P<0.001; KPGA: prepandemic=43.0%, Era 1=25.5%, P<0.001) and second-line antibiotics (KPCO: prepandemic=36.2%, Era 1=30.6%, P<0.001; KPGA: prepandemic=19.2%, Era 1=11.0%, P<0.001). KPMAS saw an increase in urine cultures (prepandemic=17.7%, Era 1=24.6%, P<0.001) and any antibiotic (prepandemic=21.3%, Era 1=25.8%, P=0.0004) during the same eras (Table 2). Comparing the COVID-19 Era 1 (April 2020–June 2020) and Era 2 (July 2020–June 2021) for KPCO and KPGA for any antibiotic, there were no statistical significant difference in service orders during a virtual encounter (KPCO, P=0.4108; KPGA, P=0.9482), while KPMAS experienced a decrease in these orders during COVID-19 Era 2 (Era 1=25.7%, Era 2=21.3%, P<0.001).
TABLE 2 - Comparison of Ancillary Services Orders by Service Class and by Era (Prepandemic, COVID-19 Era 1, and COVID-19 Era 2) for All Virtual, Urinary Tract Infection–related Encounters Across 3 Integrated Health Care Systems Accounting for the Inverse Probability Treatment Weights by Era Percent of encounters with an ancillary service order Integrated health care system Era comparisons Any antibiotic Second-line antibiotic Urine culture Urine analysis CT/MRI Kaiser Permanente Colorado Prepandemic (January 2019–March 2020) 38.6% 36.2% 31.9% 45.8% 2.7% COVID-19 Era 1 (April 2020–June 2020) 35.6% 30.6% 25.4% 39.3% 4.7% P 0.0118 <0.0001 <0.0001 <0.0001 <0.0001 COVID-19 Era 1 (April 2020–June 2020) 35.0% 29.8% 25.0% 39.4% 5.6% COVID-19 Era 2 (July 2020–June 2021) 34.1% 29.5% 23.1% 35.7% 5.7% P 0.4108 0.7878 0.0808 0.0019 0.7846 Kaiser Permanente Georgia Prepandemic (January 2019–March 2020) 28.3% 19.2% 43.0% 42.6% 2.5% COVID-19 Era 1 (April 2020–June 2020) 26.0% 11.0% 25.5% 31.2% 2.5% P 0.0839 <0.0001 <0.0001 <0.0001 0.9054 COVID-19 Era 1 (April 2020–June 2020) 25.7% 11.1% 25.5% 31.6% 2.7% COVID-19 Era 2 (July 2020–June 2021) 25.6% 12.7% 32.4% 37.1% 2.9% P 0.9482 0.053 <0.0001 <0.0001 0.5541 Kaiser Permanente Mid-Atlantic States Prepandemic (January 2019–March 2020) 21.3% 6.2% 17.1% 35.2% 8.2% COVID-19 Era 1 (April 2020–June 2020) 25.8% 5.8% 24.6% 46.6% 5.9% P 0.0004 0.5908 <0.0001 <0.0001 0.0021 COVID-19 Era 1 (April 2020–June 2020) 25.7% 5.7% 24.8% 47.1% 6.1% COVID-19 Era 2 (July 2020–June 2021) 21.3% 6.6% 26.2% 53.7% 8.9% P <0.0001 0.0976 0.1524 <0.0001 <0.0001CT/MRI indicates computed tomography/magnetic resonance imaging.
Order fulfillment weighted percentages for all virtual UTI-related encounters remained above 65% for all ancillary services, across eras and KP sites (Table 3). In KPGA, during the Era 2 (July 2020–June 2021), order fulfillment rate was 91.1%, 90.4%, 93.4%, 91.2%, and 70.8% for any antibiotic, second-line antibiotics, urine culture, urine analysis, and CT/MRI, respectively. This pattern during the COVID-19 Era 2 was similar for KPCO and KPMAS. KPMAS maintained an order fulfillment above 90% for COVID-19 Era 1 and Era 2 for any antibiotic, second-line antibiotics, and urine cultures.
TABLE 3 - Comparison of Ancillary Services Order Fulfillments by Service Class and by Era (Prepandemic, COVID-19 Era 1, and COVID-19 Era 2) for All Virtual, Urinary Tract Infection–related Encounters Across 3 Integrated Health Care Systems Accounting for the Inverse Probability Treatment Weights by Era Percent of encounters with an ancillary service order fulfillment Integrated health care system Era comparisons Any antibiotic Second-line antibiotic Urine culture Urine analysis CT/MRI Kaiser Permanente Colorado Prepandemic (January 2019–March 2020) 92.1% 92.3% 99.1% 87.2% 71.1% COVID-19 Era 1 (April 2020–June 2020) 91.0% 90.8% 98.8% 82.5% 75.8% P 0.3186 0.1955 0.5609 0.0005 0.3953 COVID-19 Era 1 (April 2020–June 2020) 91.1% 90.9% 98.5% 82.7% 76.3% COVID-19 Era 2 (July 2020–June 2021) 87.9% 87.4% 98.0% 86.3% 70.8% P 0.016 0.0157 0.5144 0.0126 0.2267 Kaiser Permanente Georgia Prepandemic (January 2019–March 2020) 88.6% 90.2% 71.2% 66.9% 79.6% COVID-19 Era 1 (April 2020–June 2020) 85.3% 86.6% 93.7% 88.8% 67.7% P 0.0921 0.1433 <0.0001 <0.0001 0.1533 COVID-19 Era 1 (April 2020–June 2020) 85.5% 86.3% 94.0% 89.3% 65.0% COVID-19 Era 2 (July 2020–June 2021) 91.1% 90.4% 93.4% 91.2% 70.8% P 0.0003 0.0736 0.6495 0.13 0.3958 Kaiser Permanente Mid-Atlantic States Prepandemic (January 2019–March 2020) 92.5% 90.2% 94.4% 72.9% 83.7% COVID-19 Era 1 (April 2020–June 2020) 93.0% 92.2% 94.2% 81.2% 83.2% P 0.758 0.5449 0.9021 <0.0001 0.9166 COVID-19 Era 1 (April 2020–June 2020) 92.9% 92.3% 94.4% 81.0% 82.6% COVID-19 Era 2 (July 2020–June 2021) 91.3% 90.1% 95.2% 82.0% 84.4% P 0.1936 0.3834 0.4221 0.4051 0.5522CT/MRI indicates computed tomography/magnetic resonance imaging.
The weighted percentage of ancillary service orders and order fulfillments comparing prepandemic and COVID-19 Era 2 (July 2020–June 2021) for KPCO, KPGA, and KPMAS are reported in Table 4. The weighted percentage of UTI encounters with any antibiotic order decreased between the prepandemic and Era 2 in KPCO for virtual encounters (prepandemic=38.2%, Era 2=34.9%, P<0.05), while any antibiotic order increased for in-person UTI encounters (prepandemic=37.8%, Era 2=41.2%, P<0.005). The percentage of ancillary service orders placed during a virtual encounter remained lower than the percentage of orders placed during an in-person encounter, regardless of service or era. However, the percentage for order fulfillments remained above 65.4%
留言 (0)