
記住我
Tectal glioma (TG) is a rare tumor with a variable clinical course. Tectal glioma usually involves critical locations in the brainstem (Fig. 1). Because biopsy may be associated with damage to the optic and auditory pathways, TG is usually diagnosed by characteristic imaging features (hypointense/isointense on T1-weighted magnetic resonance [MR] images, hyperintense on T2-weighted MR images, rare contrast enhancement).1–4 When biopsied, TG typically displays low-grade histologic features.1,5–7 The overwhelming majority of tectal tumors are low-grade astrocytomas (World Health Organization [WHO] grades I–II).1,4,8–10 Other less common tectal lesions include ependymoma, ganglioglioma, primitive neuroectodermal tumor, metastasis, and hamartoma.6,11 Low- and high-grade TG can look identical on MR imaging (MRI), and a definitive diagnosis is possible only with histological examination of a tissue sample.3,12
 FIGURE 1: Anatomical relationship of the brainstem, superior and inferior colliculi, and Sylvian aqueduct. Figure 1 can be viewed online in color at www.jcat.org.
Most TGs are low grade and tend to remain stable in size for years.4 However, malignant TGs demonstrate progressive tumor growth with neurologic sequelae.13 Previous studies have suggested a link between imaging characteristics and survival in children with TGs. Most case series on TGs discussed in the neurosurgical literature are pediatric1,2,8,14–16; there are very few studies of TG in adults, and whether imaging features impact progression-free survival (PFS) in adults with TG has not been investigated. Given that current literature may overrepresent pediatric patients, we aimed to determine the association between TG tumors' imaging characteristics and PFS in both adult and pediatric patients.
METHODSIn this retrospective cohort study, we analyzed imaging studies and clinical data from 39 patients with TGs presented at the MD Anderson Cancer Center, Houston, between April 18, 1987, and July 17, 2019, using chart review of the institutional database. Biopsy specimens and pathology reports were reviewed when available; TG was diagnosed based on imaging characteristics of the tumors and patient history (differential diagnosis was performed by board-certified neuroradiologists between typical imaging features of low-grade glial tumors of the tectum [these are normally hypo/isointense on T1-weighted MR images, hyperintense on T2-weighted MR images, rare contrast enhancement] vs other common tectal lesions) if the histopathological evaluation was not performed (Fig. 2).
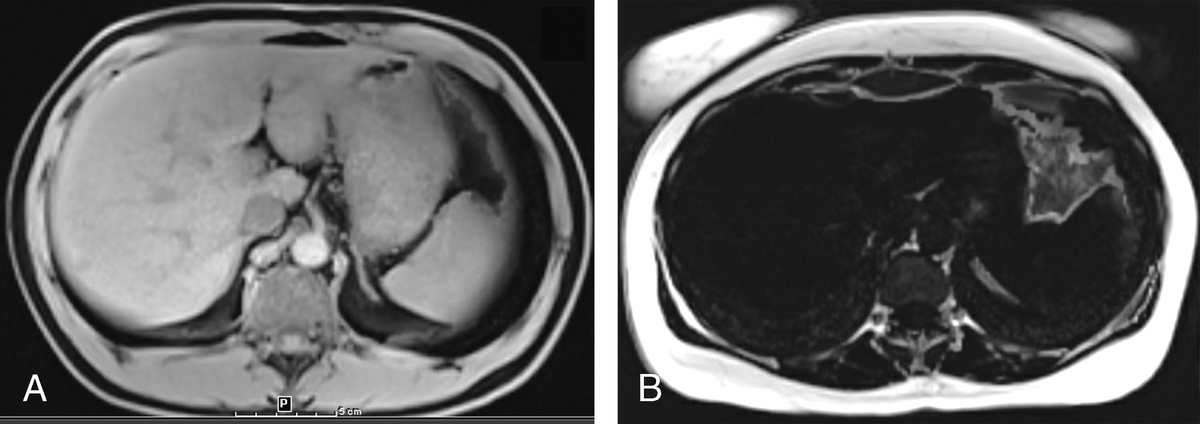
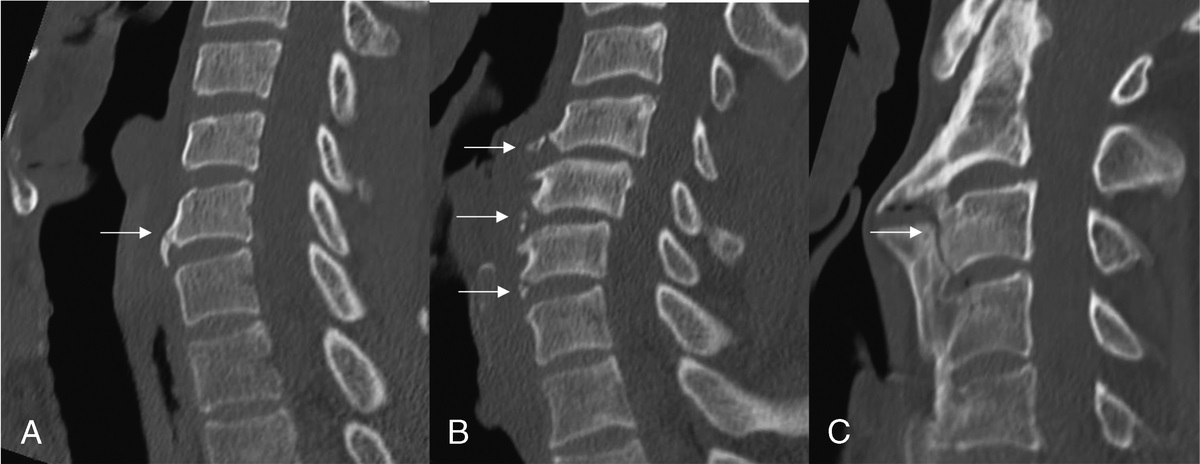
 FIGURE 2:
 Postcontrast T1-weighted sagittal MR scan from the MD Anderson database (A) demonstrates a typical nonenhancing, T1 hypointense glioma of the tectal plate (white arrow) in an adult male patient. Postcontrast T1-weighted sagittal image (B) demonstrates a follow-up scan of the same tectal plate lesion that has increased in size and now is obstructing cerebral aqueduct (white arrowhead). Axial T2-weighted image (C) shows typical T2 hyperintensity of this lesion (white arrow), and follow-up axial T2-weighted MR scan (D) illustrates increase in size of the lesion (white arrow).
“Tectal” location was defined as primarily originating from the quadrigeminal plate or extending beyond it, but with the primary mass in the tectum. Periaqueductal tumors incorporating the tectum were included. Pineal lesions, diffuse intrinsic pontine gliomas, and nonglioma tectal tumors were excluded.
Imaging CharacteristicsImaging characteristics, including the presence or development over time of contrast enhancement, calcification, cystic changes (presence of a fluid-filled cavity in the lesion), hydrocephalus, and diffusion restriction were analyzed. Imaging analysis based on pretreatment MRI examinations was performed by 2 neuroradiologists (1 and 9 years of experience). Discordances among readers were adjudicated by consensus. Each tumor was assessed for size, restricted diffusion, calcifications, cystic, and/or enhancing tumor components at every time point.
Statistical AnalysisDescriptive analyses were performed to characterize patients based on demographics, clinical characteristics, and imaging characteristics. We used the Kaplan-Meier survival analysis method for determining the association between imaging characteristics with the PFS. Progression-free survival was measured from time of diagnosis to radiographic or pathological disease progression during observation period. All patients have available follow-ups of at least 1 year of duration, and frequency of follow-up scans varied from 4 weeks to 12 months according to patients clinical presentation and imaging characteristics of the tumor (increase in size and/or development of contrast enhancement warranted more vigilant follow-up). Progression-free survival was selected as a measure of survival over overall survival because all the patients in this population remained alive and it was impossible to calculate overall survival. Patients who did not experience disease progression were censored at the date of the last follow-up (Figs. 3, 4). Progression-free survival differences by various imaging characteristics were assessed using the log-rank test and univariable Cox proportional hazard regression. All statistical analyses were performed using STATA version 16.1 (Stata Corp, College Station, Tex).
 FIGURE 3:
 Progression-free survival of TG by T2 size (<20 and ≥20 mm) and presence or absence of contrast enhancement initially or later. Progression-free survival defined from date of presentation to date of disease progression.
 FIGURE 4:
 Progression-free survival by various categories—age, sex, and T2 size (<20 and ≥20 mm).
Institutional Review Board StatementThe institutional review board of the University of Texas MD Anderson Cancer Center approved this retrospective cohort study. Informed consent was waived for this retrospective, noninterventional study.
RESULTS Demographic and Clinical Characteristics of the Study PopulationAge at presentation ranged from 2 to 64 years with a median of 22 years; two-thirds of patients were older than 18 years at presentation (Table 1). Twenty-one patients (53.9%) were female, and the majority were White (79.5%).
TABLE 1 - Demographic and Clinical Characteristics of the Study Population Characteristics All TG Patients (N = 39), n (%) Demographics Age at presentation, y* 22 (16–34) Age at presentation categories <18 y 13 (33.3) ≥18 y 26 (66.7) Sex, female 21 (53.9) Race White 31 (79.5) Black 4 (10.3) Hispanic 3 (7.7) Other 1 (2.6) Treatment measures Extent of resection Biopsy 11 (28.2) Subtotal resection 6 (15.4) Gross total resection 2 (5.1) No surgery 20 (51.3) Shunt placement 18 (46.2) ETV 17 (43.6) Radiation therapy 13 (33.3) Whole brain 1 (2.6) Conformal/IMRT 8 (20.5) Proton 3 (7.7) Chemotherapy 8 (20.5) Tumor pathology (available in 17) WHO grade I 6 (15.4) WHO grade II 4 (10.3) WHO grade III 2 (5.1) WHO grade IV 1 (2.6) Others (nondiagnostic) 4 (10.3) Mutations IDH1 or IDH2 (n = 2) 0 (0) H3F3A (n = 1) 1 (2.6) TP53 (n = 4) 1 (2.6)*Median (interquartile range).
IMRT indicates intensity-modulated radiation therapy.
Eighteen patients (46.2%) received ventriculoperitoneal shunting, and 17 patients (43.63%) underwent endoscopic third ventriculostomy (ETV), which in all cases was performed at presentation of hydrocephalus. Of those patients who underwent ventriculoperitoneal shunting, 11 (61%) required shunt revisions (from 1 to 7 times) and 9 eventually required an ETV. Eight patients (20.5%) received chemotherapy. Thirteen patients (33.3%) received radiation therapy: as upfront adjuvant therapy in 4 cases and at progression in 9. Surgical treatment in most cases begun after disease progression. Six patients received concurrent chemotherapy and radiation therapy. Of 39 patients, tissue was obtained in 19 cases (43.6%): 2 patients were treated by gross total tumor resection, 6 patients underwent subtotal resection, and 11 patients underwent biopsy only (tissue was obtained endoscopically during ETV in 8 patients who underwent biopsy; in other 3 patients, the tissue was obtained stereotactically). Gross total resection in one case was performed at disease progression, confirmed with imaging findings; in another case, the lesion was large at presentation (35 mm) with concerning imaging features (presence of contrast enhancement and restricted diffusion). Subtotal resection was performed at disease progression.
In patients with TGs, management for hydrocephalus is needed to improve clinical picture and prevent irreversible changes. The criterion standard of treatment at our institution is ETV; endoscopic biopsy may be performed if it is possible to use the same approach that is used for ETV.
PathologyOf the 19 patients of whom tissue was obtained, a biopsy was nondiagnostic in 4 of them; in 2 cases, the histological specimens and/or reports were not available for review. Six of the histologically confirmed tumors were WHO grade I, 4 were WHO grade II, 2 tumors were WHO grade III, and 1 tumor was WHO grade IV; 2 of 3 high-grade tumors presented with contrast enhancement at initial diagnosis. One patient with high-grade glioma (WHO grade III) developed contrast enhancement later in the course of the disease.
Imaging CharacteristicsThe mean tumor T2 size (maximal diameter) at diagnosis was 20.7 mm (SD ± 11.4 mm; Table 2). Postcontrast imaging was obtained in 35 patients; the tumors showed contrast enhancement on initial MRI in 11 cases (31.4%). Development of contrast enhancement among initially nonenhancing lesions was observed in 3 cases. Hydrocephalus was initially present in 34 patients (87.2%). In 5 patients, a cystic component was initially present; in one of those patients, the cyst demonstrated an increase in size; 3 of those 5 patients have WHO grade I tumors; in the other 2 patients, histological diagnosis was not obtained. In 4 patients, the lesion developed a cystic component within the period of observation; of those 4 patients, 2 have WHO grade I tumors and 1 has WHO grade III tumor; in the other patient, histological diagnosis was not obtained. Only one lesion showed the presence of calcification. Only one TG (WHO grade III) displayed restricted diffusion on diffusion-weighted imaging (DWI).
TABLE 2 - Imaging Characteristics of the TG Lesions Imaging Characteristics All TG Patients (N = 39), n (%) Lesion T2 size, mm* 20.7 (11.4) Lesion T2 size categories <20 mm 21 (53.8) ≥20 mm 18 (46.2) Subsequent lesion T2 size, mm* 22.9 (12.6) Peritumoral T2 hyperintensity Mild 20 (51.3) Moderate 1 (2.6) None 18 (46.2) Postcontrast imaging (n = 35) Contrast enhancement 11 (28.2) Lesion T1 postcontrast size, mm* 11.5 (9.8) Lesion T1 postcontrast size categories <10 mm 6 (15.3) ≥10 mm 5 (12.8) Contrast enhancement during surveillance among nonenhancing initial lesion 3 (7.7) Hydrocephalus Present initially 34 (87.2) Later developed 0 (0) Presence of cystic lesion Initially 5 (12.8) Initial size of cyst, mm* 14 (6.3) Later developed or original grew 5 (13.1) Later size of cyst, mm* 16.8 (8.3) Presence of Calcification Initially 1 (2.6) Later developed 0 (0) DWI (n = 29) Reduced diffusion 1 (3.4) Lesion ADC value† 1258 (1123–1778) Lesion ADC value categories <1250 11 (28.2) ≥1250 15 (38.5) Normal appearing cerebellum ADC value† 750 (690–800) Presence of LMD 0 (0)*Mean (standard deviation).
†Median (interquartile range).
ADC indicates apparent diffusion coefficient; LMD, leptomeningeal disease.
Tumor progression was observed in 15 cases (38.5%; Table 3). In 14 patients, progression was defined with imaging and only in one case—with histological examination of the tissue specimen. Median PFS was 21.8 years. Within the group of patients (11) with contrast enhancement, 7 of 11 (63.6%) showed growth progression, whereas in those without contrast enhancement, only 6 of 28 (21.4%) progressed. Tectal gliomas that showed contrast enhancement initially and/or developed contrast enhancement during surveillance on MRI had significantly lower PFS than those without (hazard ratio [HR], 3.55; 95% confidence interval [CI], 1.09–11.58; P = 0. 04). Tumors with T2 size ≥20 mm had similar PFS as that of tumors with T2 size <20 mm (HR, 1.04; 95% CI, 0.37–2.86; P = 0.95). Patients with mild or moderate peritumoral T2 hyperintensity had longer PFS than those without peritumoral T2 hyperintensity (HR, 0.59; 95% CI, 0.21–1.72), but this association was not significant (P = 0.34; definition of T2 hyperintensity levels: mild—less volume as lesion; moderate—between 1× and 2× volume of lesion; severe—greater than 2× lesion volume). There was no statistically significant association between the initial presence or development of cystic component and PFS, nor between diffusion restriction of the lesion and PFS (P > 0.05).
TABLE 3 - Association Between PFS and Imaging Characteristics of the TG Lesion Using Univariable Cox Proportional Hazard Regression Imaging Characteristics Median PFS, mo Univariate HR (95% CI) P Lesion T2 size continuous, mm NA 1.01 (0.96–1.06) 0.59 Lesion T2 size categories 0.95 <20 mm 21.7 Ref ≥20 mm 22.7 1.04 (0.37–2.86) Peritumoral T2 hyperintensity 0.34 Mild/moderate 21.7 0.59 (0.21–1.72) None 5.0 Ref Postcontrast imaging (n = 35) Contrast enhancement initial 0.10 Yes 12.5 2.51 (0.83–7.58) No — Ref Contrast enhancement initial or later 0.04 Yes 12.5 3.55 (1.09–11.58) No — Ref Lesion T1 postcontrast size (n = 11) continuous, mm NA 0.89 (0.76–1.03) 0.14 Lesion T1 postcontrast size categories 0.11 <10 mm 2.0 Ref ≥10 mm 22.7 0.16 (0.02–1.49) Presence of cystic lesion initially 0.73 Yes 22.8 1.25 (0.34–4.50) No 21.7 Ref Presence of cystic lesion initial or later developed or original grew 0.48 Yes 21.7 1.46 (0.50–4.17) No 12.5 Ref DWI (n = 29) Lesion ADC value categories 0.51 <1250 12.5 Ref ≥1250 — 1.59 (0.39–6.39)ADC indicates apparent diffusion coefficient; NA, not available.
On MR scans, TGs usually have a well-defined border; they are typically hypointense or isointense on T1-weighted MR images and hyperintense on T2-weighted images and rarely show contrast enhancement.1,2,10 Even though some TG demonstrate clear tumor characteristics on MRI (such as large volume, contrast enhancement, and cystic degeneration), we still require histological confirmation to distinguish low-grade tumors from high-grade tumors in this region. We decided to investigate MRI results and their relationship with survival in patients with TGs.
Our study's most important observation is that TGs that showed contrast enhancement (CE) initially and/or developed CE during surveillance had significantly lower PFS than those without CE. The presence of contrast enhancement can be used as a noninvasive way of expected survival.
This finding remains controversial in previously published work. Liu et al4 stated that imaging features such as large lesion size (area), contrast enhancement, and cystic changes could predict shorter PFS. This study focused on children (median age at diagnosis, 9.9 years). Squires et al9 also associated contrast enhancement with tumor growth and disease progression. Poussaint et al15 used maximal tumor diameter and contrast enhancement in children with TGs to calculate the likelihood of further radiation therapy being required. According to their work, larger tumor size and contrast enhancement were significant predictors of the need for further treatment. However, several studies did not support contrast enhancement to predict more aggressive treatment or shorter survival. Ternier et al2 used tumor volume to predict the need for surgery in children with TGs, but contrast enhancement was not a statistically significant predictor for invasive treatment.
In addition to contrast enhancement and size (circumscription/volume), other imaging findings, such as the presence of hydrocephalus, cystic components, and calcifications, have been studied in the previous literature.1,2,4,10,15 Similar to studies conducted by Kershenovich et al,1 Ternier et al,2 Liu et al,4 Mohme et al,13 and Poussaint et al,15 we also analyzed tumor size and presence/development of cystic components and their relationship with PFS. We were unable to find a statistically significant correlation between tumor size (<20 and >20 mm) and PFS described in studies by Kershenovich et al,1 Liu et al,4 Ternier et al,2 and Poussaint et al.15 This is probably related to the fact that lesion volume1,2 or circumscription4 was analyzed in those listed above studies instead of lesion size (longest diameter). Only Poussaint et al15 found statistically significant differences between maximal diameter and contrast enhancement in the treated versus untreated group, that is, patients with lesion size greater than 2.5 cm and contrast-enhancing lesions were much more likely to require surgery and/or radiation therapy. We also did not find a statistically significant relationship between PFS and the presence/development of cystic components. A study by Poussaint et al15 also did not show a clear relationship between cystic components of TGs and changes in treatment requirements. When analyzing PFS in patients younger than 18 years and older than 18 years, no statistically significant differences were found.
In contrast to previously published studies with an overrepresented pediatric population, our case series analyzed both adult and pediatric populations.3,4,14,16,17 Hence, we determined that a statistically significant relationship exists between PFS and contrast enhancement in TGs in both children and adults.
Limitations of the StudyOur study's limitations include its retrospective nature and the overall rare prevalence of TG. Although all patients were evaluated and treated at a single institution, not all of the pathology specimens were reviewed at our institution. Some surgeries/biopsies were performed at outside hospitals, limiting the ability to obtain pathology specimens for rereview.
Timeframe of more than 3 decades can potentially make the study prone to biases related to MR techniques. Modern scanners, contrast agents, and sequences (such as MPRAGE and SPACE) can improve the conspicuity and range of enhancement that can be detected over older techniques. Thus, it is possible that if we chose to categorize patients by degree of enhancement, this would have been an issue; however, we classified patients as having either enhancing or nonenhancing lesions (binary classification), and we do not feel that changes in technique over time are great enough to lead to mischaracterization with this scheme.
Tumor progression rate was higher than expected, comparing with current literature; this could be attributed to higher percentage of high-grade tumors in this cohort.
Treatment approach can potentially have confounding effect on the conclusion that enhancement is a significant imaging feature in predicating PFS; however, in all but one case, surgical/adjuvant treatment was performed at disease progression. That one case is not an outlier and fits in the average PFS for this cohort. Treatment strategies over 3 decades changed from using VP shunting to using ETV as a criterion standard.
We could not find a statistically significant relationship between various important imaging characteristics (tumor size, cystic changes) and PFS. Only 5 lesions contained cysts, and only one lesion contained calcifications; only one lesion demonstrated restricted diffusion on MRI.
Biopsies were mainly taken from large lesions that had worrisome features or demonstrated MRI progression.
CONCLUSIONSAnalysis of this population shows that considerable subgroup of population with TG will progress. Initial or developed CE on MRI is associated with shorter PFS in patients with TG. Advanced brain tumor imaging may be helpful to further investigate patients with TG in noninvasive fashion.
REFERENCES 1. Kershenovich A, Silman Z, de Rungs D, et al. Tectal lesions in children: a long-term follow-up volumetric tumor growth analysis in surgical and nonsurgical cases. Pediatr Neurosurg. 2016;51:69–78. 2. Ternier J, Wray A, Puget S, et al. Tectal plate lesions in children. J Neurosurg. 2006;104(6 suppl):369–376. 3. Igboechi C, Vaddiparti A, Sorenson EP, et al. Tectal plate gliomas: a review. Childs Nerv Syst. 2013;29:1827–1833. 4. Liu APY, Harreld JH, Jacola LM, et al. Tectal glioma as a distinct diagnostic entity: a comprehensive clinical, imaging, histologic and molecular analysis. Acta Neuropathol Commun. 2018;6:101. 5. Kaku Y, Yonekawa Y, Taub E. Transcollicular approach to intrinsic tectal lesions. Neurosurgery. 1999;44:338–343. 6. Lapras C, Bognar L, Turjman F, et al. Tectal plate gliomas. Part I: microsurgery of the tectal plate gliomas. Acta Neurochir. 1994;126:76–83. 7. Oka K, Kin Y, Go Y, et al. Neuroendoscopic approach to tectal tumors: a consecutive series. Neurosurg Focus. 1999;6:e14. 8. May PL, Blaser SI, Hoffman HJ, et al. Benign intrinsic tectal “tumors” in children. J Neurosurg. 1991;74:867–871. 9. Squires LA, Allen JC, Abbott R, et al. Focal tectal tumors: management and prognosis. Neurology. 1994;44:953–956. 10. Bognar L, Turjman F, Villanyi E, et al. Tectal plate gliomas. Part II: CT scans and MR imaging of tectal gliomas. Acta Neurochir. 1994;127:48–54. 11. Barkovich AJ, Newton TH. MR of aqueductal stenosis: evidence of a broad spectrum of tectal distortion. AJNR Am J Neuroradiol. 1989;10:471–476. 12. Boydston WR, Sanford RA, Muhlbauer MS, et al. Gliomas of the tectum and periaqueductal region of the mesencephalon. Pediatr Neurosurg. 1991;17:234–238. 13. Mohme M, Fritzsche FS, Mende KC, et al. Tectal gliomas: assessment of malignant progression, clinical management, and quality of life in a supposedly benign neoplasm. Neurosurg Focus. 2018;44:E15. 14. Wellons JC 3rd, Tubbs RS, Banks JT, et al. Long-term control of hydrocephalus via endoscopic third ventriculostomy in children with tectal plate gliomas. Neurosurgery. 2002;51:63–67. 15. Poussaint TY, Kowal JR, Barnes PD, et al. Tectal tumors of childhood: clinical and imaging follow-up. AJNR Am J Neuroradiol. 1998;19:977–983. 16. Bowers DC, Georgiades C, Aronson LJ, et al. Tectal gliomas: natural history of an indolent lesion in pediatric patients. Pediatr Neurosurg. 2000;32:24–29. 17. Javadpour M, Mallucci C. The role of neuroendoscopy in the management of tectal gliomas. Childs Nerv Syst. 2004;20(11–12):852–857.
留言 (0)