


記住我


Writing—original draft, J.H.; Writing—review & editing, J.H., S.L. and M.Q.; Conceptualization, J.H., S.L. and M.Q.; Data curation, J.H., H.Z. and T.Z.; Formal analysis, J.H., H.Z.; Investigation, J.H., H.Z., C.Z., T.Z. and M.Z.; Methodology, J.H., H.Z. and S.L.; Funding acquisition, Y.C. and M.Q. All authors have read and agreed to the published version of the manuscript.
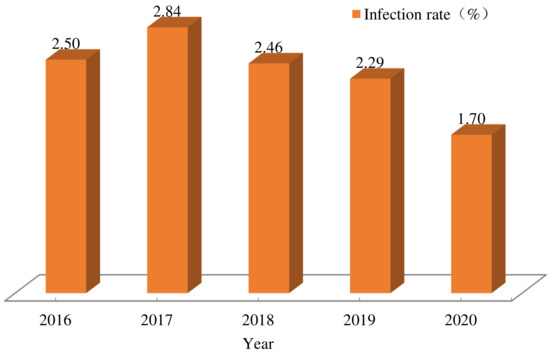
Figure 1. Enterobius vermicularis infections among children aged 3 to 9 years old in China from 2016 to 2020. The differences of the annual infection rates were statistically significant from 2016 to 2020 (χ2 = 159.02, P < 0.0001).
Figure 1. Enterobius vermicularis infections among children aged 3 to 9 years old in China from 2016 to 2020. The differences of the annual infection rates were statistically significant from 2016 to 2020 (χ2 = 159.02, P < 0.0001).
Figure 2. Enterobius vermicularis infection among children by ages in China from 2016 to 2020. The difference in infection rate was significant among ages in each year (χ2 values of 70.32, 112.62, 79.89, 128.73 and 84.33, respectively, with P < 0.0001).
Figure 2. Enterobius vermicularis infection among children by ages in China from 2016 to 2020. The difference in infection rate was significant among ages in each year (χ2 values of 70.32, 112.62, 79.89, 128.73 and 84.33, respectively, with P < 0.0001).
Figure 3. The provincial results of Getis-Ord Gi* from 2016 to 2020.
Figure 3. The provincial results of Getis-Ord Gi* from 2016 to 2020.
Figure 4. The county-level results of Getis-Ord Gi* from 2016 to 2020.
Figure 4. The county-level results of Getis-Ord Gi* from 2016 to 2020.
Figure 5. Space–time scanning analysis of Enterobius vermicularis infection among children in China from 2016 to 2020.
Figure 5. Space–time scanning analysis of Enterobius vermicularis infection among children in China from 2016 to 2020.
Table 1. Enterobius vermicularis infection among children aged 3 to 9 years old in China from 2016 to 2020.
Table 1. Enterobius vermicularis infection among children aged 3 to 9 years old in China from 2016 to 2020.
Province (Municipality/Autonomous Region)2016Table 2. Enterobius vermicularis infection among children by gender and ethnicity in China from 2016 to 2020.
Table 2. Enterobius vermicularis infection among children by gender and ethnicity in China from 2016 to 2020.
Feature2016Table 3. Enterobius vermicularis infection among children by ages in China from 2016 to 2020.
Table 3. Enterobius vermicularis infection among children by ages in China from 2016 to 2020.
Ages2016Table 4. Global spatial autocorrelation analysis of Enterobius vermicularis infection among children in China from 2016 to 2020.
Table 4. Global spatial autocorrelation analysis of Enterobius vermicularis infection among children in China from 2016 to 2020.
YearMoran’s IExpected Moran’s I valueVarianceZ valueP value20160.154787−0.0344830.0046742.768400 0.005633 20170.235557−0.0344830.005313.705713 0.000211 20180.226277−0.0357140.0062863.304426 0.000952 20190.314987−0.0333330.0088583.700856 0.000215 20200.230413−0.0333330.0077342.999004 0.002709Table 5. Cluster analysis of Enterobius vermicularis infection among children in China from 2016 to 2020 by spatial and space–time scan statistic.
Table 5. Cluster analysis of Enterobius vermicularis infection among children in China from 2016 to 2020 by spatial and space–time scan statistic.
YearCluster Center (°)Radius (km)No. of Clustered CountiesLLRNo. of ObservedNo. of ExpectedP ValueLatitudeLongitude2017–201822.5199 113.3940 647.46 234532.57 1359523.50 0.0000 2016–201729.5538 117.2960 128.07 11238.40 18421.04 0.0000 2016–201729.1221 105.4950 171.33 37110.50 15033.24 0.0000 201834.3418 111.4940 99.94 1365.64 8015.87 0.0000 201937.2055 78.5104 257.96 1053.63 12441.60 0.0000 2019–202033.1618 113.8890 154.52 3339.56 17784.13 0.0000 201831.9484 104.9240 118.98 1527.97 346.70 0.0000 2016–201738.0833 116.3760 47.61 318.12 5119.19 0.0001 201735.6715 114.4770 39.42 412.54 3211.36 0.0190
留言 (0)