


記住我


Conceptualization, N.D.F. and A.L.; Methodology, N.D.F.; Validation, N.D.F. and A.M.; Formal Analysis, N.D.F.; Investigation, N.D.F. and A.L.; Writing—original draft preparation, N.D.F.; Writing—review and editing, N.D.F., A.M., N.T. and C.L.L.; Visualization, N.D.F. and C.L.L.; Supervision, C.L.L. All authors have read and agreed to the published version of the manuscript.
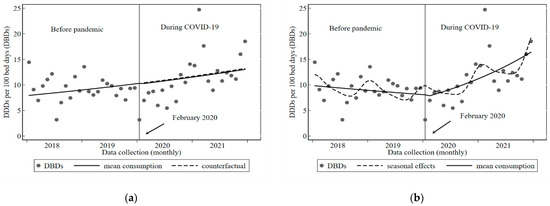
Figure 1. Inpatient antibiotic consumption at Vila Central Hospital, Vanuatu before and during COVID-19, 2018 to 2021: (a) Unadjusted model showing counterfactual; (b) Final model showing seasonal effects.
Figure 1. Inpatient antibiotic consumption at Vila Central Hospital, Vanuatu before and during COVID-19, 2018 to 2021: (a) Unadjusted model showing counterfactual; (b) Final model showing seasonal effects.
Figure 2. Outpatient antibiotic consumption at Vila Central Hospital, Vanuatu before and during COVID-19, 2018 to 2021: (a) Unadjusted model showing counterfactual; (b) Final model showing seasonal effects.
Figure 2. Outpatient antibiotic consumption at Vila Central Hospital, Vanuatu before and during COVID-19, 2018 to 2021: (a) Unadjusted model showing counterfactual; (b) Final model showing seasonal effects.
Table 1. Antibiotics for systemic use (J01) consumed by inpatients and outpatients at VCH, Vanuatu 2018 to 2021 with ATC code, route of administration, DDD units in grams obtained from the ATC/DDD index 2022 and Access, Watch and Reserve classification.
Table 1. Antibiotics for systemic use (J01) consumed by inpatients and outpatients at VCH, Vanuatu 2018 to 2021 with ATC code, route of administration, DDD units in grams obtained from the ATC/DDD index 2022 and Access, Watch and Reserve classification.
AntibioticClassATC CodeRouteDDD (g)AWaRe GroupAmoxicillinPenicillinsJ01CA040ral1.5AccessAmoxicillin ClavulanateBeta-lactam/beta-lactamase inhibitorJ01CR020ral0.625AccessAzithromycinMacrolidesJ01FA100ral0.3WatchCiprofloxacinFluoroquinolonesJ01MA020ral1WatchCloxacillinPenicillinsJ01CF020ral2AccessDoxycyclineTetracyclinesJ01AA020ral0.1AccessErythromycinMacrolidesJ01FA010ral1WatchMetronidazoleImidazoleJ01XD010ral1.5AccessPhenoxymethylpenicillinPenicillinsJ01CE020ral2AccessSulfamethoxazole/TrimethoprimSulphonamide/trimethoprimJ01EE010ral4AccessTable 2. Defined daily doses (DDDs) prescribed to inpatients and outpatients at Vila Central Hospital, Vanuatu before and during COVID-19: January 2018 to January 2020 and February 2020 and December 2021, respectively, with difference in mean monthly consumption before and during COVID-19.
Table 2. Defined daily doses (DDDs) prescribed to inpatients and outpatients at Vila Central Hospital, Vanuatu before and during COVID-19: January 2018 to January 2020 and February 2020 and December 2021, respectively, with difference in mean monthly consumption before and during COVID-19.
Antibiotic ConsumptionBefore the PandemicTable 3. Antibiotics prescribed by type in defined daily doses (DDDs) by inpatients and outpatients at Vila Central Hospital, Vanuatu before and during COVID-19: January 2018 to January 2020 and February 2020 and December 2021, respectively, with percentage of total consumption and DDD unit of measurement.
Table 3. Antibiotics prescribed by type in defined daily doses (DDDs) by inpatients and outpatients at Vila Central Hospital, Vanuatu before and during COVID-19: January 2018 to January 2020 and February 2020 and December 2021, respectively, with percentage of total consumption and DDD unit of measurement.
Antibiotics PrescribedTable 4. Antibiotic consumption by AWaRe classification for inpatients and outpatients at VCH, Vanuatu before and during COVID-19: January 2018 to January 2020 and February 2020 to December 2021, respectively, with percentage of total consumption according to AWaRe classification.
Table 4. Antibiotic consumption by AWaRe classification for inpatients and outpatients at VCH, Vanuatu before and during COVID-19: January 2018 to January 2020 and February 2020 to December 2021, respectively, with percentage of total consumption according to AWaRe classification.
Antibiotic Prescription by Access Watch and Restrict Class (AWaRe)AWaRe ClassificationBefore the Pandemic:
留言 (0)