


記住我


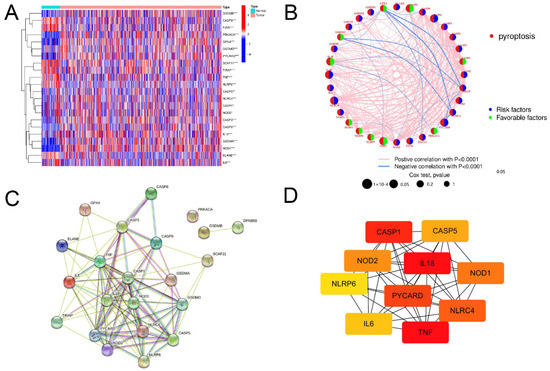
Figure 1. Pyroptosis-related clusters were determined according to 38 pyroptosis-related genes in BC. (A) A heatmap of the expression levels of 38 pyroptosis-related genes between the normal and tumor tissues. (B,C) Consensus clustering CDF and relative change in area under CDF curve for k = 2–9. (D) Consensus cluster matrix of breast cancer tumor samples when k = 2. (E,F) Two-dimensional principal component, and viSNE analysis based on the expression levels of 38 pyroptosis-related genes. The red dots represent C1, and the blue dots represent C2. (G–I) KM curves of PFI, DSS, and OS for the two pyroptosis-related clusters. Notes: *, p < 0.05; **, p < 0.01; ***, p < 0.001.
Figure 1. Pyroptosis-related clusters were determined according to 38 pyroptosis-related genes in BC. (A) A heatmap of the expression levels of 38 pyroptosis-related genes between the normal and tumor tissues. (B,C) Consensus clustering CDF and relative change in area under CDF curve for k = 2–9. (D) Consensus cluster matrix of breast cancer tumor samples when k = 2. (E,F) Two-dimensional principal component, and viSNE analysis based on the expression levels of 38 pyroptosis-related genes. The red dots represent C1, and the blue dots represent C2. (G–I) KM curves of PFI, DSS, and OS for the two pyroptosis-related clusters. Notes: *, p < 0.05; **, p < 0.01; ***, p < 0.001.
Figure 2. Biological functions and interactions of the differential gene expressions (DGEs) in the two pyroptosis-related clusters in BC. (A) A heatmap of the clinical relevance and DGEs (Fold change ≥ 1.5) of the two pyroptosis clusters. (B) Gene ontology (GO) annotation (biological process (BP), cellular component (CC), and molecular function (MF) of DGEs. (C) KEGG pathway analysis of DGEs. (D) Characterization of 22 types of immunocyte infiltration in breast cancer. (E) The proportion of immunocyte infiltration in the two pyroptosis-related clusters in breast cancer. (F) Protein–protein interaction network of DEGs. Notes: *, p < 0.05; **, p < 0.01; ***, p < 0.001.
Figure 2. Biological functions and interactions of the differential gene expressions (DGEs) in the two pyroptosis-related clusters in BC. (A) A heatmap of the clinical relevance and DGEs (Fold change ≥ 1.5) of the two pyroptosis clusters. (B) Gene ontology (GO) annotation (biological process (BP), cellular component (CC), and molecular function (MF) of DGEs. (C) KEGG pathway analysis of DGEs. (D) Characterization of 22 types of immunocyte infiltration in breast cancer. (E) The proportion of immunocyte infiltration in the two pyroptosis-related clusters in breast cancer. (F) Protein–protein interaction network of DEGs. Notes: *, p < 0.05; **, p < 0.01; ***, p < 0.001.
Figure 3. Construction of a 56-gene prognostic signature for BC based on pyroptosis-related DEGs. (A) A forest plot of multivariable Cox regression analyses. (B) The distribution and survival status of BC patients with different risk scores. The blue and red dots represent clinical events or no clinical events. (C) A vioplot of the 56-gene signature in the two risk groups. (D–F,J–L), KM curves of PFI, DSS, and OS for high- and low-risk groups in the training and validation datasets. (G–I,M–O), ROC analysis shows the sensitivity and specificity of the 56-gene signature for predicting PFI, DSS, and OS for high- and low-risk groups in the training and validation datasets.
Figure 3. Construction of a 56-gene prognostic signature for BC based on pyroptosis-related DEGs. (A) A forest plot of multivariable Cox regression analyses. (B) The distribution and survival status of BC patients with different risk scores. The blue and red dots represent clinical events or no clinical events. (C) A vioplot of the 56-gene signature in the two risk groups. (D–F,J–L), KM curves of PFI, DSS, and OS for high- and low-risk groups in the training and validation datasets. (G–I,M–O), ROC analysis shows the sensitivity and specificity of the 56-gene signature for predicting PFI, DSS, and OS for high- and low-risk groups in the training and validation datasets.
Figure 4. KM and ROC curve analyses of patients stratified by age. (A–C,G–I), KM curves of PFI and DSS for high and low-risk groups in the ≤40-year, 41–60-year, and ≥61-year subgroups. (D–F,J–L), ROC analysis showed the sensitivity and specificity of prognostic signature for predicting PFI and DSS for high and low-risk groups in the ≤40-year, 41–60-year, and ≥61-year subgroups.
Figure 4. KM and ROC curve analyses of patients stratified by age. (A–C,G–I), KM curves of PFI and DSS for high and low-risk groups in the ≤40-year, 41–60-year, and ≥61-year subgroups. (D–F,J–L), ROC analysis showed the sensitivity and specificity of prognostic signature for predicting PFI and DSS for high and low-risk groups in the ≤40-year, 41–60-year, and ≥61-year subgroups.
Figure 5. KM and ROC curve analyses of patients stratified by tumor size status. (A–C,G–I), KM curves of PFI and DSS for high- and low-risk groups in the T1, T2, and T3–T4 subgroups. (D–F,J–L), ROC analysis showed the sensitivity and specificity of prognostic signature for predicting PFI and DSS for high- and low-risk groups in the T1, T2, and T3–T4 subgroups.
Figure 5. KM and ROC curve analyses of patients stratified by tumor size status. (A–C,G–I), KM curves of PFI and DSS for high- and low-risk groups in the T1, T2, and T3–T4 subgroups. (D–F,J–L), ROC analysis showed the sensitivity and specificity of prognostic signature for predicting PFI and DSS for high- and low-risk groups in the T1, T2, and T3–T4 subgroups.
Figure 6. KM and ROC curve analyses of patients stratified by lymph node and metastasis status. (A–E,K–O) KM curves of PFI and DSS for high- and low-risk groups in the N0, N1, N2–N3, M0, and M1 subgroups. (F–J,P–T) ROC analysis showed the sensitivity and specificity of the prognostic signature for predicting PFI and DSS for high- and low-risk groups in the N0, N1, N2–N3, M0, and M1 subgroups.
Figure 6. KM and ROC curve analyses of patients stratified by lymph node and metastasis status. (A–E,K–O) KM curves of PFI and DSS for high- and low-risk groups in the N0, N1, N2–N3, M0, and M1 subgroups. (F–J,P–T) ROC analysis showed the sensitivity and specificity of the prognostic signature for predicting PFI and DSS for high- and low-risk groups in the N0, N1, N2–N3, M0, and M1 subgroups.
Figure 7. KM and ROC curve analyses of patients stratified by molecular subtype (PAM50). (A–E,K–O) KM curves of PFI and DSS for high- and low-risk groups in the normal-like, Luminal A, Luminal B, HER2, Basal-like subgroups. (F–J,P–T) ROC analysis showed the sensitivity and specificity of prognostic signature for predicting PFI and DSS for high- and low-risk groups in the normal-like, Luminal A, Luminal B, HER2, Basal-like subgroups.
Figure 7. KM and ROC curve analyses of patients stratified by molecular subtype (PAM50). (A–E,K–O) KM curves of PFI and DSS for high- and low-risk groups in the normal-like, Luminal A, Luminal B, HER2, Basal-like subgroups. (F–J,P–T) ROC analysis showed the sensitivity and specificity of prognostic signature for predicting PFI and DSS for high- and low-risk groups in the normal-like, Luminal A, Luminal B, HER2, Basal-like subgroups.
Figure 8. Nomogram for predicting 5- and 10-year PFI and DSS of patients with BC and calibration curves of the nomogram. (A) A nomogram incorporating age, tumor size status, lymph node status, metastasis status, and risk group was a predictor for 5- and 10-year PFI. (B) A nomogram incorporating age, molecular subtype, lymph node status, metastasis status, and risk group was a predictor for 5- and 10-year DSS. (C,D) Calibrated plots were applied to investigate the deviation in nomogram-predicted of 5- and 10-year PFI. (E,F) Calibrated plots were applied to investigate the deviation in nomogram-predicted of 5- and 10-year DSS.
Figure 8. Nomogram for predicting 5- and 10-year PFI and DSS of patients with BC and calibration curves of the nomogram. (A) A nomogram incorporating age, tumor size status, lymph node status, metastasis status, and risk group was a predictor for 5- and 10-year PFI. (B) A nomogram incorporating age, molecular subtype, lymph node status, metastasis status, and risk group was a predictor for 5- and 10-year DSS. (C,D) Calibrated plots were applied to investigate the deviation in nomogram-predicted of 5- and 10-year PFI. (E,F) Calibrated plots were applied to investigate the deviation in nomogram-predicted of 5- and 10-year DSS.
Figure 9. KM curve analyses of patients stratified by four risk subgroups (prognostic signature and clinical risk subgroups). (A–C), KM curves of PFI, DSS, and OS for breast cancer in the four risk subgroups (G-C-, G-C+, G+C-, and G+C+ subgroups). KM curves of PFI, DSS, and OS for breast cancer in G-C- (D–F), G-C+ (G–I), G+C- (J–L), and G+C+ (M–O) subgroups.
Figure 9. KM curve analyses of patients stratified by four risk subgroups (prognostic signature and clinical risk subgroups). (A–C), KM curves of PFI, DSS, and OS for breast cancer in the four risk subgroups (G-C-, G-C+, G+C-, and G+C+ subgroups). KM curves of PFI, DSS, and OS for breast cancer in G-C- (D–F), G-C+ (G–I), G+C- (J–L), and G+C+ (M–O) subgroups.
Table 1. Demographic and Clinical, Pathologic Characteristics of Patients with Breast Cancer.
Table 1. Demographic and Clinical, Pathologic Characteristics of Patients with Breast Cancer.
VariableTraining Dataset Validation Dataset TotalRisk Groupχ2p ValueTotalRisk Groupχ2p ValueLowHighLowHigh n = 1025n = 717n = 308n = 512n = 355n = 157Age, year ≦409470246.4290.0404533125.6610.05941–60473345128 24317964 ≧61458302156 22414381 Subtype (PAM50) LumA48035712310.9570.0275435196.1740.187LumB17611066 25318667 HER2704822 865333 Basal17011159 392910 Normal1299138 805228 Tumor size T1261194675.9260.05211990293.5150.172T2601420181 30721097 T3–T416310360 865531 Lymph node status N04983511475.6500.059246170762.0330.362N134325093 16812246 N2–N318411668 986335 Metastasis status M0100971229711.5820.0015023521507.2430.011 aM116511 1037Table 2. Univariate and Multivariate Cox proportional hazard models of PFI and DSS in Breast Cancer.
Table 2. Univariate and Multivariate Cox proportional hazard models of PFI and DSS in Breast Cancer.
VariablesProgression-Free IntervalDisease-Specific SurvivalUnivariateMultivariateUnivariateMultivariateHR95% CIp ValueHR95% CIp ValueHR95% CIp ValueHR95% CIp ValueAge 41–60 year0.4680.285–0.7690.0030.50140.299–0.8410.0090.4460.228–0.4390.0180.4450.217–0.9120.027≧61 year0.6860.421–1.1190.1310.7160.431–1.1910.1980.8340.439–1.5850.580 0.9720.494–1.9120.935Subtype (PAM50) Luminal-A0.6750.416–1.0950.112 0.4170.222–0.7830.0060.4140.218–0.7870.007Luminal-B0.6940.370–1.3010.255 0.5890.269–1.2890.1850.3780.168–0.8510.019HER21.0400.485–2.2300.920 0.7570.279–2.0540.5840.8100.291–2.2580.687Basal-like1.2170.712–2.0810.473 0.9100.464–1.7870.7850.8410.415–1.7060.632Tumor size T21.8651.144–3.0420.0131.4760.891–2.4470.1311.6560.881–3.1100.1170.9940.508–1.9470.986T3–T43.6432.131–6.228<0.0012.0731.145–3.7510.0163.1261.561–6.2570.0011.4830.682–3.2280.320Lymph node status N11.6701.106–2.5220.0151.3670.893–2.0940.1502.7231.538–4.8220.0012.5921.421–4.7300.002N2–N33.1512.015–4.929<0.0011.5970.953–2.6770.0754.1372.186–7.830<0.0012.7671.327–5.7730.007Metastasis status M17.8044.386–13.900<0.0014.3052.261–8.194<0.0017.0533.489–14.260<0.0013.5531.617–7.8070.002Risk group High-risk6.2574.331–9.039<0.0015.6433.894–8.175<0.0015.5203.407–8.944<0.0014.5782.797–7.494<0.001Table 3. Result of Kaplan–Meier and ROC analysis based on different regrouping methods.
Table 3. Result of Kaplan–Meier and ROC analysis based on different regrouping methods.
Progression-Free IntervalDisease-Specific SurvivalRegrouping FactorsSubgroupSample SizeKaplan–MeierROCKaplan–MeierROCp ValueAUC95% CIp Valuep ValueAUC95% CIp ValueAge, y ≦4094<0.0010.7960.693–0.899<0.0010.0010.7710.661–0.8810.002 41–60473<0.0010.7650.703–0.808<0.001<0.0010.7180.619–0.817<0.001 ≧61458<0.0010.7810.715–0.847<0.001<0.0010.7620.680–0.844<0.001Tumor size status T1261<0.0010.7560.661–0.850<0.0010.0030.7310.589–0.8730.005 T2601<0.0010.7580.700–0.816<0.001<0.0010.7150.641–0.789<0.001 T3–T4163<0.0010.7850.702–0.867<0.001<0.0010.7890.648–0.894<0.001Lymph node status N0498<0.0010.8190.762–0.875<0.001<0.0010.8050.717–0.894<0.001 N1343<0.0010.7330.665–0.801<0.001<0.0010.6940.613–0.775<0.001 N2–N3184<0.0010.7640.676–0.853<0.001<0.0010.7970.691–0.904<0.001Metastasis status
留言 (0)