


記住我
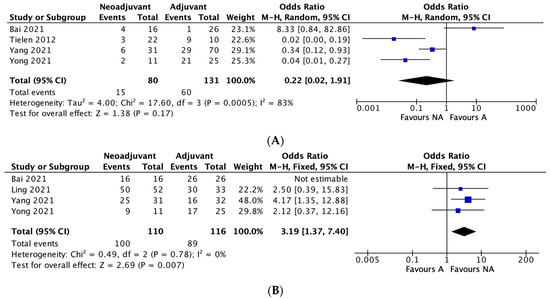


Figure 1. Histograms of IgG levels and infection rates. In the upper panel (A) there is a histogram reporting the serum IgG levels at baseline, after 3, 6 and 12 months of intravenous immunoglobulins (IVIG) or subcutaneous immunoglobulin (SCIG). Kruskal–Wallis test was used to analyse IgG levels in patients receiving IVIG and SCIG at different time points. Mann–Whitney test was used to compare IgG at same time point between patients receiving IVIG and SCIG. SCIG allowed patients to reach higher IgG trough levels than IVIG after at least 6 months of treatment. In particular, at month +6, IgG > 6 g/L was achieved by 33.2% and 52.3% of patients with IVIG and SCIG (p = 0.0322), respectively. In the lower panel (B) are shown the rates, expressed as events/person/year, of all infections and grade ≥ 3 (G3) events before and after IVIG and SCIG.
Figure 1. Histograms of IgG levels and infection rates. In the upper panel (A) there is a histogram reporting the serum IgG levels at baseline, after 3, 6 and 12 months of intravenous immunoglobulins (IVIG) or subcutaneous immunoglobulin (SCIG). Kruskal–Wallis test was used to analyse IgG levels in patients receiving IVIG and SCIG at different time points. Mann–Whitney test was used to compare IgG at same time point between patients receiving IVIG and SCIG. SCIG allowed patients to reach higher IgG trough levels than IVIG after at least 6 months of treatment. In particular, at month +6, IgG > 6 g/L was achieved by 33.2% and 52.3% of patients with IVIG and SCIG (p = 0.0322), respectively. In the lower panel (B) are shown the rates, expressed as events/person/year, of all infections and grade ≥ 3 (G3) events before and after IVIG and SCIG.
Figure 2. Cumulative incidence of infections and discontinuation. The upper panel on the left (A) shows the Kaplan–Meier curves of time to first infection in patients treated with intravenous immunoglobulins (IVIG) or subcutaneous immunoglobulin (SCIG). The upper panel on the right (B) shows the Kaplan–Meier curves of time to first infection in patients IVIG or SCIG, according to serum IgG levels. Patients achieving at least 6 g/L of IgG display a longer time to the first infection. In the lower-left panel (C) is shown the Kaplan–Meier curves of time to second infection in patients treated with IVIG or SCIG. In the lower-right panel (D) is shown the Kaplan–Meier of the cumulative incidence of discontinuation in patients treated with IVIG or SCIG. Log-rank test was used to compared survival curves.
Table 1. Clinical and biological features of patients.
Table 1. Clinical and biological features of patients.
VariablesAll PatientsIVIGSCIGp ValuesNumber of cases1164988-Median age (years)69 ± 10.167 ± 8.270 ± 8.00.0460Gender Male/Female63 (54%)/53 (46%)25 (51%)/24 (49%)49 (56%)/39 (44%)0.7208Binet stage
留言 (0)