

記住我
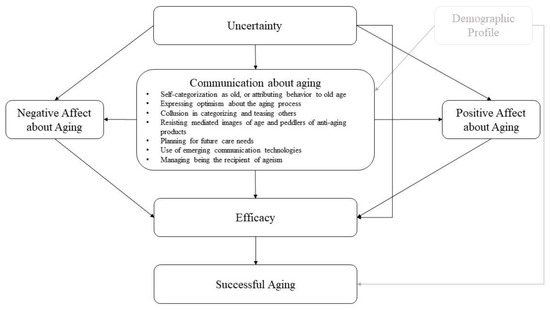


Figure 1. Time-series changes in acceleration during the stance phase of walking. The upper figure shows the vertical acceleration data, and the lower figure is the lateral acceleration data. The black line indicates pre−TKA, and the gray line indicates post−TKA.
Table 1. Preoperative and postoperative characteristics of the patients.
Table 1. Preoperative and postoperative characteristics of the patients.
VariablesPre-TKAPost-TKAp-ValueEffect Size (d)AVE±SDAVE±SDPain score (NRS)7.83 ±1.591.58±1.24<0.001 *4.38ROM in knee extension (°)−4.58 ±8.38−1.67±2.460.003 *0.47ROM in knee flexion (°)112.50 ±18.03115.25±13.340.0800.17FTA (°)185.58 ±5.11174.83±2.52<0.001 *2.67Table 2. Pearson correlation coefficients between the RMS and walking speed.
Table 2. Pearson correlation coefficients between the RMS and walking speed.
VariablesWalking Speed of Pre-TKAp-ValueWalking Speed of Post-TKAp-ValuerrRMS of anterior–posterior direction−0.280.357−0.610.027 *RMS of lateral direction−0.330.271−0.180.553RMS of vertical direction−0.660.014 *−0.630.021 *Table 3. RMS of COM during the walking stance phase.
Table 3. RMS of COM during the walking stance phase.
VariablesPre-TKAPost-TKAp-ValueEffect Size (d)AveSDAveSDAnterior–posterior direction1.42±0.261.34±0.650.1980.16Lateral direction0.86±0.230.73±0.190.035 *0.62Vertical direction1.53±0.391.36±0.360.047 *0.45Table 4. Changes in lateral acceleration during the walking stance phase.
Table 4. Changes in lateral acceleration during the walking stance phase.
Pre−TKAPost−TKAp-ValueEffect Size (d) AveSDAveSDAcceleration in the medial direction at the early stance phase (m/s2)1.51±0.731.35±0.540.3270.25Acceleration in the lateral direction at the early stance phase (m/s2)0.58±0.680.10±0.600.007 *0.75Acceleration in the lateral direction at the late stance phase (m/s2)1.62±0.970.95±0.80<0.001 *0.75Table 5. Changes in vertical acceleration during the walking stance phase.
Table 5. Changes in vertical acceleration during the walking stance phase.
Pre−TKAPost−TKAp-ValueEffect Size (d) AveSDAveSDAcceleration in the upward direction at the early stance phase (m/s2)2.77±0.702.53±0.730.3080.34Acceleration in the downward direction at the stance phase (m/s2)1.85±0.651.81±0.610.8180.06Acceleration in the upward direction at the late stance phase (m/s2)3.23±0.862.74±0.730.020 *0.61
留言 (0)