Expression and purification of MtSK
For the purification of the recombinant MtSK protein, cell growth was performed on a larger scale with the expression condition determined and described by Oliveira et al. [9] with modifications. Briefly, the recombinant plasmid containing the aroK gene (pET-23a(+)::aroK) was used to transform electrocompetent E. coli BL21(DE3) cells (Novagen). Transformed cells were selected on LB agar plates containing 50 µg mL−1 ampicillin. For a pool of cells, 20 colonies from the plate were resuspended in 600 µL of liquid LB medium. After homogenization, 50 µL of this pool were inoculated into 1.5 L of LB medium containing 50 µg mL−1 ampicillin. After reaching an optical density (OD600nm) of 0.4–0.6, the cells were grown at 37 °C in shaker flasks at 180 rpm for a period of 23 h, without IPTG induction. Cells were then collected by centrifugation at 6000×g for 20 min at 4 °C and stored at − 80 °C.
The protein was purified using the ÄKTA purification system (GE HealthCare) through a high-performance liquid chromatography system based on the protocol described by Rosado et al. [10] with modifications. Approximately 6 g of cells were resuspended in 24 mL of 50 mM Tris HCl pH 7.6, disrupted by sonication, and the insoluble fraction removed by centrifugation (18,000 rpm, 30 min, 4 °C). MgCl2 was added to the supernatant at a final concentration of 40 mM, followed by the addition of 1 mg of DNAse under stirring for 30 min at 4 °C and subsequently centrifuged (18,000 rpm, 30 min, 4 °C). The addition of MgCl2 resulted in the precipitation of the target protein keeping other contaminants in the supernatant. The precipitate (insoluble fraction) was resuspended in 20 mL of 50 mM Tris HCl 500 mM KCl pH 7.6 and then centrifuged (18,000 rpm, 15 min, 4 °C). To the supernatant, 20 mL of 50 mM Tris HCl 500 mM KCl (NH4)2SO4 2 M pH 7.6 was added, under stirring for 30 min, and then centrifuged (18,000 rpm, 30 min, 4 °C).
The supernatant was loaded onto a hydrophobic interaction column, Phenyl Sepharose 16/10 (GE HealthCare), previously equilibrated with buffer A (50 mM Tris HCl, 500 mM KCl, 1 M (NH4)2SO4, pH 7.6). MtSK interacted with the column and eluted in a linear gradient of 10 column volumes containing buffer B (50 mM Tris HCl, 500 mM KCl, pH 7.6), at a flow rate of 1 mL min−1. Fractions containing the homogeneous recombinant protein MtSK were confirmed by 12% acrylamide gel electrophoresis (SDS-PAGE) stained with Coomassie Brilliant Blue [11]. The protein, after being concentrated using an Amicon ultrafiltration cell (MWCO 10,000 Da), was then centrifuged (18,000 rpm, 30 min, 4 °C), the supernatant was collected, and the concentration was determined by the BCA Kit (BCA Protein Assay Kit).
Docking procedures
The crystallographic structures of the MtSK protein were obtained from the Protein Database (PDB) (http://www.pdb.org, accessed on: 24 June 2021). Among the 21 deposited MtSK structures, 12 had compounds showing interactions with the SKM substrate active site (PDB Access Codes: 4BQS, 2IYQ, 2IYS, 2IYR, 2G1K, 2IYX, 2IYY, 2IYZ, 2DFN, 1U8A, 1ZYU and 1WE2). For the docking, the following structures were selected: 2IYQ [12] (structure with closed LID, MtSK:SKM:ADP complex, 1.80 Å resolution) for its high resolution (< 2 Å) and for its closed conformation, and 2IYS [12] (structure with LID open(A), MtSK:SKM complex, 1.40 Å resolution) for being the best resolution among all the deposited crystallographic structures and for containing shikimate in the active site of the structure.
The compounds tested in this work were synthetized by CPBMF from Pontifícia Universidade Católica do Rio Grande do Sul, Brazil. The machine-learning plataform pkCSM [8] was used for a preliminary analysis regarding the toxicity of these compounds. A set of 1212 molecules passed through the AMES toxicity filter to select molecules without toxic or hepatotoxic character for the subsequent computer simulations. It is important to note that the compounds were analyzed manually to avoid structure duplication on the platform. From the screening, 298 molecules were selected for docking. The 3D structures of the compounds from the CPBMF database were draw using Avogadro v1.2.0 program and the protonation states were set according to pH 7.4.
Initially, the re-docking protocol was validated with two crystallographic structures of MtSK. The SKM was removed from both structures generating two different conformations: one containing ADP in the active site and the second in the apo-form (PDB ID 2IYQ and 2IYS, respectively) [12]. The aim at performing this step was to determine whether the docking algorithm can recover the crystallographic position of the ligand in the active site of the target protein.
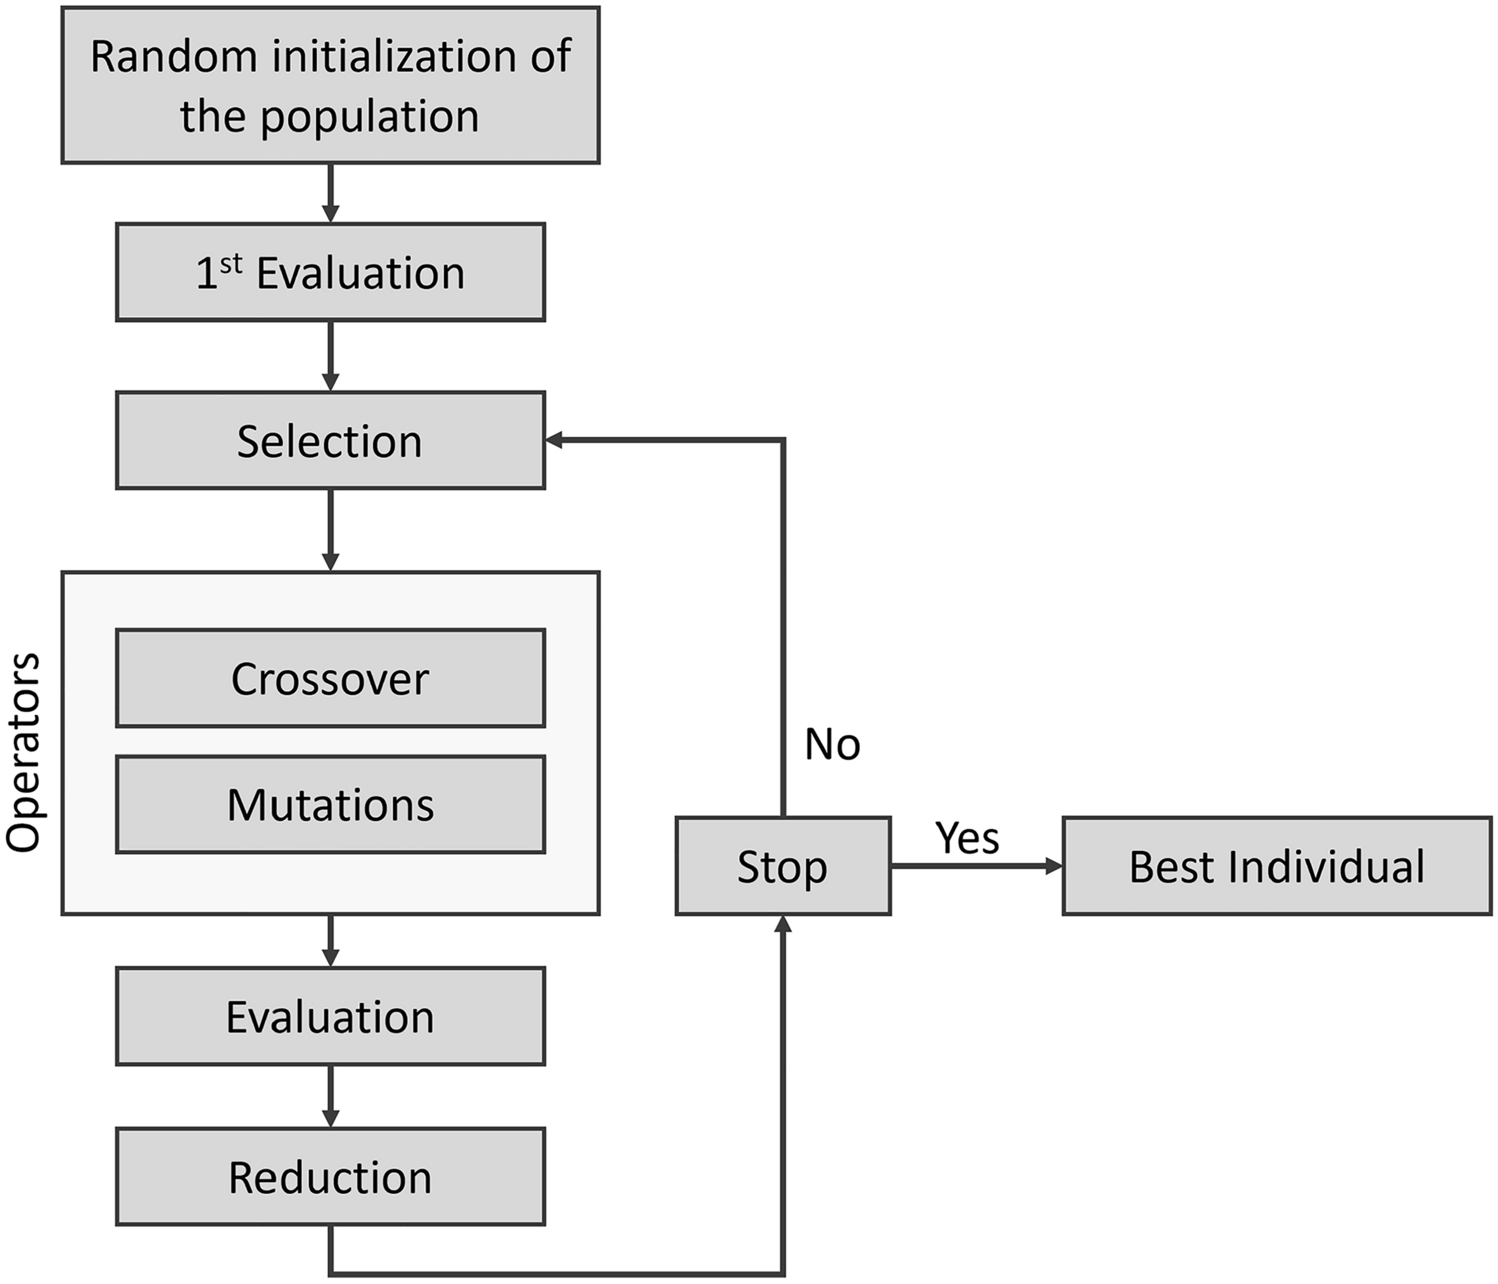
The molecules of the chemical library of CPBMF were docked in 2IYQ and 2IYS, using the AutoDock Vina 1.1.2 software compiled to PyRx to identify the ligands with the best binding energies in relation to the target protein [13, 14]. To complete the robustness of the method, the Lamarckian genetic algorithm was assigned, which is a computational approach that provides a set of potential ligand conformations as the principles proposed by Darwin during the molecular adjustment process [15]. The PyRx was used for energy minimization of compounds and to convert all molecules to AutoDock Ligand (PDBQT) format. The established docking protocol was performed as follows: the SK was kept rigid, while the torsional angles of the binder could undergo variations. Water and other compounds used to obtain the crystal were removed from each structure before docking. The 2IYS and 2IYQ structures were used as macromolecules (receptors) [12]. The search space that encompassed the SKM active site was set on a cubic grid, spaced at 0.375 Å, (in both crystallographic structures) with the following dimensions in Å: center (x, y, z) = (36, 36, 30), dimensions (x, y, z) = (15, 15, 15) (PDB: 2IYQ); center (x, y, z) = (15, 20, 33), dimensions (x, y, z) = (15, 15, 15) (PDB: 2IYS). The docking simulation was then run at an exhaustiveness of eight and set to produce a pose ranking (from lowest to highest energy). Subsequently, these ligands were submitted to the PyMOL software (The PyMOL Molecular Graphics System, Version 2.5 Schrödinger, LLC, https://www.pymol.org) and Discovery Studio Visualizer program (CDOCKERDock, Dassault Systemes BIOVIA, USA) for visual inspection of the poses of potential ligands in the active site of the protein in both conformations.
Inhibition studiesEnzymatic assays
The MtSK enzyme activity assay was performed in the forward direction by coupling the ADP product to the enzyme pyruvate kinase (PK; EC 2.7.1.40) and lactate dehydrogenase (LDH; EC 1.1.1.27) in a spectrophotometer (UV-2550 UV)/Visible, Shimadzu). The NADH-dependent oxidation was monitored continuously at 340 nm (ε = 6.22 × 10³ M−1 cm−1). The reactions were performed at 25 °C, initiated by the addition of recombinant MtSK (2 µg mL−1) and monitored for 90 s. The reaction mixture was composed of 100 mM Tris HCl, 100 mM KCl, 5 mM MgCl2 pH 7.6, 1.5 mM PEP, 0.2 mM NADH, 600–100 U mL−1 PK and 900–1400 U mL−1 LDH. The substrates were fixed at KM, SKM 650 µM and ATP 112 µM [10]. The ligands were individually added to the reaction mixture at a final concentration of 50 µM, and the final concentration of DMSO that demonstrated not to interfere with the test conditions was 2%.
Determination of the minimum inhibitory concentration (MIC) in M. tuberculosis
The determination of the MIC was performed according to the methodology described by Giacobbo and collaborators [16]. The pan-sensitive Mtb H37Rv laboratory strain was used in these studies. The tests were performed in 96-well polystyrene microplates with a “U” shaped bottom. The ligands selected by docking were tested in triplicate for greater reliability of the results. The compounds were solubilized in DMSO and later diluted in Middlebrook 7H9 (7H9) medium containing 10% ADC (albumin, dextrose, and catalase) to a final concentration of 2.5–40 µg mL−1. Serial dilutions of each compound were made directly in the plates. The first-line drug isoniazid (INH) (MIC = 0.31 µg mL−1) was used as a positive control for the experiment. As negative controls, a sterility control of the compounds (without mycobacteria) and a bacterial growth control without the addition of antibiotics (only mycobacterial culture) were used. The mycobacterial strains were cultured in 7H9 medium containing 10% OADC (oleic acid, albumin, dextrose, and catalase) and 0.05% Tween 80, until an OD600 between 0.8 and 1.0. The cells were then shaken with sterile glass beads (4 mm) for 5 min to break up any existing clumps. The Mtb suspensions were divided into aliquots, which were stored at − 80 °C. A 100 µL aliquot of suspension (theoretical OD = 0.006). The final concentration of DMSO in each well is 2.5%. The plates were covered, sealed with parafilm and incubated at 37 °C. After the 7-day incubation period, 60 µL of resazurin solution (0.01%) was added to each well, and the samples incubated for another 48 h [17]. A change in color from blue to pink indicates bacterial growth, and the MIC was defined as the lowest concentration capable of preventing color change. Three tests were performed independently, and the MIC value presented here was the most frequent value among the tests, or the highest value observed among them.


留言 (0)