
記住我


Of the 21 patients, 17 were male, and 4 were female, with a median age of 68 years (range 33–80). The maximum size of the carcinomas ranged from 2.5 cm to 14 cm, with a mean of 7.04 ± 2.89 cm. Histologically, 9 cases showed pure undifferentiated carcinoma, and the remaining 12 cases presented dedifferentiated carcinomas with visible differentiated adenocarcinoma components. Other significant findings included rhabdoid morphology in 8 cases, extensive necrosis in 7 cases, and vascular invasion in 13 cases. Microscopically, the undifferentiated carcinomas or undifferentiated components showed a sheet-like growth pattern with incohesive cells ranging from small round to large pleomorphic. Some carcinoma cells contained abundant eosinophilic cytoplasm showing rhabdoid morphology, whereas others contained reduced cytoplasm and increased nuclear/cytoplasmic ratio showing an immature appearance. The main clinicopathological features of the 21 cases are summarized in Table 2.
Table 2 Clinicopathologic features of 21 cases with undifferentiated/dedifferentiated gastric carcinomaImmunohistochemical findingsAll 21 enrolled cases showed the focal or variable intensity of CK-pan expression. We observed SMARCA2 loss in 12 cases (57.14%), ARID1A loss in 5 cases (23.81%), and SMARCA4 loss in 3 cases (14.29%); however, we did not find any case showing SMARCB1 or ARID1B loss. Taken together, 14 cases (66.67%) showed any one of the SWI/SNF complex subunits loss, including 3 cases with ARID1A and SMARCA2 co-loss and 3 cases with SMARCA4 and SMARCA2 co-loss (Fig. 1). Of note, the ARID1A and SMARCA2 co-loss group showed MMR protein deficiency and P53 wild type; conversely, the SMARCA4 and SMARCA2 co-loss group showed MMR protein proficiency and P53 mutation. MMR proteins deficiency was observed in 5 cases, of which all showed PMS2 loss, 3 showed MLH1 loss, 1 showed MSH6 loss, and none showed MSH2 loss. CSC phenotype was observed in 12 cases, including SOX2 positive expression in 11 cases and SALL4 positive expression in 5 cases. 11 cases showed P53 mutations, and 9 cases showed PD-L1 positive. Details of the immunohistochemical staining results are summarized in Table 3.
Fig. 1
The Venn diagram showed concurrent loss of ARID1A, SMARCA2, and SMARCA4. The loss of SARMCA2 occurred most frequently and was often accompanied by simultaneous loss of other subunits. The 3 cases with SMARCA4 loss all showed concomitant SMARCA2 loss (i.e., SMARCA4 and SMARCA2 co-loss). Three cases showed ARID1A and SMARCA2 co-loss
Table 3 Immunohistochemistry results of 21 cases with undifferentiated/dedifferentiated gastric carcinomaWe found a typical dedifferentiated carcinoma (case 17) and a typical rhabdoid undifferentiated carcinoma (case 8) in this study (Fig. 2). H&E image of case 17 (A, × 40) showed the coexistence of normal glands, well-differentiated adenocarcinoma components, and undifferentiated components in which SMARCA2 expression was reduced (B, × 200), and ARID1A expression was intact (C, × 200). H&E image of the case 8 presented a non-cohesive sheet-like structure (D, ×100) and rhabdoid cell morphology (G, ×400) with loss of expression of SMARCA2 and ARID1A (E, F, ×200), and intact expression of SMARCA4 and SMARCB1 (H, I, ×200).
Fig. 2
Representative images of dedifferentiated carcinoma and rhabdoid undifferentiated carcinoma. Case 17 was a typical dedifferentiated carcinoma and showed the coexistence of normal glands, well-differentiated adenocarcinoma components, and undifferentiated components at low magnification (A, arrows, × 40). The undifferentiated components showed reduced expression of SMARCA2 (B, × 200) and intact expression of ARID1A (C, × 200). Case 8 was a typical rhabdoid undifferentiated carcinoma and showed a non-cohesive sheet-like growth pattern at low magnification (D, × 100). The neoplastic cells presented polygonal or round with abundant eosinophilic cytoplasm, and the nuclei were large and vacuolated with prominent nucleoli at high magnification (G, ×400). SMARCA2 and ARID1A showed a complete loss, accompanied by strong staining of the surrounding lymphocytes (E, F, ×200), while SMARCA4 and SMARCB1 showed diffuse intense staining (H, I, ×200)
We observed a heterogeneous expression of SMARCA2 and PD-L1 in case 15 (Fig. 3). In the adenocarcinoma components, SMARCA2 was intact (B, × 200) and PD-L1 was negative (C, × 200); conversely, in the undifferentiated components, SMARCA2 showed lost (H, × 200) and PD-L1 showed positive (I, × 200).
Fig. 3
Heterogeneous expression pattern of SMARCA2 and PD-L1 in dedifferentiated carcinoma (case 15). Prominent adenocarcinoma components and undifferentiated components were observed in case 15 (D, arrows, ×40). The adenocarcinoma components showed a prominent glandular cavity (A, × 200), and the undifferentiated components showed neoplastic cells loosely arranged in a patchy pattern, a moderate amount of pale eosinophilic cytoplasm with a large nucleus; focal cytoplasm showed clear (G, ×200). In the adenocarcinoma components, SMARCA2 was intact (B, × 200), and PD-L1 was negative (C, × 200); while in the undifferentiated components, SMARCA2 showed complete loss (H, × 200), and PD-L1 showed diffused moderate positive expression (I, × 200)
We found two kinds of histological structures in case 21 (Fig. 4): nested and sheet-like structures (D×20, A, G×100), composed of undifferentiated neoplastic cells with distinct immunohistochemical expression profiles. In sheet-like structures, SMARCA4 was intact (B, ×100) and SOX2 was negative (C, ×100), while in nested architectures, SMARCA4 was lost (H, ×100) and SOX2 was positive (I, ×100).
Fig. 4
Heterogeneous expression pattern of SMARCA4 and SOX2 in undifferentiated carcinoma (case 21). Two kinds of histological structures were observed in case 21: nested and sheet-like structures (D, arrows, ×20), both of which were composed of undifferentiated neoplastic cells. In the sheet-like structure, neoplastic cells showed a pleomorphic appearance with abundant eosinophilic cytoplasm, and multinucleated tumor giant cells were occasionally observed (A, arrows, ×100). The nested structure was composed of monotonous small round neoplastic cells with poor cohesion, scant cytoplasm, and large nuclei (G, ×100). In sheet-like structure, SMARCA4 was intact (B, ×100) and SOX2 was negative (C, ×100), while in nested architecture, SMARCA4 showed complete loss (H, ×100) and SOX2 showed diffused intense positive expression (I, ×100)
Correlation analysisWe performed correlation analyses between the expression status of SWI/SNF complex and clinicopathological characters and found that the CSC phenotype was more likely to appear in the SWI/SNF complex deficient group (P = 0.0158) (Table 4).
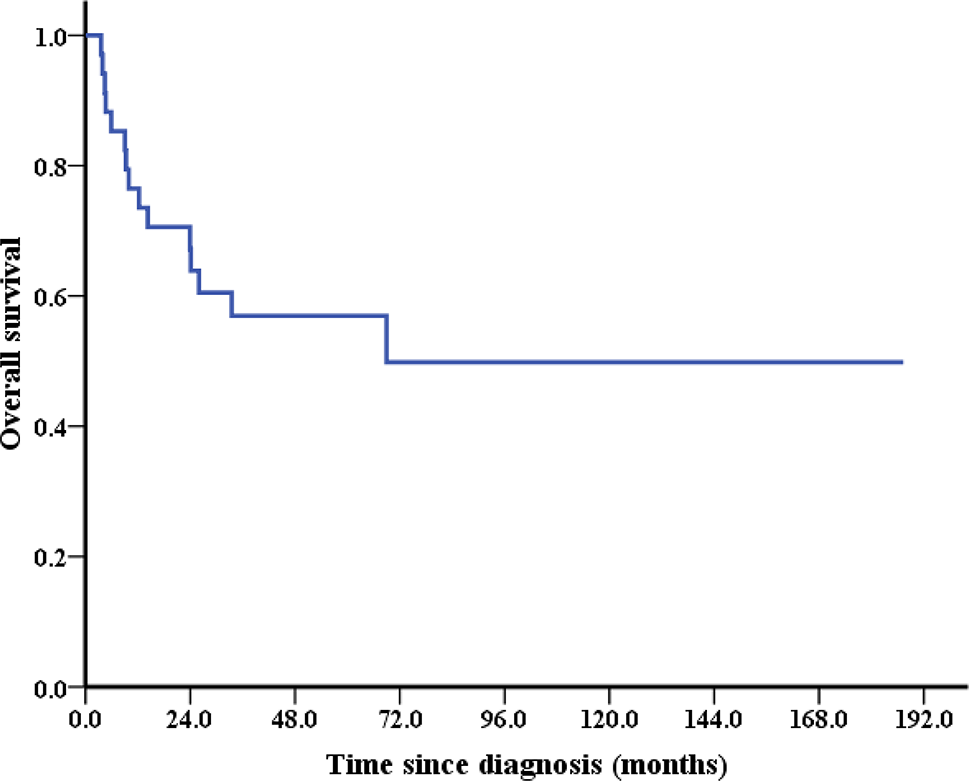
Table 4 Correlations of the SWI/SNF complex with clinicopathological charactersPrognostic analysisSurvival analysis revealed that SWI/SNF complex deficiency, undifferentiated status, and CSC phenotype were associated with worse survival (P = 0.00084, 0.0062, and 0.038, respectively). For SWI/SNF complex subunits, both SMARCA2 and SMARCA4 showed worse survival in the lost group (P = 0.00014, and 0.039, respectively), whereas loss of ARID1A was not associated with survival (Fig. 5). We performed univariate Cox regression analysis and screened four variables with P < 0.1, including differentiation type, SMARCA4, SWI/SNF complex, and CSC phenotype (Table S1). In the subsequent multivariate Cox regression analysis, we included not only the above four variables but also the T stage and N stage, which were acknowledged to have an essential influence on prognosis. Finally, we obtained three variables independently associated with prognosis: differentiation type, SWI/SNF complex, and N stage (Fig. 6).
Fig. 5
Kaplan-Meier survival curves for the undifferentiated and dedifferentiated gastric carcinoma. SWI/SNF complex deficient, undifferentiated status, CSC phenotype, SAMRCA2 loss, and SAMRCA4 loss were detrimental to overall survival (A, B, C, D, E). While ARID1A expression status had no impact on overall survival (F). OS, overall survival; Dediff, dedifferentiated; Undiff, undifferentiated; CSC, cancer stem cell
Fig. 6
Forest plot of multivariate Cox regression analysis. Three variables independently associated with prognosis were screened: differentiation type, SWI/SNF complex, and N stage. HR, hazard ratio; CI, confidence interval; CSC, cancer stem cell
留言 (0)