

記住我


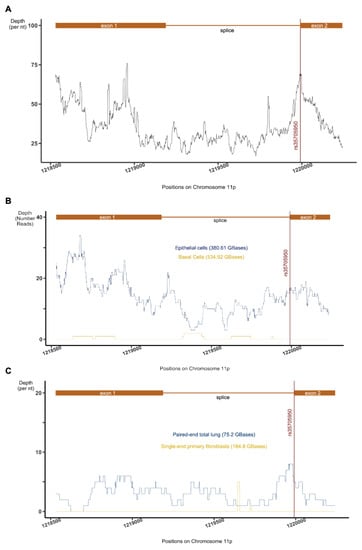


Figure 1. Flowchart of study selection for the present study.
Table 1. The characteristics of included studies.
Table 1. The characteristics of included studies.
First Author, YearCountryEthnicitySample SizeGenotype Distribution (MM/Mm/mm)p Value for HWENOS ScoreCases ControlAbdulah, 2008United StatesCaucasian310/560139/121/50147/277/1360.888Zhou, 2008ChinaAsia1360/1360702/520/138592/605/1630.758Chen, 2009ChinaAsia212/232107/69/3671/114/470.968Kumar, 2011IndiaAsia301/424137/124/40174/190/600.637Cakmak, 2015TurkeyCaucasian220/24083/101/36102/118/200.217El-Menyar, 2015EgyptAsia236/152146/77/1284/58/1017Yang, 2018ChinaAsia540/548247/236/57244/251/530.498García-González, 2021YucatanCaucasian98/10123/53/2226/51/240.94 8Table 2. Results of overall and subgroup analyses.
Table 2. Results of overall and subgroup analyses.
Genetic ModelPopulationNumber of StudiesTest of AssociationTest of HeterogeneityOR (95%CI)pPhI2, %ModelC vs. GTotal80.91 [0.79, 1.05]0.200.00270RAsian50.82 [0.71, 0.95]0.0070.0557RCaucasian31.12 [0.96, 1.30]0.160.339FCG vs. CC Total80.86 [0.78, 0.96]0.0070.000972RAsian50.85 [0.75, 0.95]0.0050.00165RCaucasian30.91 [0.70, 1.19]0.480.0285RGG vs. CCTotal80.80 [0.57, 1.12]0.190.000275RAsian50.76 [0.61, 0.91]0.0020.2624FCaucasian30.94 [0.30, 2.97]0.92<0.000191RGG + CGvs.CC Total80.78 [0.71, 0.86]0.13<0.0000137FAsian50.79 [0.70, 0.88]0.12<0.000146FCaucasian30.78 [0.63, 0.96]0.150.0247FGGvs.CC + CG Total80.92 [0.73, 1.16]0.470.0354RAsian50.88 [0.75, 1.05]0.150.770FCaucasian31.04 [0.47, 2.29]0.920.00185R
留言 (0)