Baseline characteristics
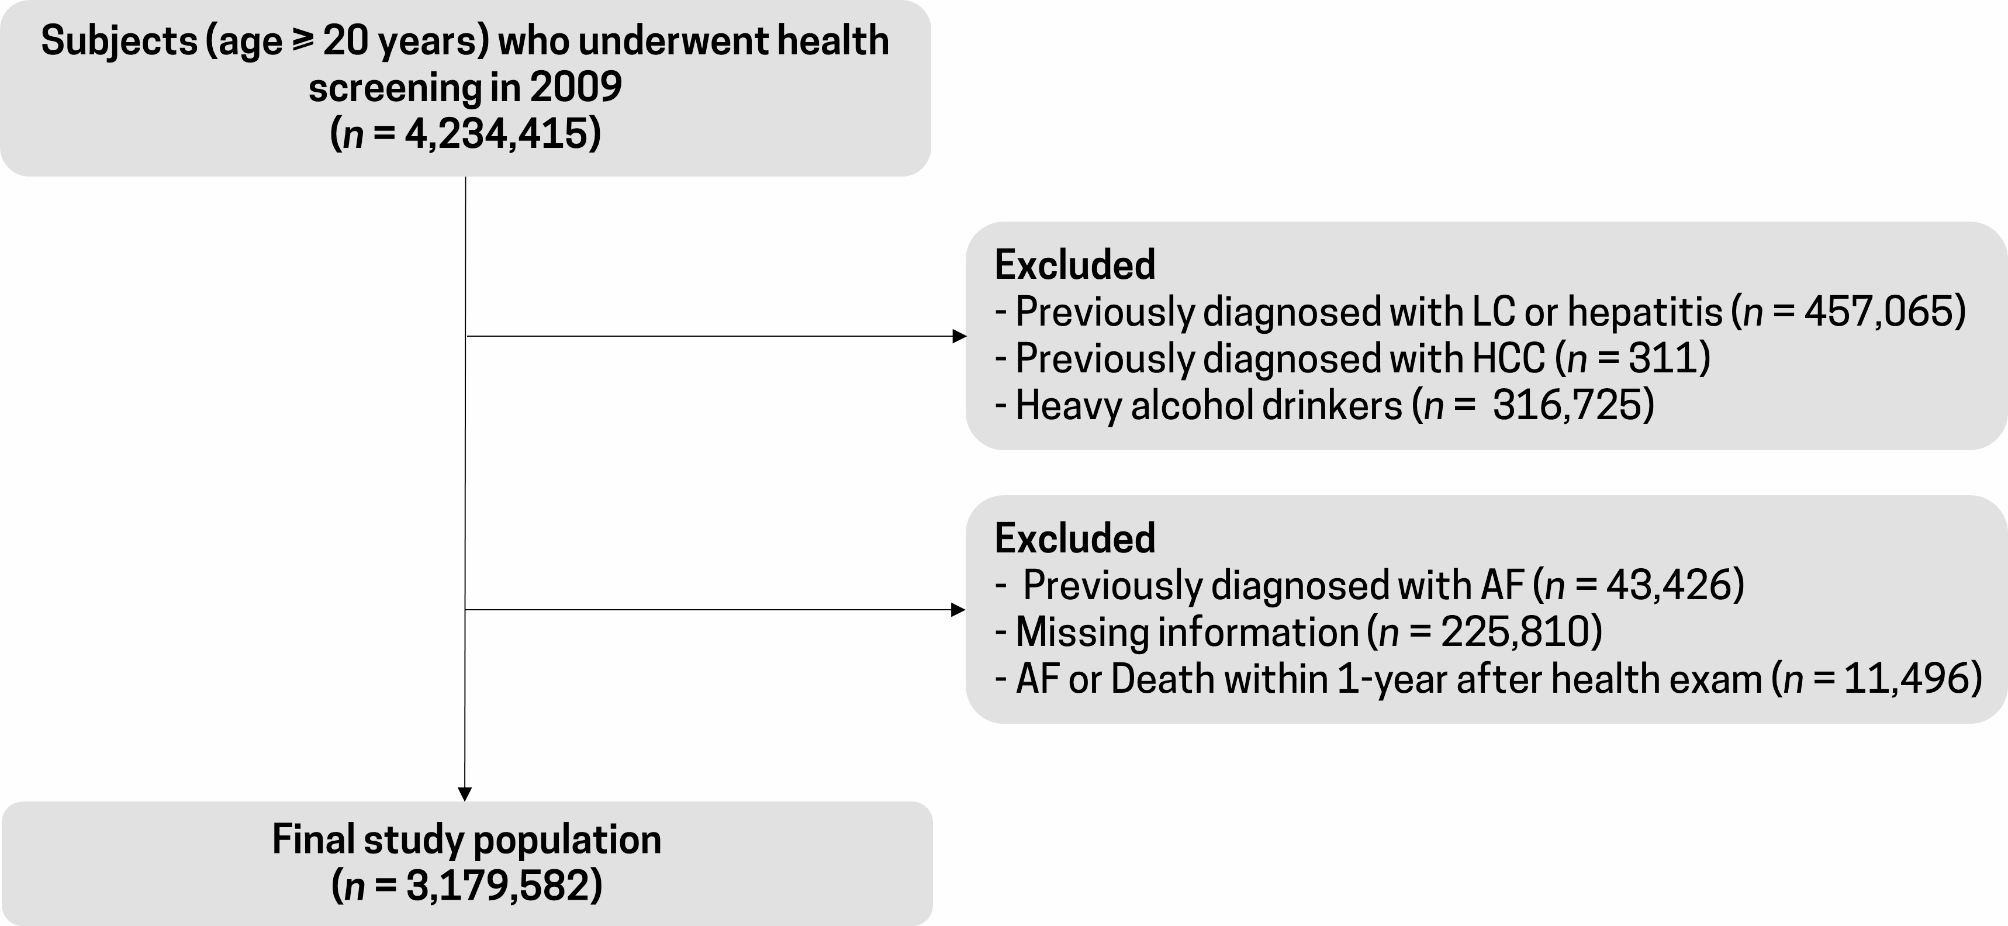
Of 71,663 patients identified, 40,083 were initially excluded for the following reasons: patients had only a single visit, received metformin monotherapy, received metformin plus other antihyperglycemic drugs not included in our list of interest (e.g., alpha glucosidase inhibitors or insulin), or received triple combination therapy. Of 31,580 remaining patients, 6,803 were excluded due to the occurrence of CKD before or within one month following receipt of the second-line medication, leaving 24,777 patients for analysis with mean (SD) follow-up time of 4.1 (3.1) years, see Fig. 1. There were 17,387 (70.2%), 3,042 (12.3%), 4,032 (16.3%), 316 (1.3%), and 185 (0.7%) patients who received either SU, TZD, DPP4i, SGLT2i, and GLP1-RA, respectively. Finally, those in receipt of GLP1-RA were not included in the analysis due to the small number of patients and outcomes available.
Most baseline patient characteristics differed across treatment groups, see Table 1. DPP4i patients tended to be older, were more likely to be female and hypertensive; the SU group had higher mean FPG and HbA1c, lower mean eGFR, higher mean ACR, and a higher proportion of DLP. Those in receipt of SGLT2i tended to have a higher mean BMI and eGFR, lower mean ACR, and were more likely to have a history of CVD and hypertension. In addition, patients in the SGLT2i group had longer duration of first-line treatment than the other groups, except TZD.
Table 1 Baseline characteristics of second-line antihyperglycemic drugsTreatment model
Variables that were significantly associated with second-line drug allocation included age, sex, BMI, FPG, eGFR, HT, CVD, LDL-C, HDL-C, triglycerides, and statin use, see Additional file 1: Table S2. These variables including use of angiotensin-converting enzyme inhibitors (ACEi) or angiotensin receptor blockers (ARB) were retained in the TM to estimate the propensity score. Before weighting by inverse propensity score, the absolute standardized mean differences ranged from 0.0012 to 0.2837, 0.0031 to 0.2436, and 0.0259 to 0.5720 for TZD vs. SU, DPP4i vs. SU, and SGLT2i vs. SU, respectively (see Table 2). After weighting by inverse propensity score, the absolute standardized mean differences were close to zero, i.e., ranging from 0.0004 to 0.0803, 0.0003 to 0.0227, and 0.0026 to 0.1604; variance ratios were, in the main, close to one (see balance plots, Additional file 1: Figure S1), confirming that these variables were comparable across treatment groups and overlapping with positive probabilities (see Additional file 1: Figure S2).
Table 2 Estimated standardized mean difference between treatment groups before and after propensity score weightingCKD events and outcome model
CKD was identified in 4,132 of the 24,777 patients (16.7%). The incidence (95% CI) of CKD by treatment group was 4.1% (2.2%, 6.9%), 13.5% (12.5%, 14.6%), 14.8% (13.5%, 16.1%), and 18.0% (17.4%, 18.5%) for SGLT2i, DPP4i, TZD, and SU, respectively.
Variables significantly associated with CKD and thus remaining in the OM were age, sex, duration of first-line treatment, HT, PAD, DR, and HDL-C, see Additional file 1: Table S2. Results for all IPWRA approaches are described in Tables 3 and 4. For the ITT approach, the POMs (95% CI), i.e., the risk of CKD development in SGLT2i, DPP4i, TZD, and SU groups were 0.037 (0.012, 0.063), 0.133 (0.122, 0.143), 0.175 (0.157, 0.193), and 0.179 (0.173, 0.185), respectively, see Table 3. The ATE (i.e., the difference of POM) of SGLT2i, DPP4i, and TZD compared to SU were − 0.142 (− 0.167, − 0.116), − 0.046 (− 0.059, − 0.034), and − 0.004 (− 0.023, 0.014), respectively, representing significant reductions in CKD risk of 14.2% and 4.6% in the SGLT2i and DPP4i groups, respectively, compared to the SU group, with no significant difference between TZD and SU groups, see Table 4. In addition, CKD risk was 13.7% (10.6%, 16.8%) and 4.2% (2.1%, 6.3%) significantly lower in SGLT2i and DPP4i when compared to TZD. Furthermore, SGLT2i significantly reduced CKD risk by 9.5% (6.8%, 12.2%) when compared to DPP4i.
Table 3 Estimation of potential outcome means between second − line drugs: Treatment effect model with inverse probability weighting and regression adjustmentTable 4 Estimation of treatment effects between second − line drugs: Treatment effect model with inverse probability weighting and regression adjustmentThe PPA approach showed similar trends in treatment effects as ITT with POMs in SGLT2i, DPP4i, TZD, and SU groups of 0.024 (0.002, 0.046) 0.146 (0.132, 0.161), 0.194 (0.172, 0.216), and 0.201 (0.193, 0.208), respectively. The ATEs of SGLT2i, DPP4i, and TZD compared to SU were − 0.177 (− 0.200, − 0.154), − 0.055 (− 0.071, − 0.039), and − 0.007 (− 0.030, 0.016), respectively, representing significant reductions in CKD risk of 17.7% and 5.5% in the SGLT2i and DPP4i compared to the SU groups. In addition, SGLT2i significantly reduced CKD risk by 20.1% and 14.9% compared to TZD and DPP4i, respectively. The modified ITT yielded similar results as the ITT approach.


留言 (0)